By Piranha Profits Team
Last updated on September 19, 2025
Over the past five years, Apple (AAPL) has continued to reward long-term investors as a steady compounder. Its brand recognition remains unmatched, enabling the company to charge premium prices while maintaining one of the most loyal customer bases in the world. Apple’s tightly integrated ecosystem creates high switching costs — once consumers adopt the iPhone, iPad, Mac, or Apple Watch, the seamless experience across hardware, software, and services makes it difficult to leave.
Photo by Sumudu Mohottige on Unsplash
As consumers, we see Apple’s ecosystem every day: premium products, recurring service subscriptions, and an iconic brand that commands loyalty. From an investor’s perspective, these translate into:
- Recurring Revenue Streams: Driven by services like iCloud, Apple Music, Apple Pay, and the App Store.
- Pricing Power: Premium positioning allows higher margins relative to peers.
- High Switching Costs: Customers embedded in the Apple ecosystem rarely switch, strengthening retention and future growth potential.
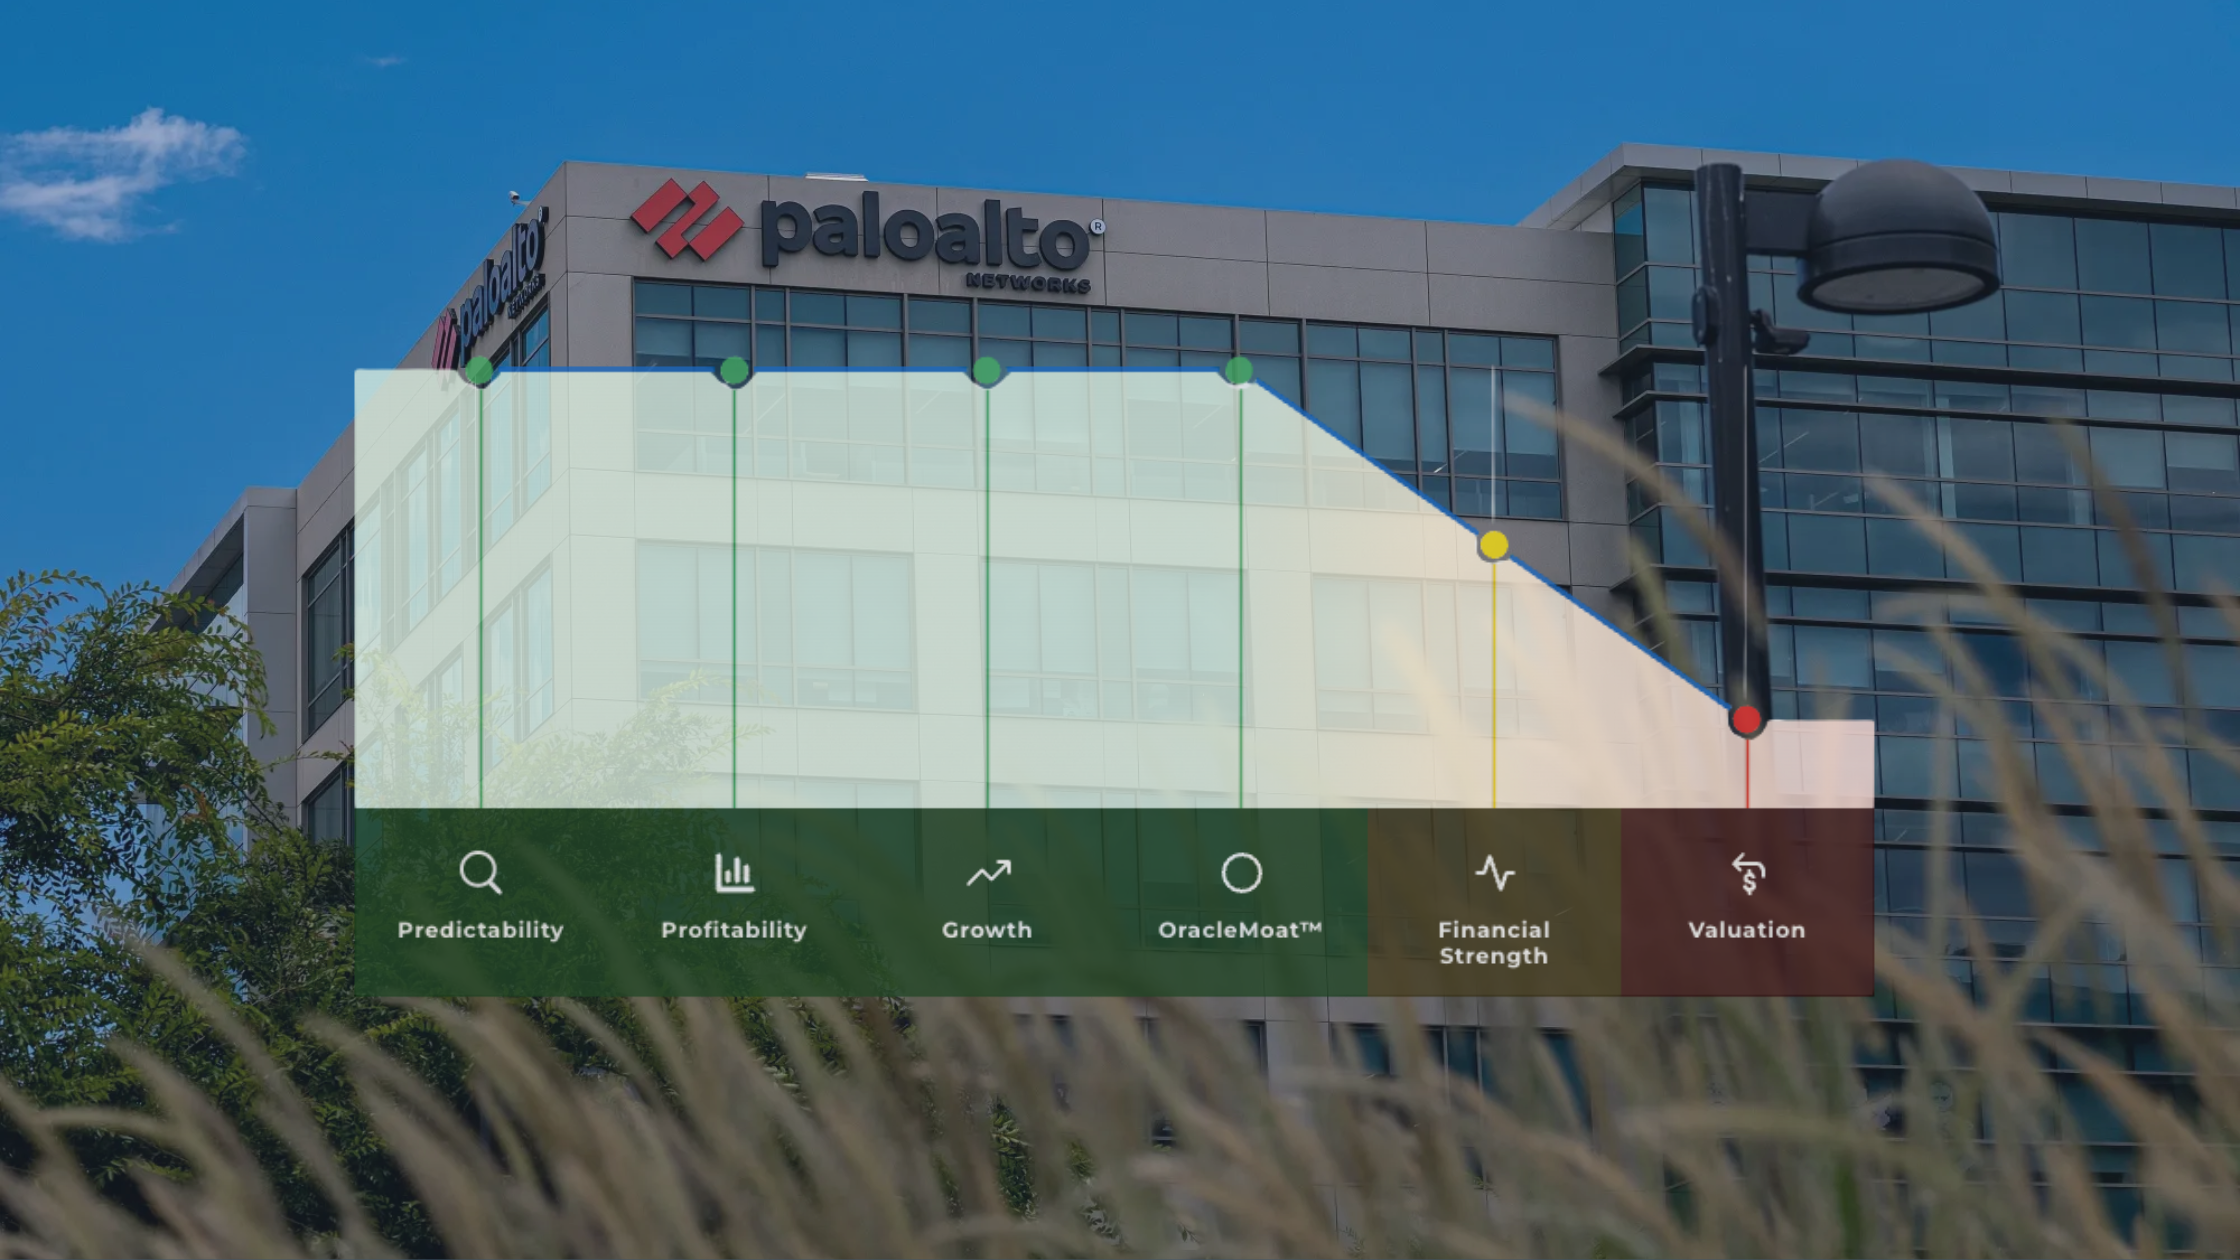
StockOracle’s OracleIQ™ Analysis on Apple (AAPL)
Comprehensive First-load research data on Apple Inc. (AAPL) powered by StockOracle™ - 11th September 2025
Apple (AAPL) Predictability Rank
Apple scores high on predictability due to its stable cash flows and global brand power.

Apple Inc. Financials Trend Chart (AAPL) powered by StockOracle™ - 11th September 2025
The chart shows Apple’s revenue rising steadily from 2020 through the TTM, with growth slowing slightly after 2022 but maintaining a consistent upward trend. Operating income and net income closely mirror this movement, with stable margins and no major fluctuations, highlighting Apple’s efficiency and reliable profitability.
Apple (AAPL) Profitability Rank
Apple continues to deliver strong profitability, with margins well above industry peers. Services (24.5% of total revenue in 2024) provide higher profit margins compared to hardware, cushioning the impact of hardware cycles.

Apple Inc. Financials Trend Chart (AAPL) powered by StockOracle™ - 11th September 2025
The chart highlights Apple’s exceptional capital efficiency. Its ultra-high ROE is largely driven by capital returns (buybacks) and profitability, while ROIC demonstrates that underlying operations remain robust. ROA, though naturally lower, confirms Apple’s ability to generate healthy returns even on its massive asset base.
Apple (AAPL) Growth Rank
Growth expectations are muted. Since 2022, Apple has seen stagnation or slight dips across revenue, operating income, and free cash flow.

Apple Inc. Projected Rate (AAPL) powered by StockOracle™ - 11th September 2025
StockOracle™ flags this as a low-to-medium growth outlook, especially with Greater China revenues down 7.7% year-on-year.
Apple (AAPL) Financial Strength Rank
Apple maintains strong balance sheets, with significant cash reserves and manageable debt. Its efficiency metrics remain excellent, underscoring its ability to generate returns even in slower growth environments.

Apple Inc. Total Debt Chart powered by StockOracle™ - 11th September 2025
Apple (AAPL) Economic Moat
Apple ranks extremely high on OracleMoat™ (9/10). Its moat stems from brand dominance, ecosystem lock-in, and global network effects. Few competitors can replicate its integrated model of hardware + software + services, allowing Apple to sustain supernormal profits over decades.
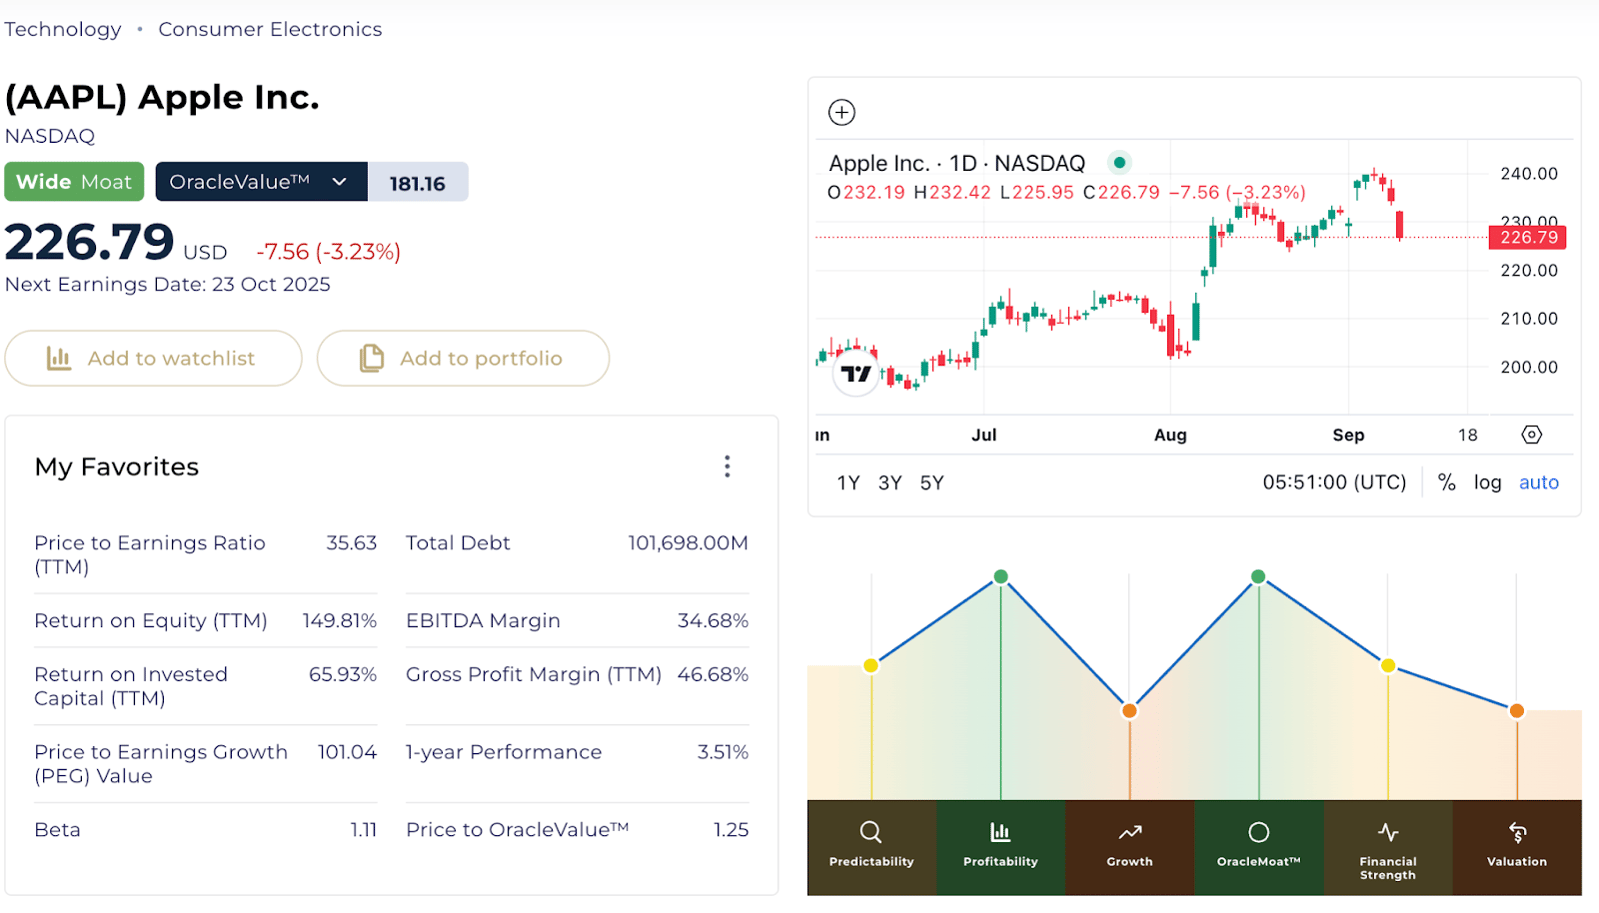
Apple (AAPL) Valuation Calculation on StockOracle™
StockOracle’s OracleValue™ places Apple’s intrinsic value around $181 per share, which suggests that at current market prices, Apple appears overvalued. However, the tool also enables investors to adjust assumptions (e.g., revenue growth, discount rates) to create their own customized valuation scenarios.

Intrinsic Value Calculation of Apple Inc. (AAPL) powered by StockOracle™ - 11th September 2025
Segment and Geographic Breakdown of Apple By StockOracle™
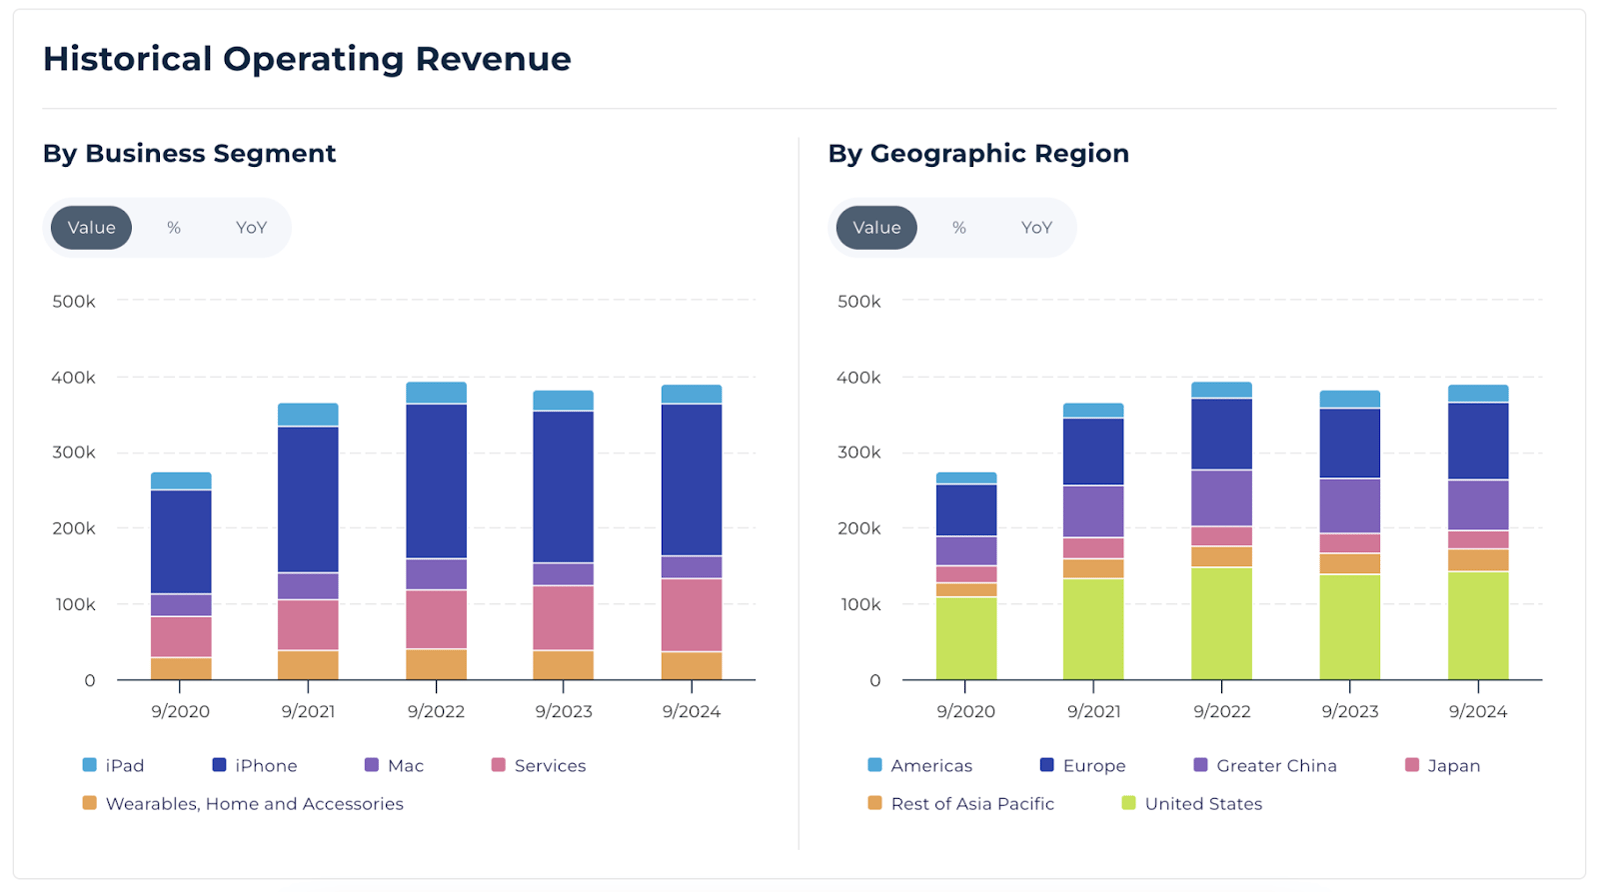
Business Segment and Geographic Breakdown of Apple Inc. (AAPL) powered by StockOracle™ - 11th September 2025
- iPhone: Still Apple’s anchor, contributing over 50% of total revenue.
- Mac & iPad: Each around 7–8% of sales.
- Services: Rising share, from ~19% in 2020 to 24.5% in 2024, with higher margins.
- Geography: US (36%), Europe (26%), Greater China (17%) — with China facing notable headwinds.
Final Thoughts
Understanding the core drivers of a business is critical when deciding where to invest. Even if you’re a loyal Apple customer, that doesn’t mean you have the full picture of the company.
As an investor, you need to look beyond the consumer experience and examine fundamentals like revenue breakdown, growth trends, and geographic sales. StockOracle™ makes this process simple by presenting these insights in a clear and digestible way.