By Piranha Profits Team
Last updated on September 18, 2026
A business that still earns a 22.8% return on invested capital, carries no interest-bearing debt, and converts 12 cents of every revenue dollar into free cash flow is not usually described as broken. But with this stock’s case, it might just.
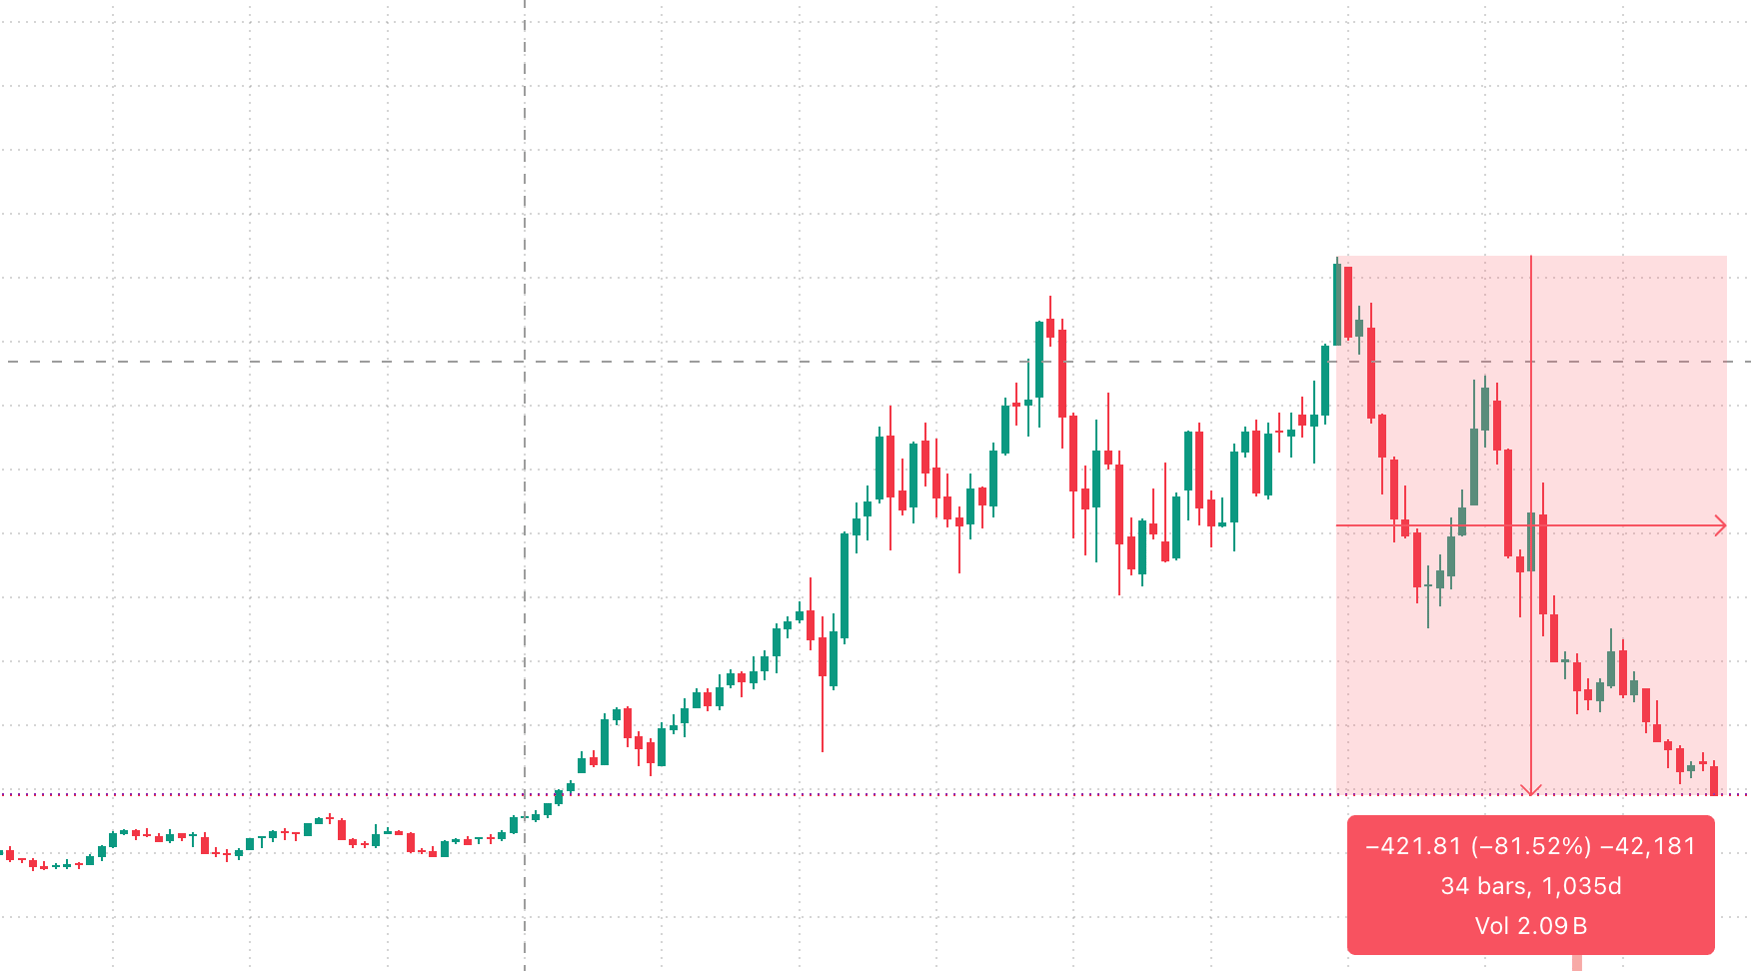
Lululemon has lost roughly 52% of its market value in 2026, trades near an eight-year low, and sits at the very bottom of its 52-week range. The stock changes hands at 8.1 times trailing earnings, against a ten-year average closer to 40.
Either the market has mispriced a durable brand, or the market has correctly worked out that the earnings those 8.1 times are multiplying are about to shrink. This piece walks through the data on both sides.
What Does Lululemon Actually Do?
Lululemon athletica inc. designs, distributes and retails technical athletic apparel, footwear and accessories. It was founded in 1998 by Chip Wilson and is headquartered in Vancouver, Canada.
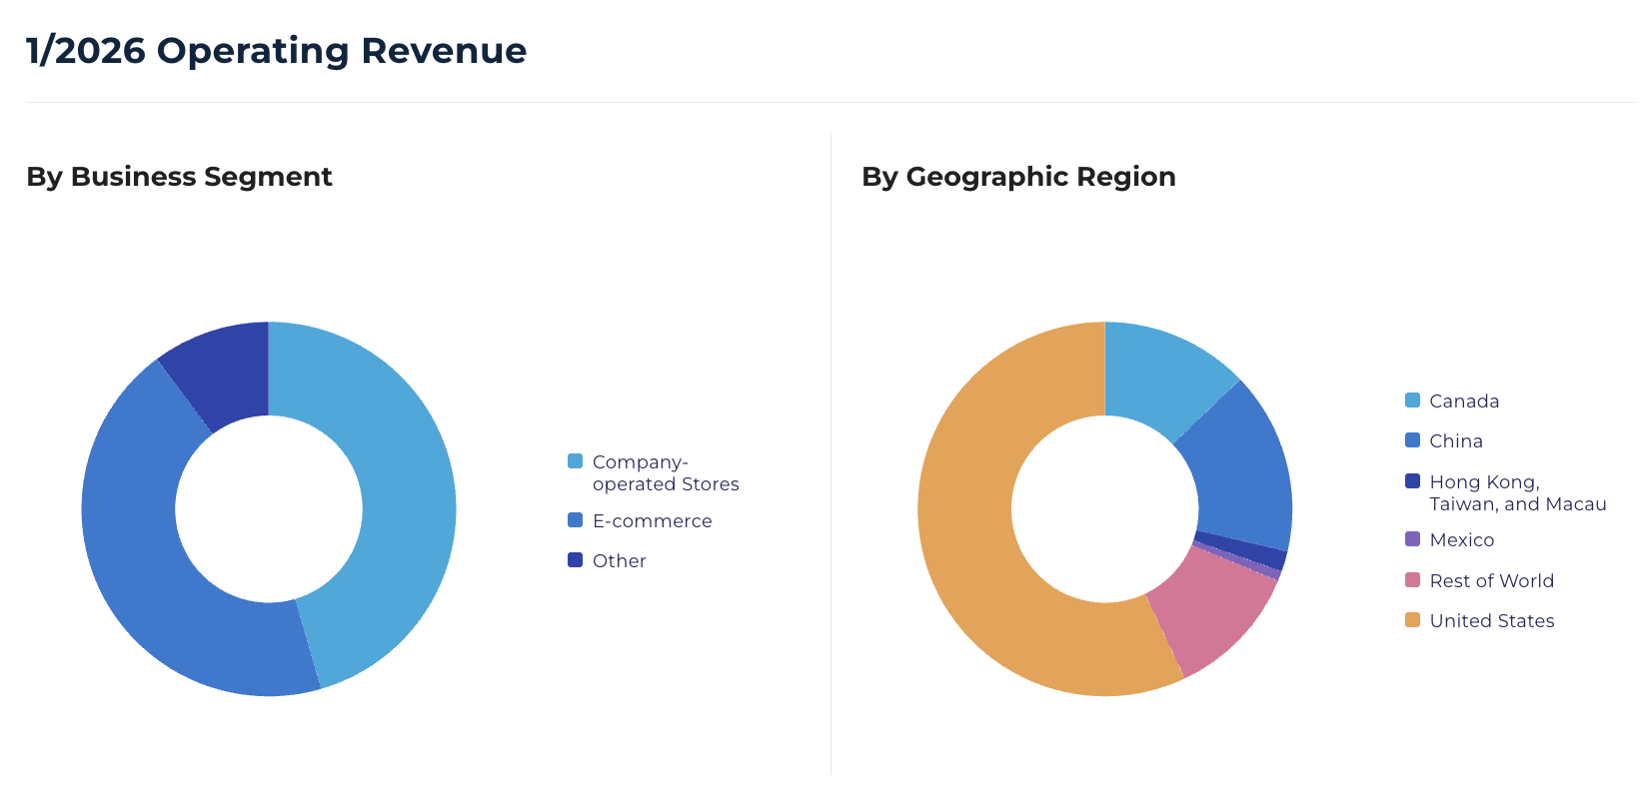
It reports through three segments: Company-Operated Stores, Direct to Consumer, and Other.
Strip away the yoga-studio mythology and the business model is straightforward: design premium apparel in-house, sell almost all of it yourself, and refuse to discount.
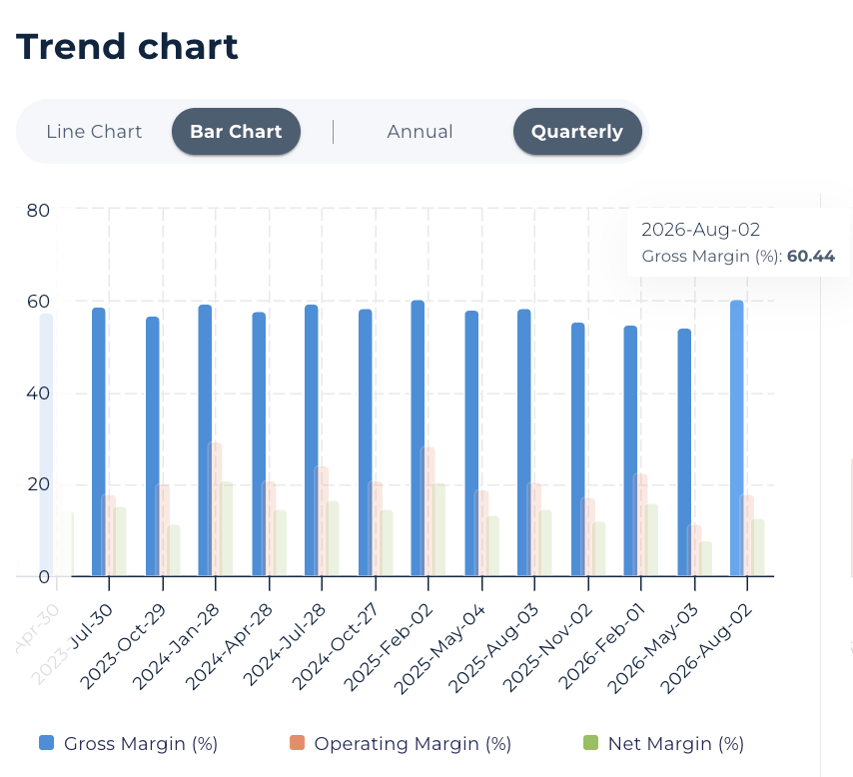
Most apparel retailers survive on wholesale volume and clearance cycles. Lululemon built a vertically integrated, near-full-price model, which is why its gross margin has averaged 55.8% over ten years, a level that is almost recognised as a luxury product.
Where the revenue comes from (Q2 FY2026, quarter ended 2 August 2026):
|
Region |
Revenue |
Share of total |
Reported revenue growth |
Comparable sales (constant $) |
|---|---|---|---|---|
|
Americas |
~$1.6B |
67% |
−8% |
−12% |
|
China Mainland |
$407.1M |
17% |
+4% |
−8% |
|
Rest of World |
$391.8M |
16% |
+5% |
−3% |
|
Total |
$2.415B |
100% |
−4% |
−10% |
The company ended the quarter with 825 company-operated stores and 3.88 million square feet of selling space. It pays no dividend, capital returns come entirely through buybacks.
When Did Lululemon Go Public?
Lululemon went public on Friday, 27 July 2007, listing on the Nasdaq under the ticker LULU with a concurrent TSX listing. The offering priced at US$18 a share across 18.2 million shares , an offering size of roughly US$327.6 million. The stock closed its first session at $28, up about 56%.
And only about 2.29 million of those 18.2 million shares were sold by the company. The rest came from existing shareholders, so Lululemon itself took home far less.
Worth holding in mind when reading anything about the current drawdown: this is a stock that compounded for the better part of two decades before the last three years happened.
Why Is Lululemon Stock Dropping?
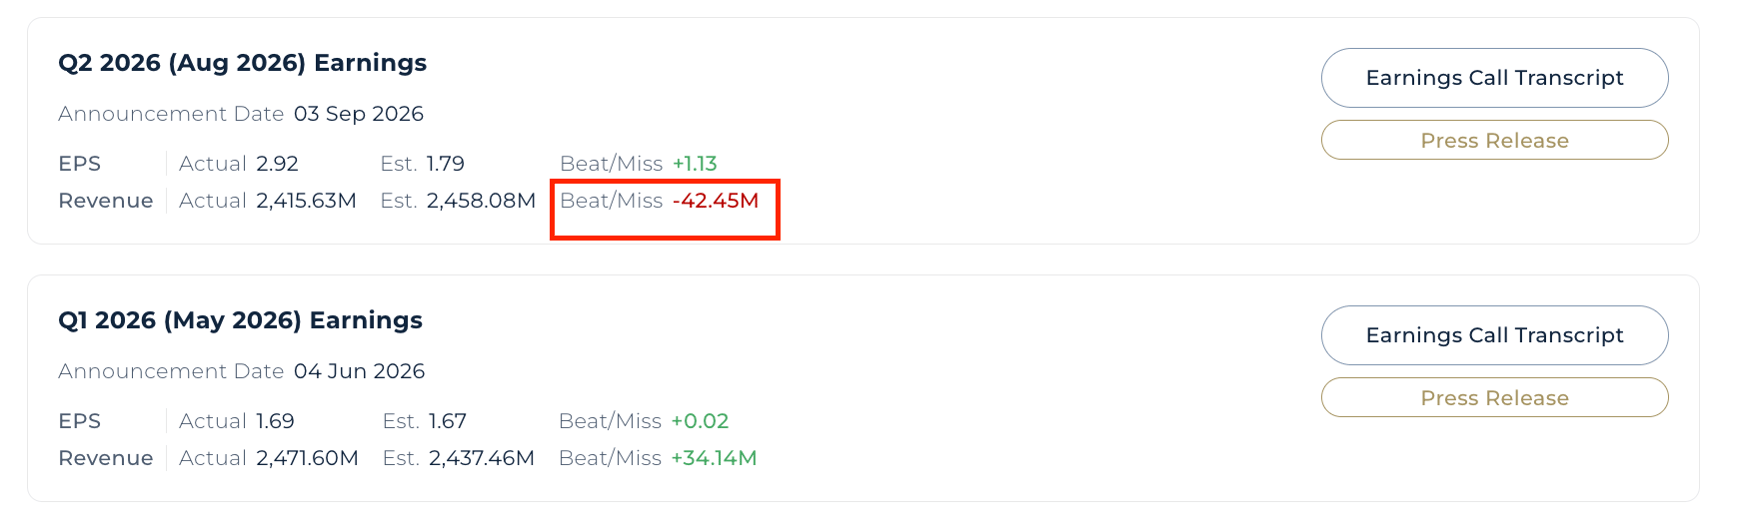
The short answer: revenue fell 4%, but guided earnings fell 27%. That is not a demand story alone. It is a demand story colliding with a cost base built for growth that stopped arriving.
Here is the sequence.
1. The Q2 report broke the "America is soft, international saves us" thesis
For two years, the bull case had a clean shape: North America was maturing, but China and international were compounding at 20–30%, so the mix should carry the company through.
Q2 FY2026 ended that argument.
Every region now has negative comparable sales.
China Mainland revenue still grew 4%, but comps fell 8% in constant currency. The growth came from opening stores, not from stores getting busier. Revenue growth from new square footage is bought. Revenue growth from comparable sales is earned.
When the second stops, the first becomes an expensive way to stand still.
2. The core product sold slower
Women's leggings, the category that built the brand declined about 20% in the quarter. Accessories fell 13%. Women's overall was down 4%; men's down 1%.
Management attributed it to a consumer shift toward looser, "away-from-body" silhouettes and away from the compression fits Lululemon is known for. CFO Meghan Frank was blunt that "the overall response to our product launches remains inconsistent."
Newer styles such as Define, Scuba in SuperLoft, Groove Wide-Leg, Align Foldover Jogger were described as trending well. The problem is arithmetic: those are not yet large enough to offset a 20% decline in the anchor category.
3. China stumbled on a self-inflicted wound
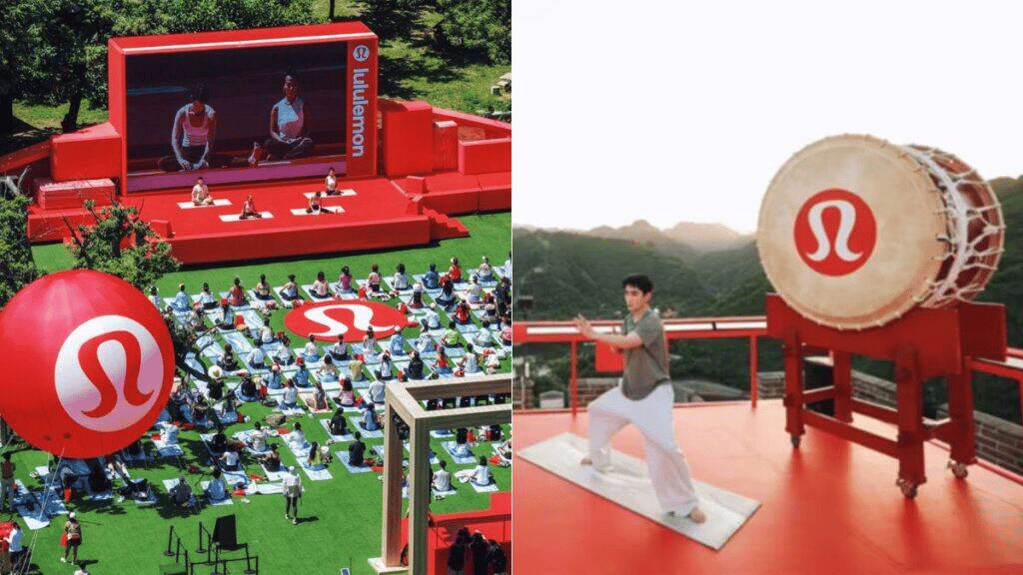
When photos circulated on Weibo, the backlash ran to tens of millions of views, and the company. Its brand ambassador and the drum troupe then issued public apologies.
China Mainland revenue had grown 30% year-on-year in Q1 (+23% in constant currency). In Q2 that fell to +4% reported, −2% in constant currency and underneath it, comparable sales were −2% reported and −8% in constant currency.
Management cited in their earnings transcript "spikes of negative commentary in the media and on social channels."
4. Tariffs flattered the quarter and disguised the damage
Reported gross margin was 60.5%. That looks excellent until you see why: the quarter included a $134.5 million IEEPA tariff refund that added roughly 560 basis points to gross margin. Together with $4.1 million of associated interest, the refund contributed $0.86 to diluted EPS, net of tax. Remove it and the gross margin was down about 360 basis points. Reported EPS of $2.92 contained $0.86 of one-off benefit.
Management also disclosed it has paid roughly $230 million in tariffs, with about $105 million still uncertain in the refund process.
5. The guidance cut was the real event
|
Metric |
Original (17 Mar 2026) |
Before the cut (4 Jun 2026) |
Revised (3 Sep 2026) |
|---|---|---|---|
|
Revenue |
+2% to +4% growth |
$11.00B–$11.15B |
$10.35B–$10.50B (−5% to −7%) |
|
Diluted EPS |
$12.10–$12.30 |
$10.95–$11.15 |
$9.48–$9.73 |
Note the middle column. September was the second cut of the year. Guidance had already come down in June, and then lost roughly another 13% off the EPS range. For Q3, the company guided revenue down 10–11%, EPS of $0.93–$0.98.
When companies report negative guidance, investors tend to lose confidence in management and in the future.
6. Governance noise on top of operating noise
- 18 December 2025 — Elliott Management's stake, reported at over $1 billion, becomes public.
- Late December 2025 — Founder Chip Wilson nominates three board candidates, opening a proxy fight.
- 27 May 2026 — Settlement with Wilson: Laura Gentile (ex-ESPN CMO) and Marc Maurer (ex-On co-CEO) join the board; a third apparel specialist expected by October 2026. Wilson accepts an ~18-month standstill.
- 9 September 2026 — BMO Capital Markets initiates coverage at Underperform with a $70 price target, citing demand in the Americas and China and pressure on premium margins.
Markets dislike simultaneous leadership change and guidance reset. Lululemon delivered both inside a week, after roughly seven months without a permanent chief executive.
Reading the Business Through StockOracle™
This is where the picture gets more interesting than the headlines allow.
Lululemon (LULU) OracleIQ™: strong bones, no growth
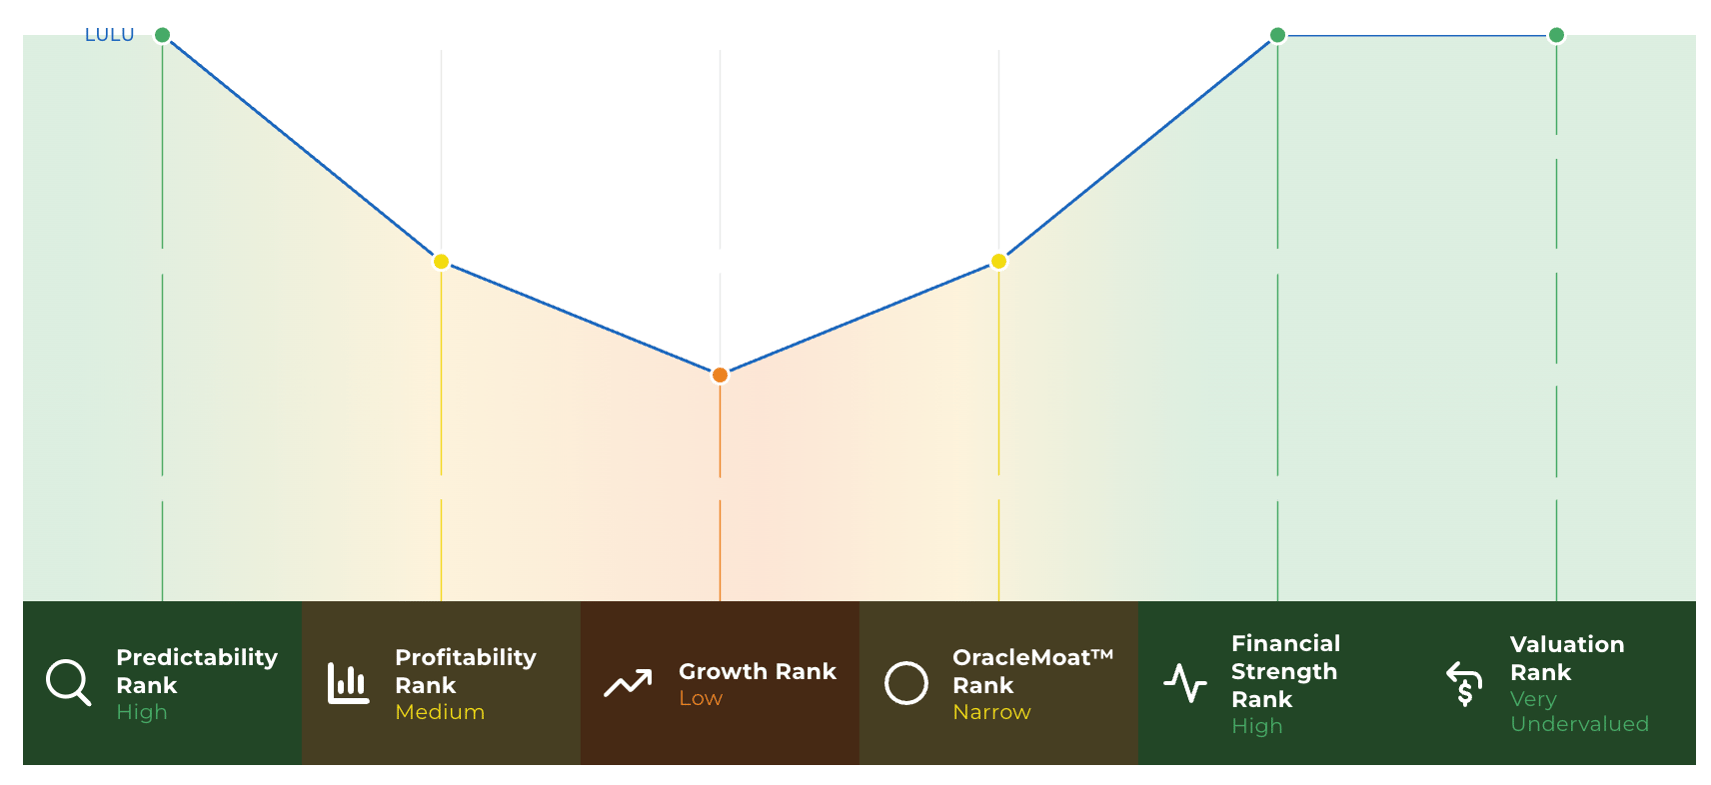
OracleIQ™’s High predictability and High financial strength sitting next to Low growth, describes a specific kind of company. Perhaps not a distressed one but a stalled one.

Distressed businesses have balance sheet problems. Stalled businesses have demand problems. And they require completely different things to go right. This is what most investors might call a turnaround story.
Profitability: dented but not completely destroyed
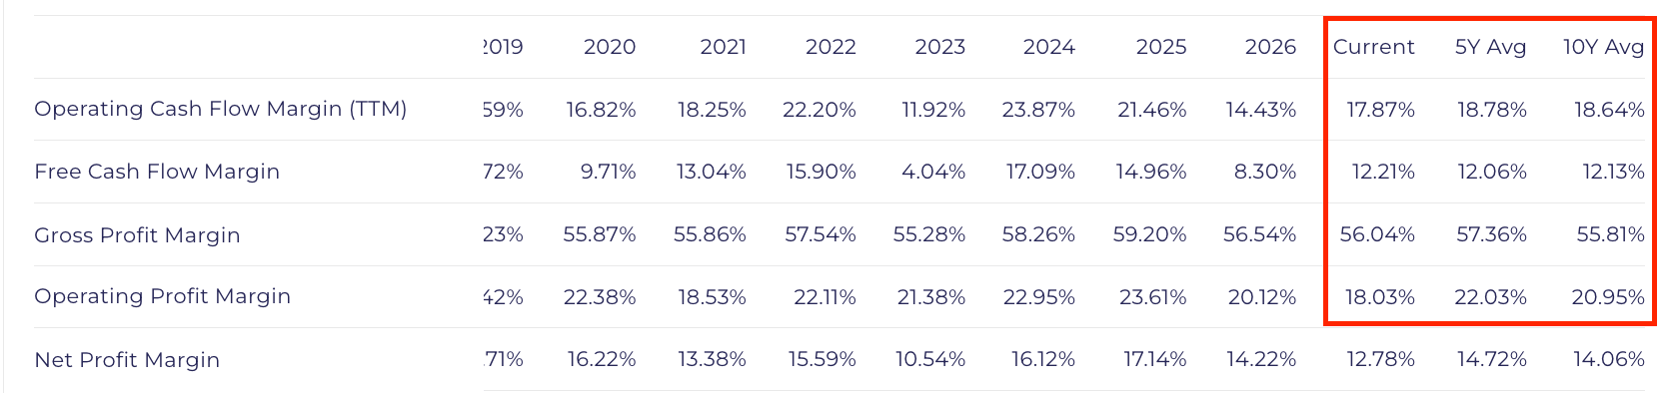
Look closely at the gross margin line. After a 20% decline in the core category, a China setback and a tariff regime, gross margin is still sitting slightly above its own ten-year average.
That is meaningful data. It says the damage so far could be a volume problem, not a pricing problem. Customers who are still buying are still paying close to full price. A brand that had genuinely lost its pricing power would show the opposite pattern.
The erosion is further down the P&L, in operating margin, where fixed costs live.
Capital efficiency: still above the cost of capital
StockOracle™ puts Lululemon's weighted average cost of capital at 10.16%, against a return on invested capital of 22.84%.
A business earns its right to reinvest when returns exceed the cost of the money funding them. That spread of roughly 12.7 percentage points is narrower than the ten-year norm but it is still firmly positive. Every dollar the company deploys is still, on current numbers, worth more than a dollar.
The inventory line hardly anyone is discussing
Inventory and working capital metrics — Powered by StockOracle™
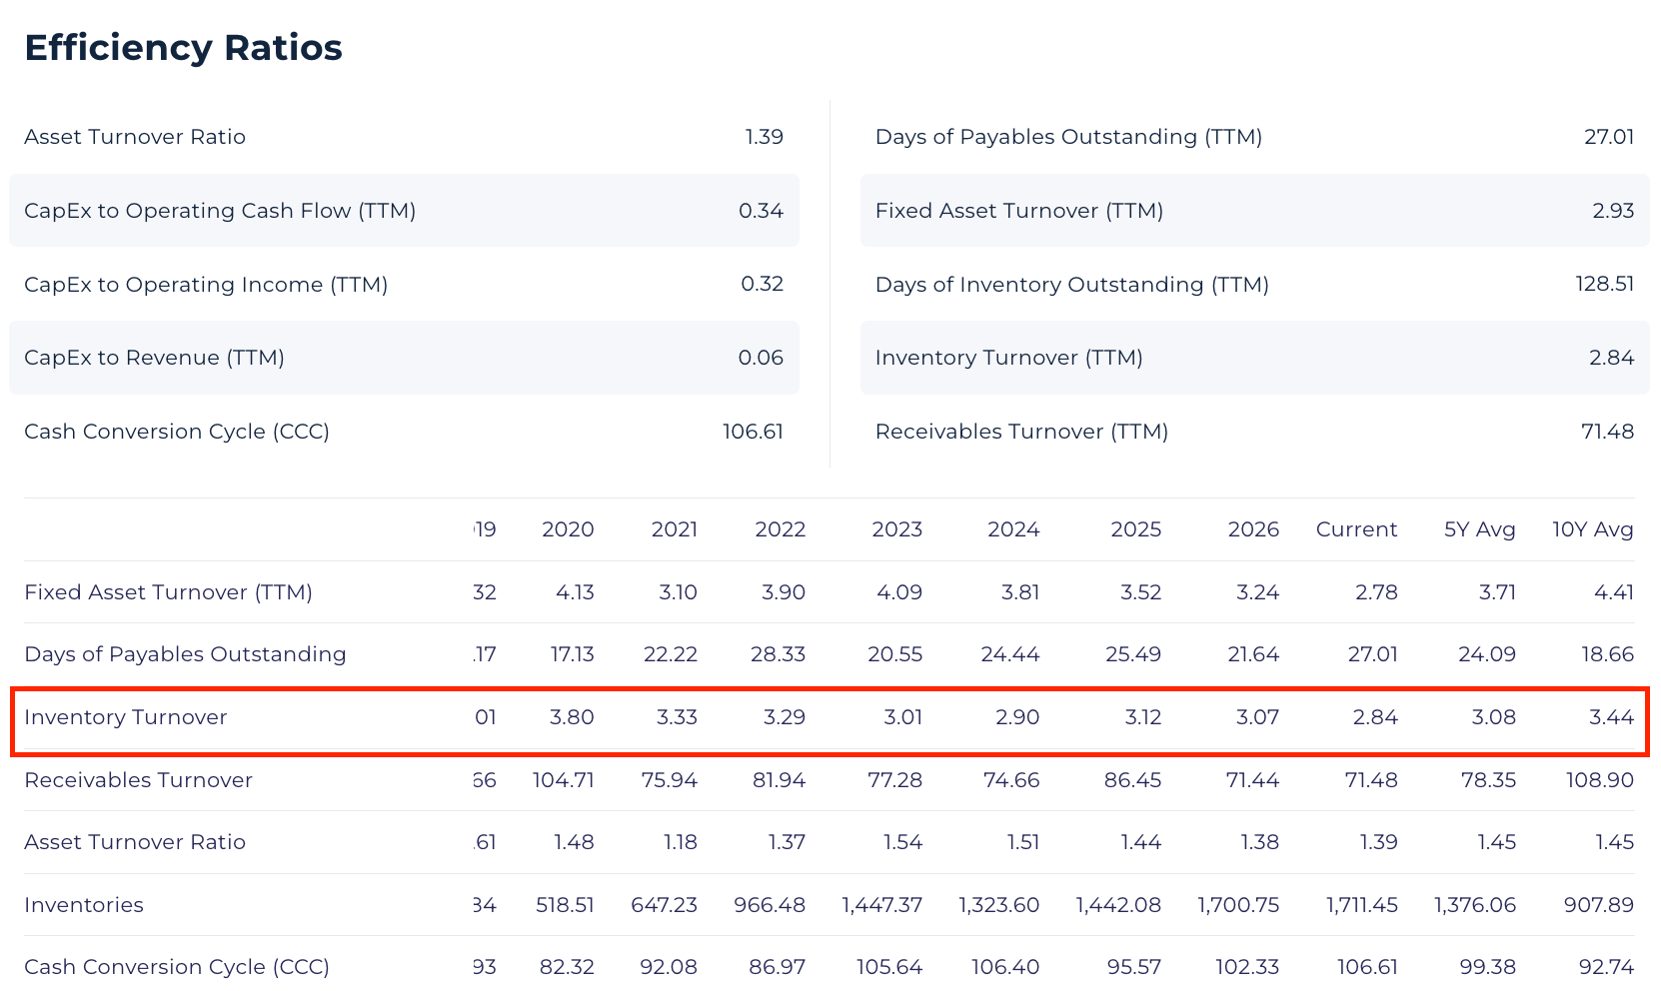
Inventory turnover is at its lowest point in the decade of data available. LULU’s product now sits for roughly 128 days before it sells.
Think of inventory turns as the pulse rate of a retailer. A slowing pulse doesn't kill you today, it tells you the system is working harder for the same output. Slow-moving apparel eventually clears, and it usually clears at a discount.
Management's counter is credible: ending inventory was down 7% in units year-on-year, with dollars down 1%, and they increased "chase" volume by about 20% to reorder faster into what is working.
Still, this is the line to watch in the next earnings report. If turns keep falling, the markdown pressure currently guided at 60 basis points for Q3 is likely understated.
Financial strength: genuinely rare
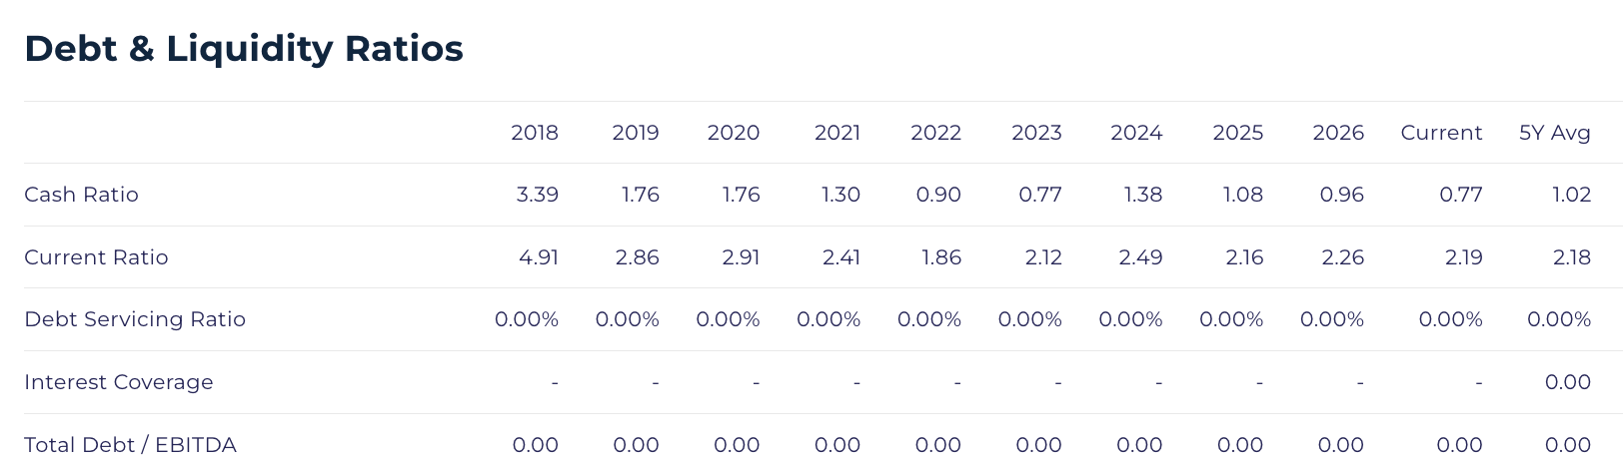
Lululemon carries no interest-bearing debt. No borrowings drawn on its $600 million revolving facility. The liabilities that show up as "debt" in most screeners are operating lease obligations on its store fleet, which are real commitments but carry no refinancing cliff.
A stalled retailer with leverage is a restructuring story on a clock. A stalled retailer with net cash and roughly $1.35 billion of trailing free cash flow has time to be wrong and time is the scarcest asset in any turnaround story we see.
What Is Lululemon's Intrinsic Value?
Intrinsic value is what a business is worth based on the cash it can generate over its remaining life, discounted back to today. It is an estimate, not a fact — and it moves with the assumptions you feed it.
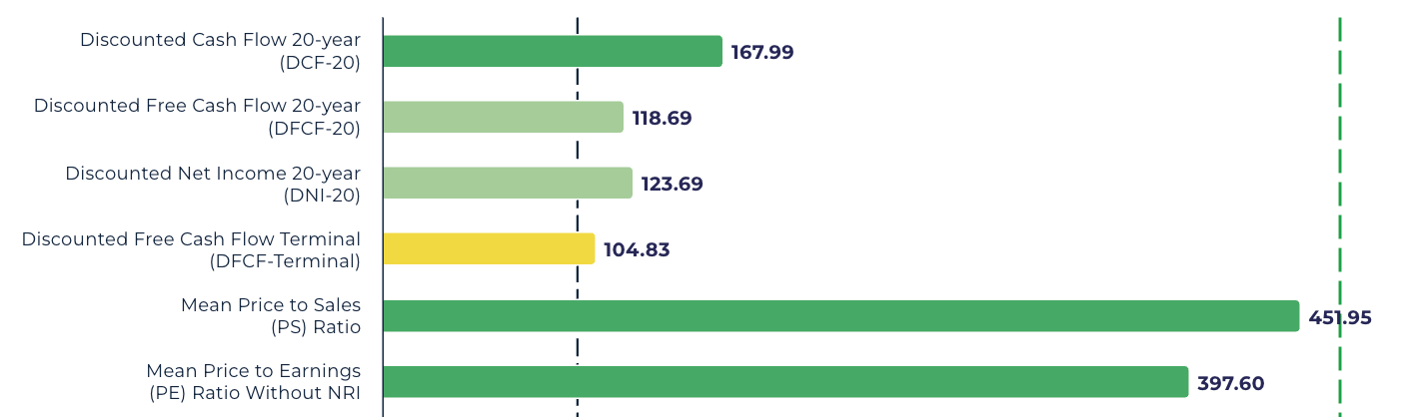
Valuation chart — Powered by StockOracle™
The cash-flow methods cluster between $118 and $167.99. The multiple-based methods cluster between $397 and $451.95.
The model is telling you exactly what the market is arguing about.
What the Bulls and Bears Are Both Missing
Most coverage of LULU right now sorts into two corners. One, it's down 52% and trades at 8x earnings, this is obviously cheap. Second, the brand is broken, avoid at all costs.
Point 1 — The "cheap" case is mostly a bet on multiple reversion, not on cash flow
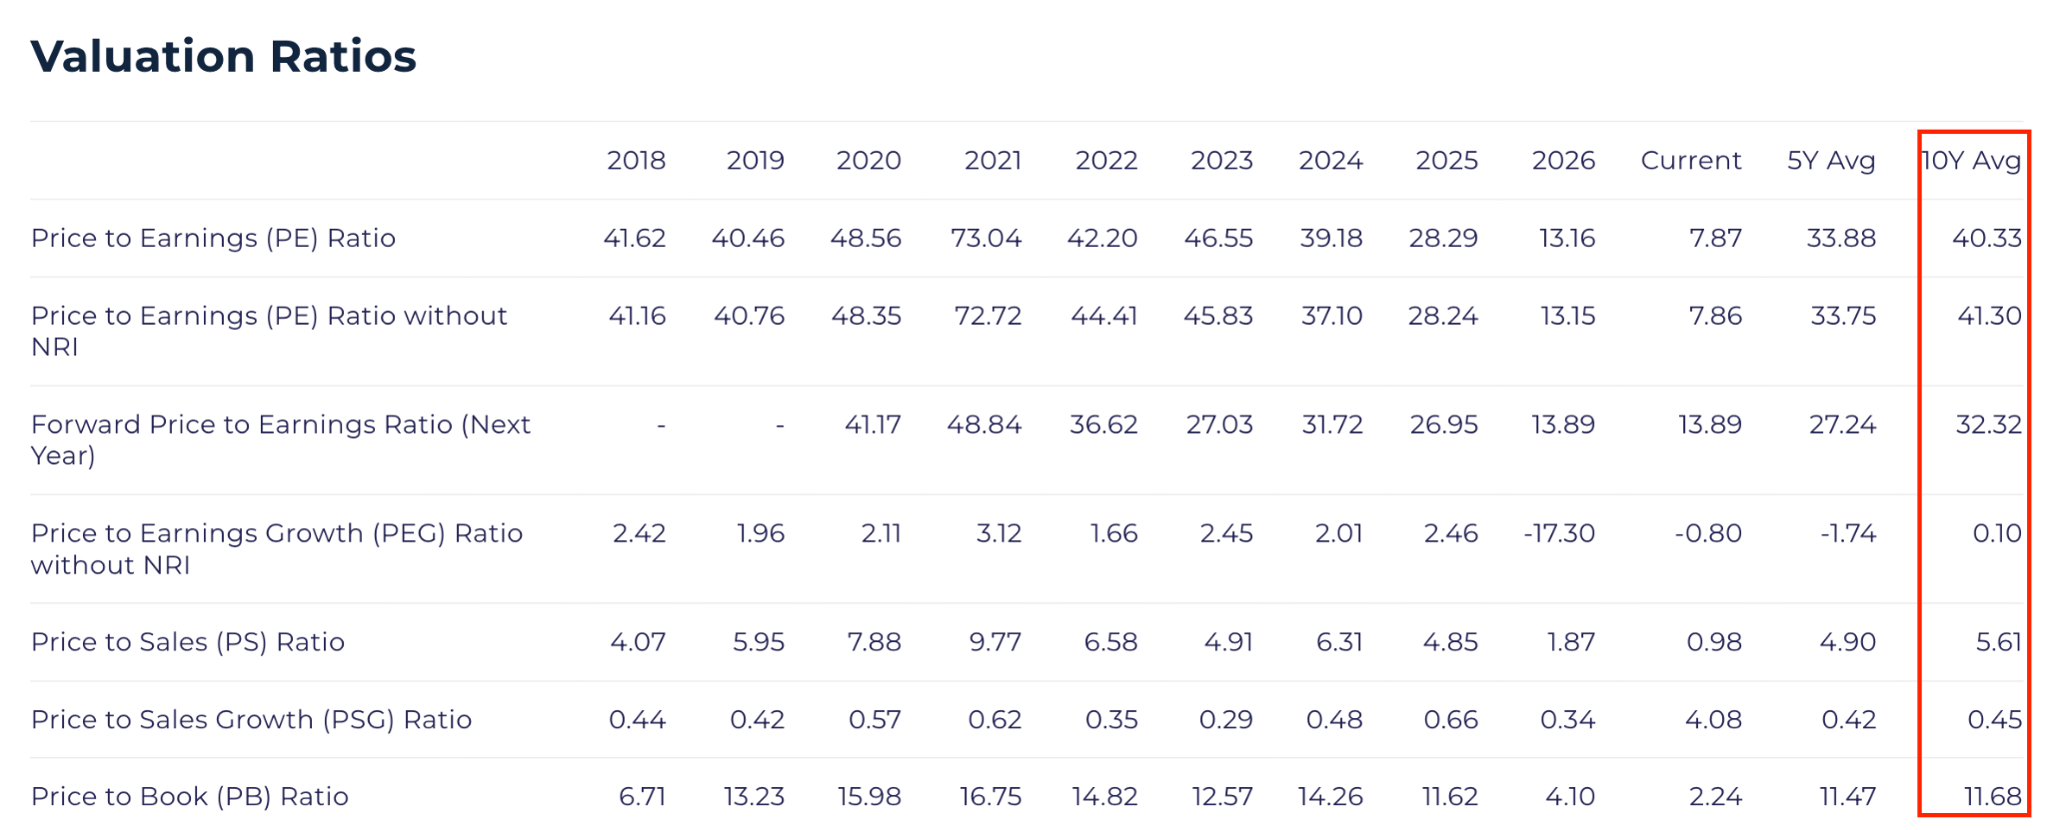
Every multiple-based method in that table works the same way: take the company's historical average multiple and apply it to current fundamentals. Lululemon's ten-year average P/E is 40.33. Its ten-year average P/S is 5.61.
Apply those to today's earnings and sales and you get $400–$529. But that answer contains an assumption: that the market will one day be willing to pay 40 times earnings for this business again.
The cash-flow methods make no such assumption. They ask only what the cash is worth. They answer $151–$245.
So when someone says "LULU is deeply undervalued," the honest follow-up question is: undervalued against which method, and what does that method assume about the future multiple?
An investor who believes the premium-growth multiple returns is looking at a very different opportunity from an investor who believes only in the cash flow. Both are visible in the same StockOracle™ screen. They are just not the same thesis and deserve to be challenged in their own way.
Point 2 — The bear case could also be mispriced, in the opposite direction
The prevailing bear narrative is brand collapse. The margin data may not support that just yet.
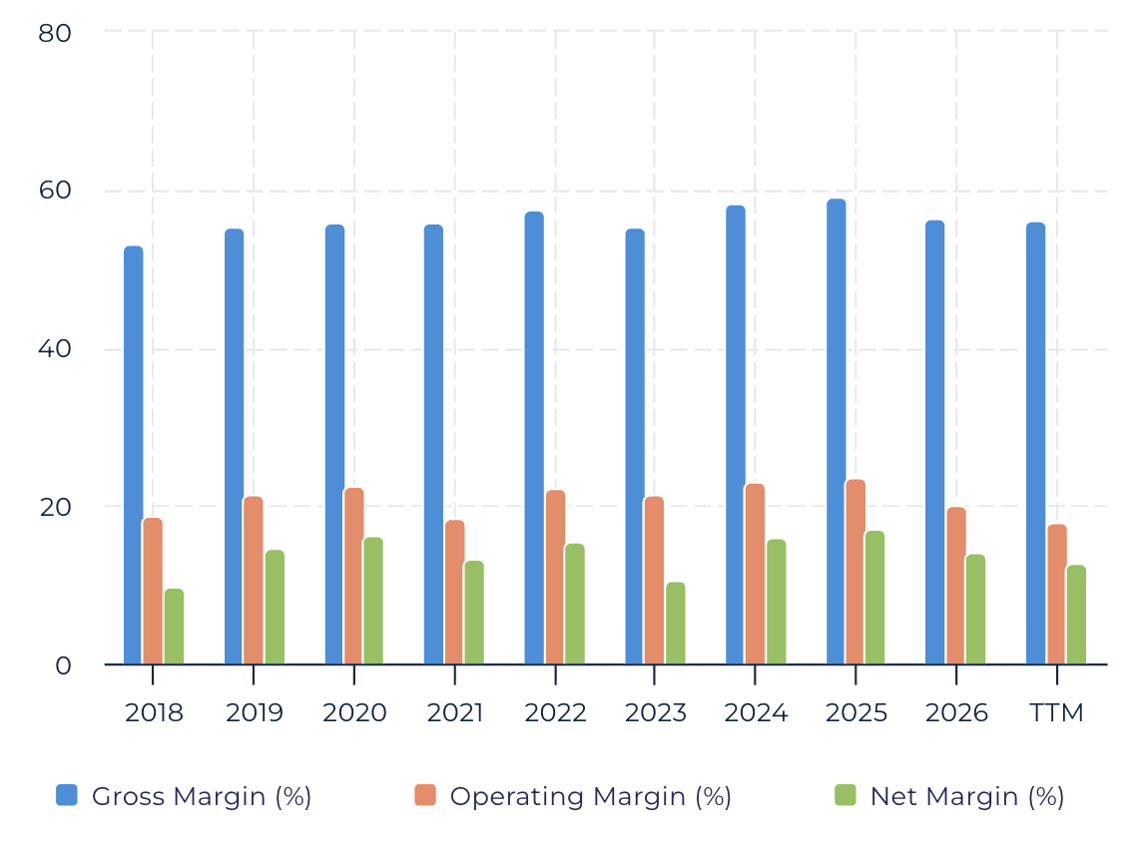
If Lululemon had lost pricing power, gross margin would be falling hard as the company bought volume with discounts. Instead gross margin is still above its ten-year average, markdowns rose only 70 basis points, and management noted the Americas problem is traffic, not conversion.
Simply, fewer people are walking in, but the ones who do still buy at full price.
Point 3 — The valuation multiple is cheap on earnings that are still falling
Here is the biggest part of the "8x earnings!" framing skips.
That 8.11x is calculated on trailing twelve-month EPS of $12.20. Company guidance for the full year is $9.48–$9.73.
So the multiple is not 8x. On the company's own guidance it is closer to 10x, and the denominator is still moving down. The PEG ratio reads -0.8. Negative, because earnings growth is negative. A cheap multiple on a shrinking earnings base is the exact signature of a value trap.
The two are indistinguishable in real time, and only comparable sales will separate them.
Point 4 — The buyback is a case study in both directions
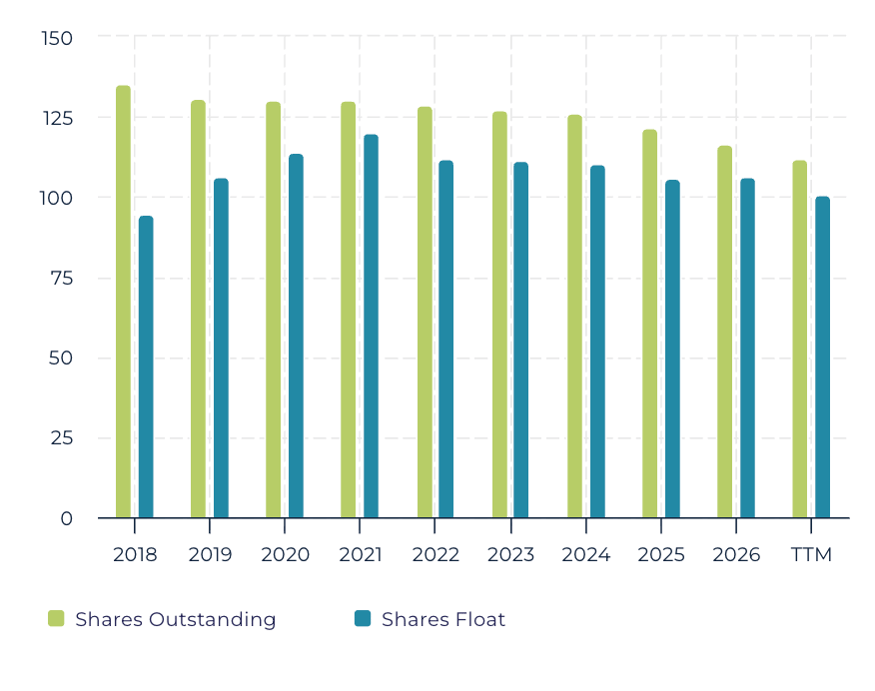
In Q3 of the prior fiscal year, Lululemon repurchased 1.0 million shares for $189.0 million — an average of roughly $189 per share. In Q2 FY2026 it bought 2.7 million shares for $330 million, around $122 per share.
Against today's $98.97, both look expensive. Capital was returned aggressively into a de-rating, and shareholders bore that cost. Share count has fallen from roughly 127 million (fiscal year ended January 2024) to 112.92 million today.
With a free cash flow yield above 12% and no debt to service, every dollar of buyback now retires materially more ownership than it did eighteen months ago. Each remaining share owns a slightly larger piece of the company, and at a much better price than management was paying a year ago.
The Competitive Picture: Why the Moat Is Narrow, Not Wide
OracleMoat™ scores Lululemon as Narrow, and the competitive geometry explains why.
Alo Yoga has captured the studio-adjacent, celebrity-driven aesthetic and converted it into a cultural position Lululemon once owned outright. Although retail research has found 63% of Alo shoppers also shop at Lululemon.
Vuori has taken the men's and lifestyle end with a softer, less technical fabric story, and has grown its share of shoppers' activewear wallet materially.
Nike carries distribution reach and athlete endorsement budgets an order of magnitude larger.
On and Hoka are pulling the performance-footwear dollars Lululemon hoped its 2022 footwear entry would win.
What Lululemon still owns is real: vertically integrated design, near-full-price selling discipline, a store fleet with high productivity per square foot, and a technical fabric library built over two decades.
Final Thoughts
The bull and bear cases on Lululemon are not arguing about the same question, and that is why the debate is so loud.
The bears are right about the present: revenue is shrinking, the core category is in decline, every region has negative comps, and earnings guidance has been cut twice in six months.
The bulls are right about the structure: no interest-bearing debt, 22.8% ROIC against a 10.2% cost of capital, gross margin above its decade average, and a free cash flow yield north of 12%.
Both can be true. A high-quality business can go through a multi-year demand reset, and the market can be wrong about how long it lasts — in either direction.
The current position is that Lululemon's valuation range is unusually wide right now because the market cannot agree on which multiple regime this business belongs to. Cash-flow methods say one thing. Multiple-reversion methods say something three times larger. Neither is the truth; both are conditional forecasts.
This article is for educational purposes only and does not constitute financial advice or a recommendation to buy or sell any security. All valuations are estimates based on assumptions that may not hold. Past performance is historical and is not indicative of future results. Investing carries the risk of loss.