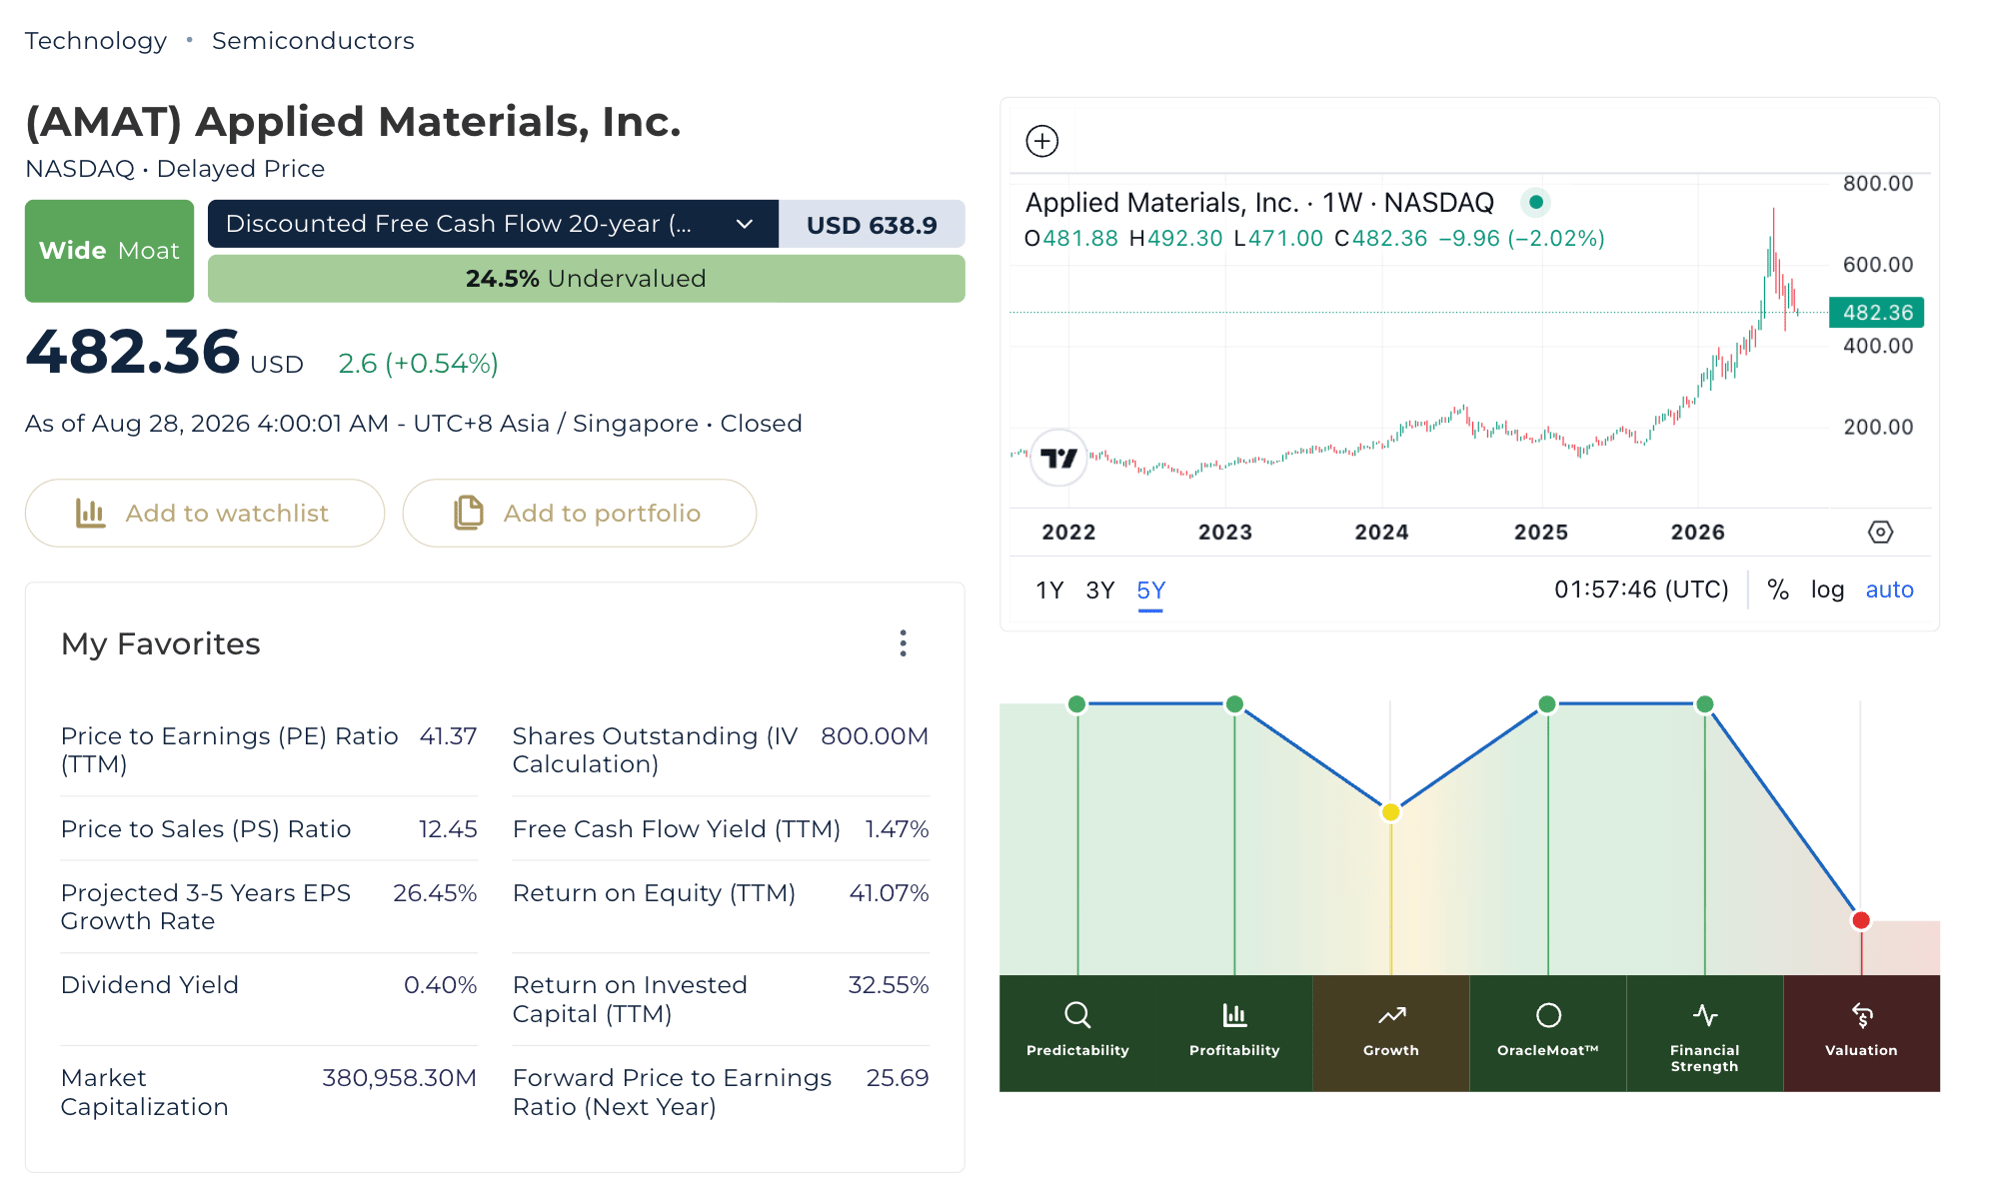
Applied Materials hit an all-time high near $740 in June 2026, then gave back roughly a quarter of its value into August. That came even though the latest quarter delivered record operating cash flow and a 13th straight quarter of margin expansion.
This article asks how much of the AI-driven chip equipment supercycle the market has already paid for, and how much depends on growth assumptions holding for a decade.
What Does Applied Materials Actually Do?
Applied Materials doesn't design or manufacture chips. It builds wafer fabrication equipment, primarily deposition, etch, and inspection systems, through its Semiconductor Systems and Applied Global Services segments.
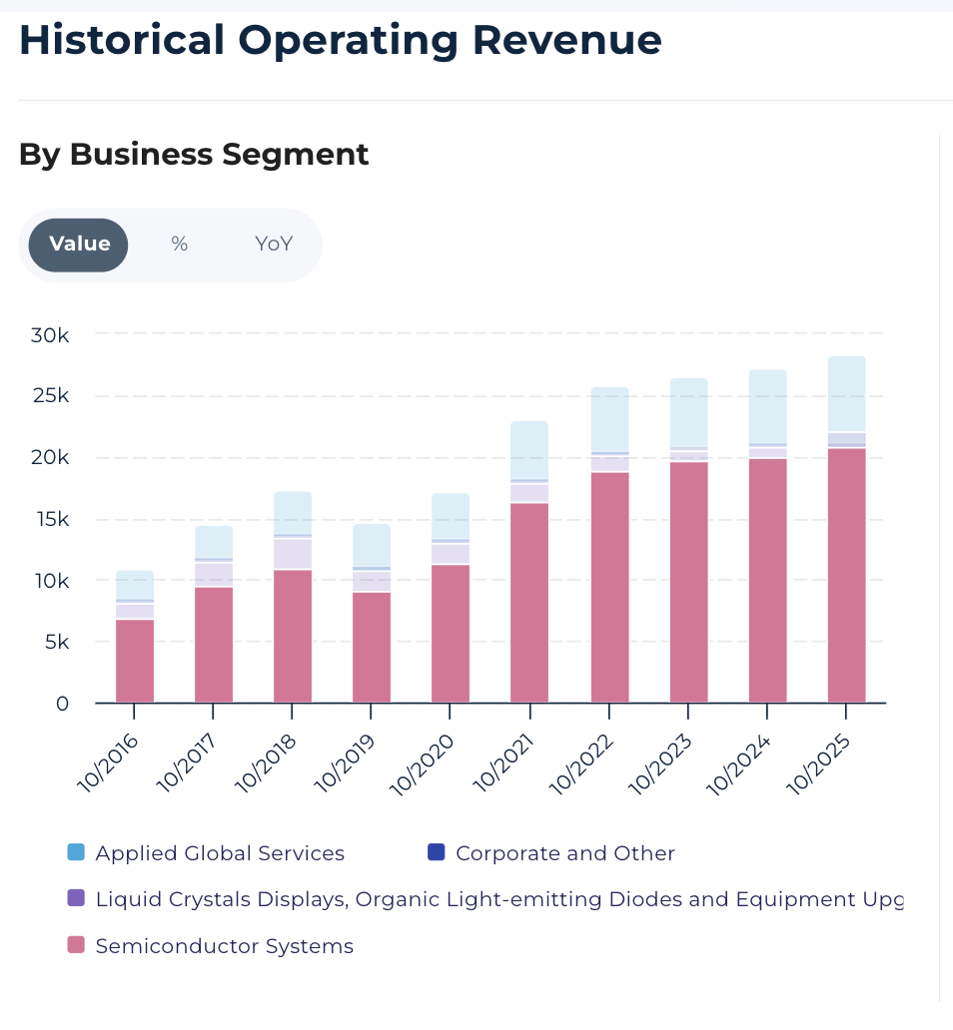
Chipmakers like TSMC, Samsung, Micron, and Intel use these tools to build integrated circuits. That makes Applied Materials a picks-and-shovels supplier to the semiconductor industry, not a bet on any single chip designer. That's why the current AI buildout shows up in its numbers as equipment orders, and not chip sales.
What Is Applied Materials's Intrinsic Value?
Intrinsic value estimates what a business is actually worth, based on the cash it can realistically generate over time, not whatever the market pays during a sector-wide AI rally. For a cyclical, capital-equipment business like Applied Materials, that tells us that: near-term growth rates can look extraordinary in either direction once the spending cycle rotates.
Applied Materials's Fair Value: The Growth Case Versus the History Case
Run Applied Materials's numbers through a 20-year discounted cash flow model using a 26.45% near-term growth assumption, and fair value lands at $952.31 per share. The discounted free cash flow variant reads lower but still elevated, at $638.90. All are betting that the current AI-driven demand cycle keeps compounding near its present pace for a decade or more.
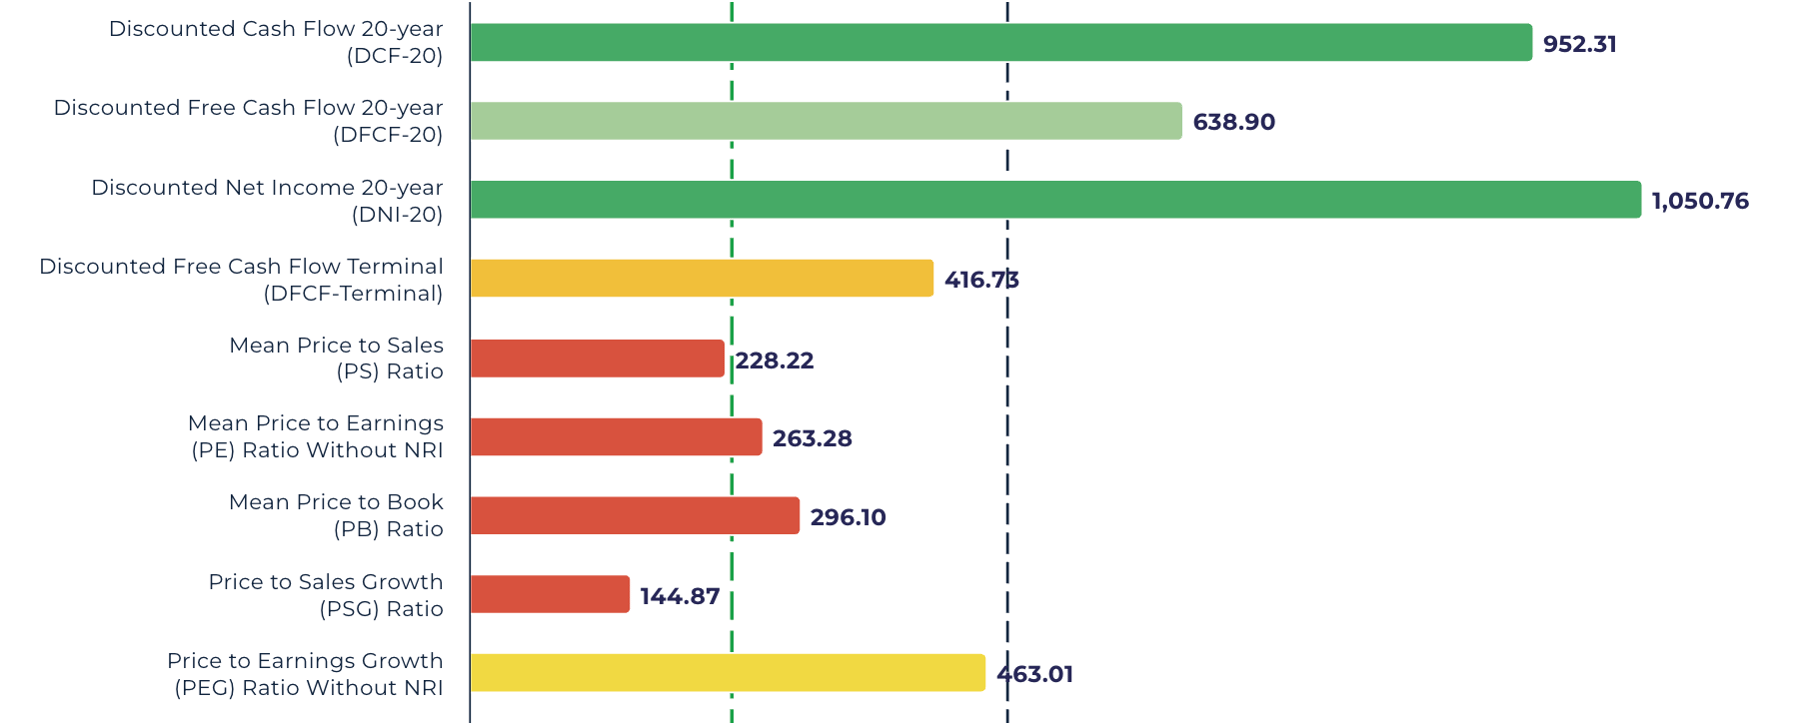
Applied Materials (AMAT) Valuation Chart — Model Breakdown — Powered by StockOracle™ · Accurate as of 22 August 2026
History-anchored methods tell a different story. Mean Price-to-Book reads $295.45, Mean Price-to-Earnings $262.58, and Mean Price-to-Sales $227.06, all well below today's price.
The gap between the two groups comes down to a bet on cyclicality: growth-trusting methods assume the current AI-driven pace is closer to a new normal, while history-anchored methods assume the cycle eventually reverts toward its long-run average.
To have a sense on how aggressive the growth assumption is: analyst estimates Year 1-5 rate of 26.45% implies the cash flow base doubling roughly every 3 years, or growing about 3.2 times over five years.
That implies a doubling time of roughly 2.2 years and a further 4.8 times growth over the second five-year stretch.
Combined, the model assumes Applied Materials's underlying cash flow grows roughly 15 times over the first decade alone. That could be an unusually steep assumption for a 20-year model.
Applied Materials (AMAT) Financial Performance
Revenue and Margins: A Genuine Record, Driven by AI Capex
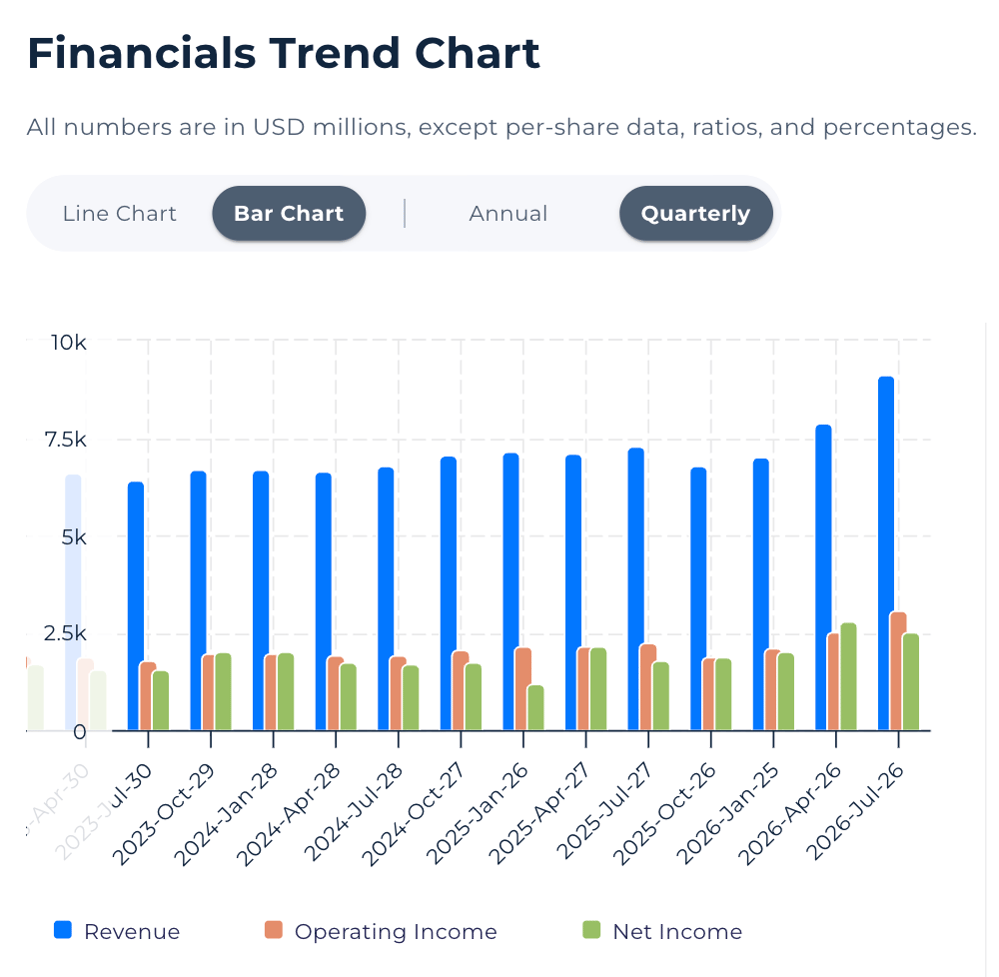
Applied Materials (AMAT) Revenue, Operating Income and Net Income Trend — Powered by StockOracle™
The quarter ended July 26, 2026 was a genuine record: revenue reached $9.115 billion, up 25% year-over-year, with GAAP gross margin of 50.3%, the 13th consecutive quarter of year-over-year gross margin expansion.
Profitability matched the top line: GAAP earnings per share came in at $3.17, up 43%, and Applied Materials's third-quarter fiscal 2026 earnings release shows record operating cash flow of $3.04 billion. CEO Gary Dickerson said the company is "further raising our Semiconductor Systems revenue expectations for calendar 2026."
Management's guidance points to acceleration, not a plateau: the fourth quarter is guided to revenue of $10.25 billion, plus or minus $500 million, and non-GAAP EPS of $4.02, plus or minus $0.20, both above the record third quarter.
Free Cash Flow: Real, But Thin Relative to the Stock's Price
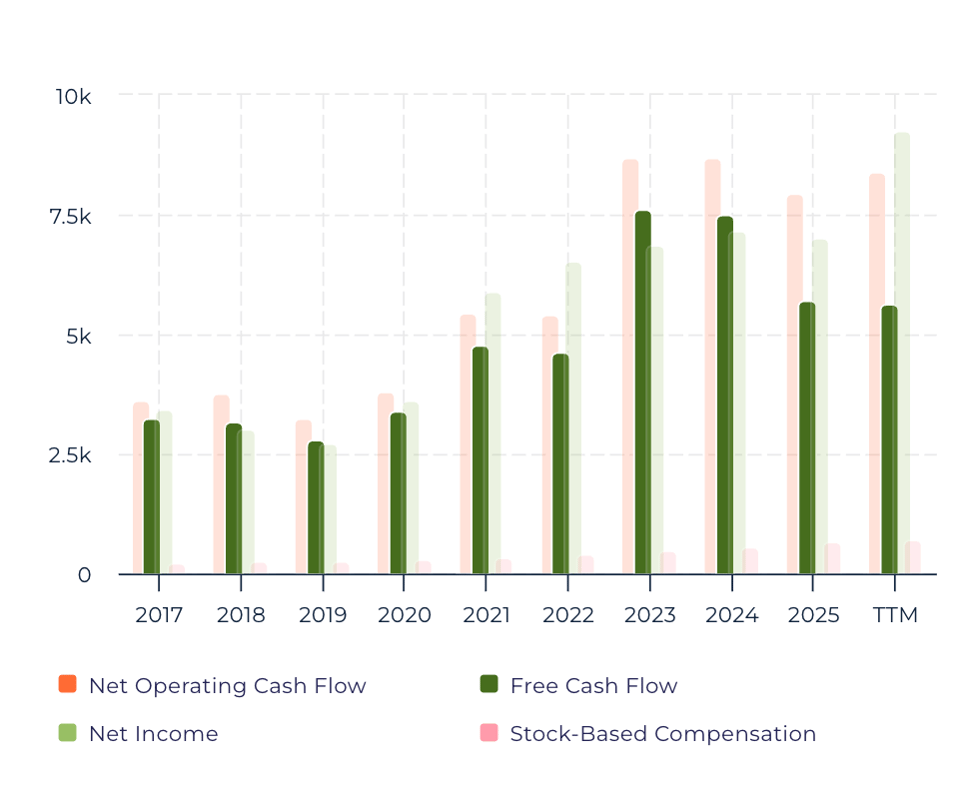
Free cash flow reached $5.62 billion on a trailing basis, an 18.23% margin on revenue. And because the market has bid the share price up faster than cash flow has grown, the gap explains why the multiples-based valuation methods above sit so far below the growth-trusting ones.
Returns on Capital: Best-in-Class, Even by Semiconductor Standards
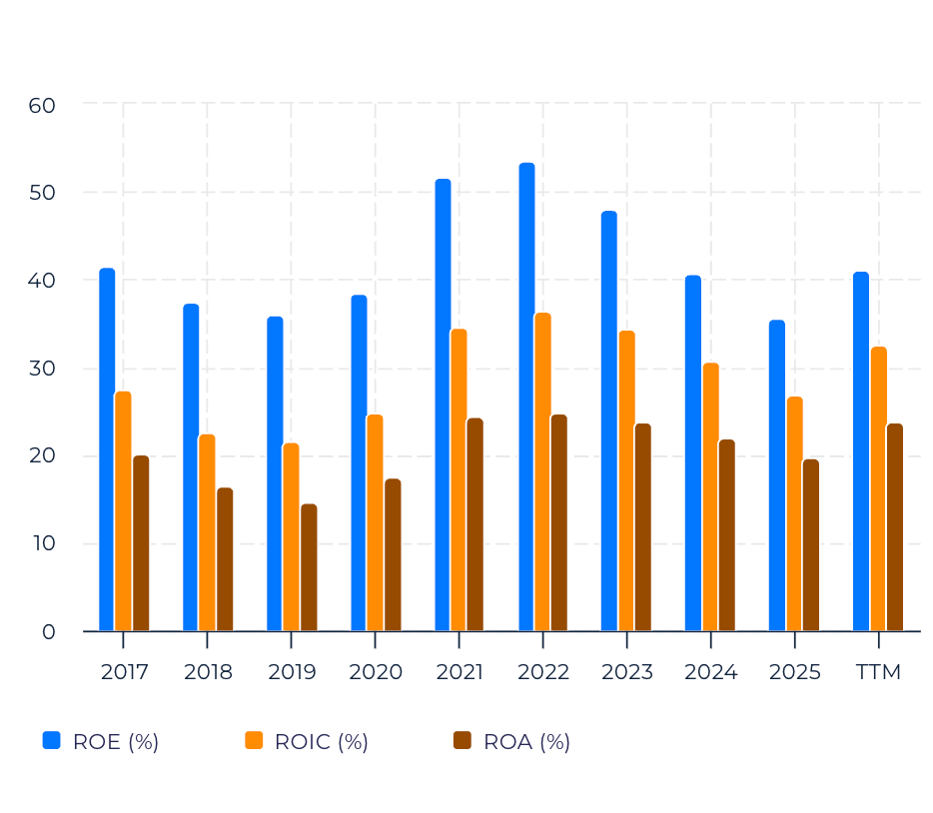
Applied Materials (AMAT) Margins and Returns Trend — Powered by StockOracle™
Return on equity (TTM) reads 41.07%, up from a five-year average of 35.51%; return on invested capital sits at 32.55%, above its own five-year average of 26.92%.
Both figures are extraordinary, even for high-margin tech businesses, and that capital efficiency is real evidence behind the stock's premium valuation, though it doesn't resolve whether today's price already reflects it.

Shareholder Returns
Applied Materials pays a modest dividend yield of 0.39% against a low payout ratio of roughly 17%, leaving most free cash flow available for reinvestment and buybacks. The company's ten-year share buyback ratio of 26.59% shows a long-running pattern of returning capital through repurchases, funded by its own cash generation.
Growth Catalysts
The AI and Advanced Packaging Buildout
- Third-quarter results included new systems launched for DRAM, advanced packaging, and HBM applications, tied to AI accelerator production.
- Applied Materials's stock outperformed most semiconductor equipment peers through mid-August 2026, ahead of Lam Research and KLA Corp over the same stretch, evidence the whole sector is being re-rated on the AI capex thesis, not Applied Materials alone.
- Management confirmed a $500 million expansion of its Singapore Tampines campus and reported 11 active EPIC Center collaboration engagements with customers, both signs of committed, multi-year capacity investment on its own side of the business.
- U.S. export controls on China are projected to cut fiscal 2026 revenue by roughly $600 million, with China's revenue share falling from around 40% to the mid-20% range. A since-suspended "affiliate rule" briefly withheld further shipments before U.S.-China talks eased the restriction.
Why it matters for valuation: these catalysts are the evidence behind the platform's growth assumptions. But they're tied to two things outside Applied Materials's control: a chipmaker capital spending cycle that has historically run in booms and busts, and trade policy that can tighten or loosen with little notice. That's the risk the history-anchored valuation methods above are pricing in.
Economic Moat: Why StockOracle™ Rates Applied Materials a Wide Moat
StockOracle™ rates Applied Materials a Wide Moat business. The case rests on genuine switching costs: once a chipmaker qualifies its deposition and etch tools into a process node, replacing that equipment mid-process is expensive and risky, so customers rarely do it without good reason.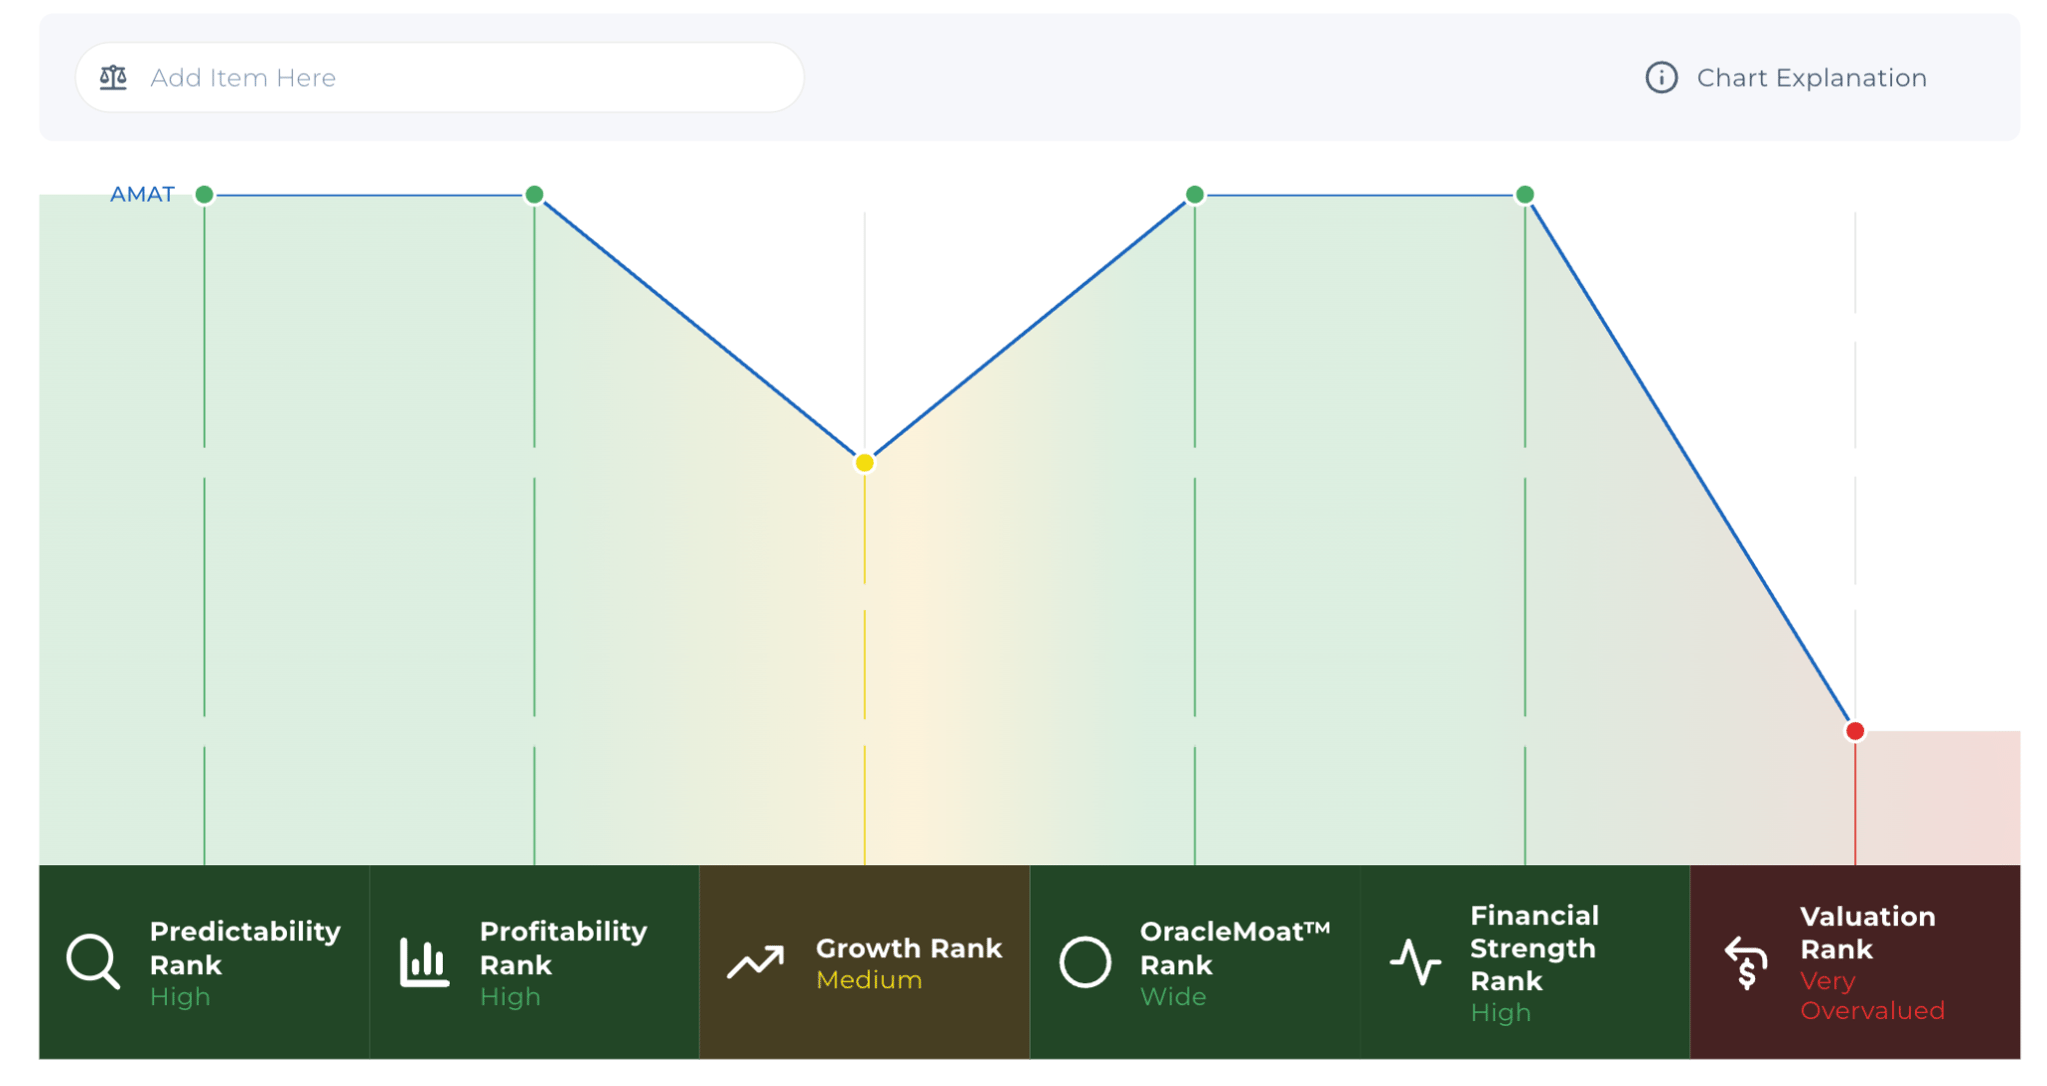
The competitive set carries different strengths, and Applied Materials must defend against each rather than simply outspend it.
Lam Research holds a technical edge in etch and deposition at the most advanced nodes, competing directly in its core categories.
KLA Corporation dominates process control and inspection equipment, a step it doesn't compete in directly, though its growth shapes the same capital spending cycle.
ASML occupies an even more concentrated niche in extreme ultraviolet lithography, giving it outsized influence over the industry's roadmap. None fully replicate Applied Materials's breadth across deposition, etch, and services in one supplier. That breadth is the core of the wide-moat case, though it protects market share more than it protects against the industry's own cyclicality or trade-policy risk.
A More Conservative Look at Applied Materials's Fair Value
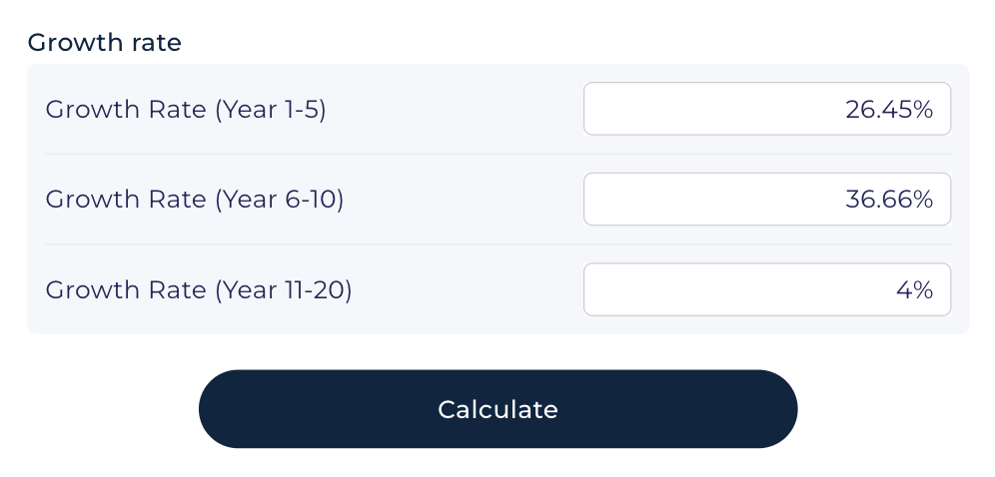
The $952.31 to $1,050.76 range above leans on growth assumptions of 26.45% and 36.66% holding for a full decade. Dial those down toward the mid-teens, closer to the semiconductor equipment industry's average across full cycles, and the model's output will compress it toward the mean price-to-book and price-to-earnings readings in the $260 to $295 range.
Turn the exercise around: what has to be true for the higher end to hold? The answer is specific and checkable: advanced packaging and HBM-driven memory capex need to keep expanding well beyond calendar 2026, and the China export restrictions, modeled at a roughly $600 million annual hit, need to avoid tightening further. Readers can run their own growth assumptions through StockOracle's free DCF calculator.
Final Thoughts on Applied Materials's Intrinsic Value
- Record quarterly revenue of $9.115 billion and a 13th consecutive quarter of gross margin expansion both reflect genuine AI-driven demand, not just market enthusiasm.
- Growth-trusting valuation methods (DCF-20 at $952.31, DFCF-20 at $638.90, DNI-20 at $1,050.76) sit at or above today's price, while history-anchored methods (DFCF-Terminal, mean P/B, P/E, P/S) sit in the $227 to $413 range, well below it.
- The model's Year 6-10 growth assumption of 36.66% is higher than its Year 1-5 assumption of 26.45%, implying roughly 15 times cumulative growth over the first decade, an unusually steep bar for a 20-year model to clear.
- Return on equity (41.07%) and return on invested capital (32.55%) are both exceptional and above their five-year averages, real evidence behind the premium the stock commands.
- U.S. export restrictions on China are already modeled at a roughly $600 million annual revenue hit, a policy risk layered on top of the industry's usual cyclicality.
- The wide-moat rating reflects genuine switching costs in qualified fabrication processes, but it protects market share more than it protects against the equipment industry's own boom-and-bust cycle.
Applied Materials's business is executing about as well as a capital equipment supplier can right now. The valuation split raises one open question: is the current AI-driven capex cycle a durable step-change in demand that can sustain a near-decade of 25%-plus annual growth, or the strong phase of a cycle that, in this industry, has always eventually turned?
This analysis is shared for educational purposes only and is not intended as financial advice or a recommendation to buy, sell, or hold any security. The valuation figures above are model outputs built on stated, adjustable assumptions, not a fixed or guaranteed price target, and should not be treated as a standalone signal. Past performance, including any figures referenced above, is historical and is not indicative of future results.