By Piranha Profits Team
Last updated on March 27, 2026
If you have a Netflix subscription and statistically, there is a strong chance you do. You have already experienced the core product firsthand. The autoplay that keeps you watching, the seamless experience across every device in your household. As consumers, we take this for granted. As investors, we should not.
|
Key Points
|
Netflix, Inc. (NFLX) has evolved from a DVD-by-mail disruptor into the world's dominant streaming entertainment platform, crossing 325 million paid subscribers globally at the end of 2025.
Revenue has scaled from roughly $8 billion in 2016 to over $45 billion, a nearly six-fold expansion in under a decade.
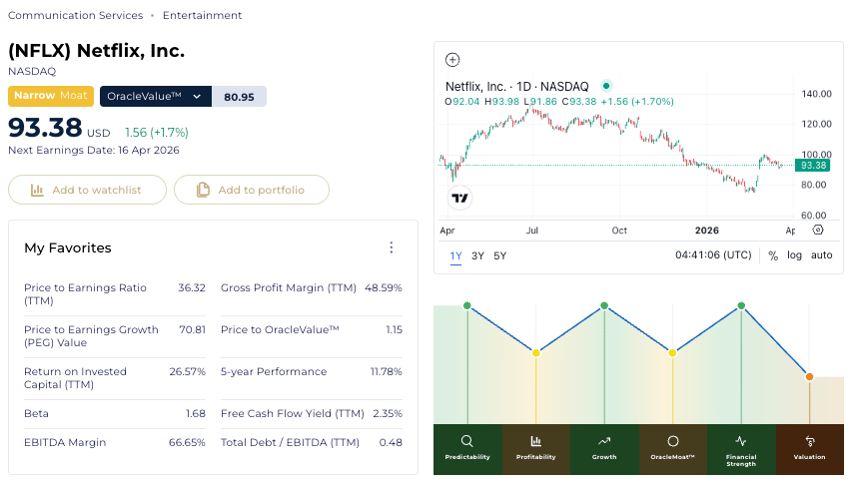
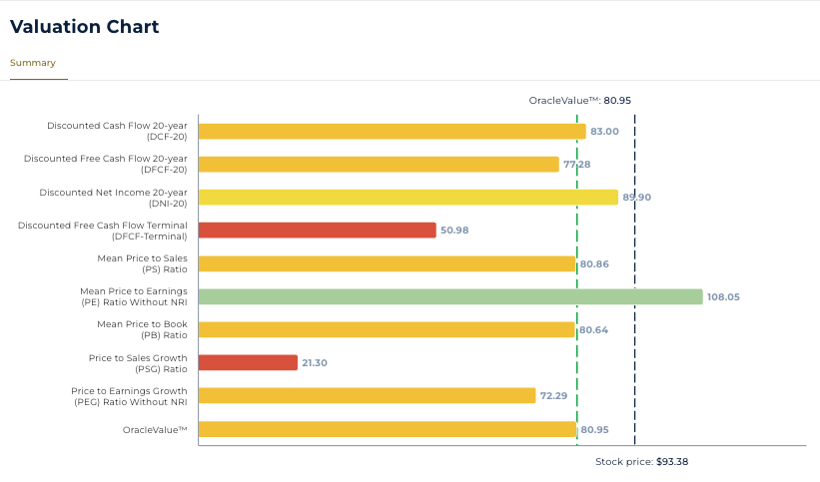
Based on OracleValue™ estimates, Netflix is slightly overvalued. With an OracleValue™ of $80.95 and a current price of $93.38 (accurate as of 24th March 2026).
Price-to-OracleValue™ ratio is 1.15, meaning the stock trades about 15% above its fair-value estimate. High Price-to-Earnings (36.32) ratios also suggest that the market expects strong future performance.
Netflix In The Headlines
The proposed $82.7 billion acquisition of Warner Bros. Discovery dominated headlines for months, only for Netflix to walk away in late February 2026 after Paramount Skydance submitted a superior bid. Netflix declined to raise its offer, collecting a $2.8 billion break-up fee. The market's sentiment has swung decisively bullish, at least in the short term.
Analysts at CFRA, Citi, and J.P. Morgan have all initiated or upgraded coverage with BUY ratings and price targets.
The question now is straightforward: with the deal overhang removed, strong operational momentum, and an ad-supported tier scaling rapidly, what does the StockOracle™ data tell us about Netflix's quality and valuation.
StockOracle™'s OracleIQ™ Analysis on Netflix (NFLX)
Netflix, Inc. (NFLX) OracleIQ™ powered by StockOracle™ - 24th March 2026
Through StockOracle™ Netflix's breakdown, the company presents an OracleIQ™ profile that tells a compelling story. Netflix shows high Predictability, expanding Profitability, robust Financial Strength, and a Narrow OracleMoat™ that could continue to deepen. Growth remains solid, powered by international expansion and advertising revenue, while Valuation suggests the market is pricing in a degree of optimism.
As an investor, this is the kind of profile that brings our focus naturally to valuation. The fundamentals are doing what we want them to do. The harder question, and we will address it further in the article, is whether the current price fully reflects that quality.
Netflix (NFLX) Predictability Rank
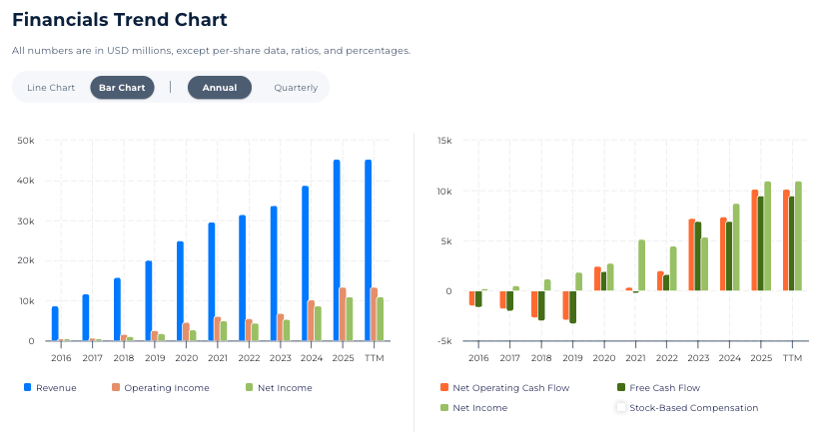
Netflix, Inc. (NFLX) Financials Trend Chart powered by StockOracle™ - 24th March 2026
Predictability scores high for Netflix, and the chart tells you why at a glance. Revenue has increased steadily from approximately $8.8 billion in 2016 to over $45 billion, with no sharp declines even during the 2022 subscriber growth scare that briefly rattled the market.
Operating income and net income have followed the same upward trajectory, accelerating sharply from 2022 onward as Netflix's operational leverage kicked in.
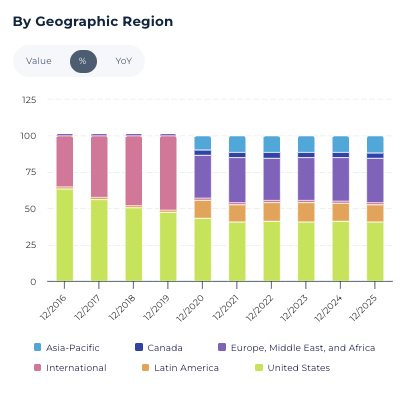
Netflix, Inc. (NFLX) Streaming by Geographic Region powered by StockOracle™ - 24th March 2026
What stands out is the consistency. Streaming subscriptions are recurring, sticky, and globally diversified. The geographic revenue breakdown reinforces this: while the United States remains the largest contributor, Europe, Middle East and Africa and Asia-Pacific have grown substantially, reducing concentration risk.
For investors, predictable revenue streams usually translate into more reliable free cash flow, which means both reinvestment capacity and shareholder returns.
Any past performance mentioned is not indicative of future results.
Netflix (NFLX) Profitability Rank
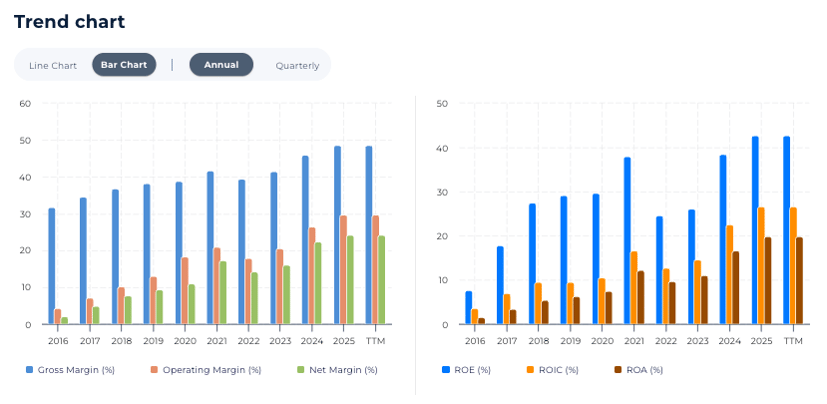
Netflix, Inc. (NFLX) Margins and Returns Chart powered by StockOracle™ - 24th March 2026
Profitability is where Netflix's transformation becomes most visible, and frankly, it is the dimension that excites us most. Netflix is not just growing, it is becoming dramatically more efficient. Let us explain why.
Netflix’s Gross margin has expanded from roughly 32% in 2016 to approximately 48.59%. Operating margin has climbed from low single digits to nearly 30%, and net margin has reached approximately 24%.
This margin expansion reflects scale economics: content costs, while substantial, are spread across a growing subscriber base, driving down per-user content cost.
The returns picture is equally strong. Return on Equity (ROE) has surged to approximately 52%, Return on Invested Capital (ROIC) sits at 26.57%, and Return on Assets (ROA) has climbed to around 22%.
These are not just good numbers, they place Netflix among the highest-returning large-cap businesses in the communications sector. EBITDA margin at 66.65% further underscores the operational efficiency of the platform.
Netflix (NFLX) Growth Rank
Netflix's Growth profile remains strong, though this is the dimension where the narrative gets nuanced, not because the business is slowing, but because it already operates at a scale where incremental growth becomes structurally harder.
When revenue base exceeds $45 billion and subscriber count tops 325 million, the growth percentages inevitably moderate even as absolute dollar growth remains impressive. To put things in perspective, there are roughly 1.6 - 1.8 billion TV households globally, that means that every 1 in 5 TV households are paid Netflix subscribers.
That said, Netflix has multiple growth engines firing simultaneously:
Global Subscriber Expansion: Asia-Pacific penetration sits at only 18% compared to 62% in North America. The Q4 2025 addition of 16.4 million net subscribers, a 25% Year on Year increase in net adds.
Advertising Revenue: This is the growth vector that has most captured analyst attention. Ad revenue more than doubled in 2025 to over $1.5 billion, with Q4 alone contributing $625 million (up 150% Year on Year). Projections for 2026 range from $2.8–$3.4 billion.
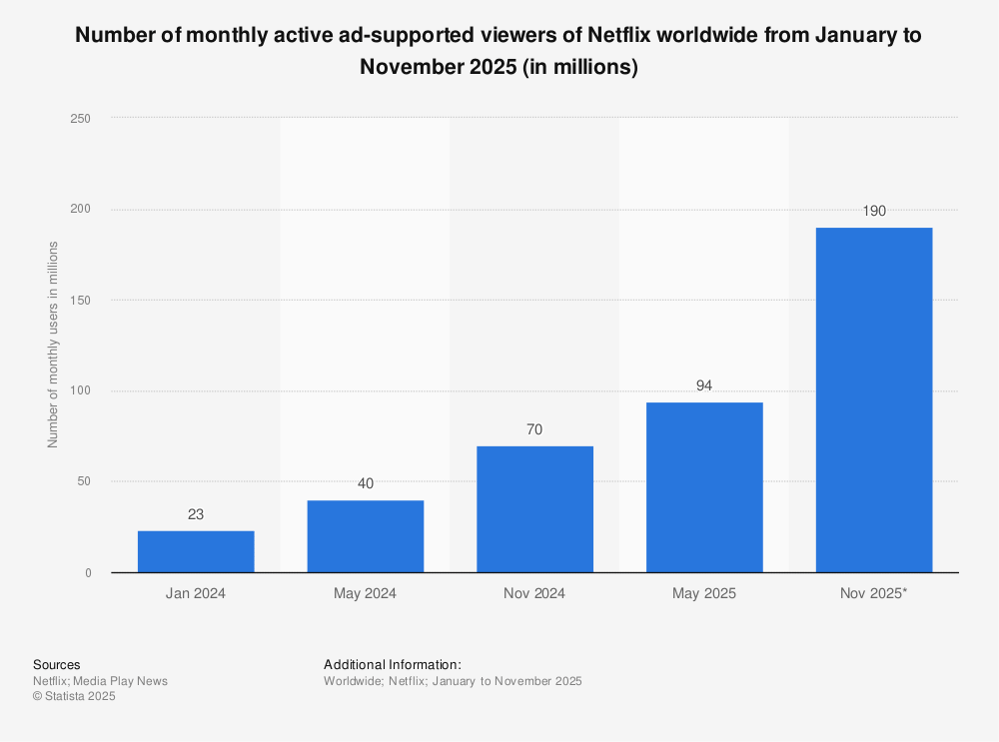
src : https://www.statista.com/statistics/1485182/netflix-monthly-ad-supported-users-global/?srsltid=AfmBOorfdh7FDEFpIKXIotjjsTyPwRd2XKcI8l6SBAtLxfYQ-mVMYL94 (netflix monthly active ad-supported viewers)
The ad-supported tier has reached 190 million monthly active viewers, and more than 50% of new subscribers in available markets choose this tier. With AI-powered ad formats rolling out in 2026, this revenue stream has meaningful room to scale.
Live Programming and New Formats: The expansion into boxing, NFL broadcasts, cloud gaming, and video podcasts diversifies engagement. Netflix has also demonstrated an appetite for testing live content formats that sit well outside traditional scripted programming.

Alex Honnold climbs a building in Taipei, Taiwan for 'Skyscraper Live' Courtesy of Netflix
The live broadcast of rock climber Alex Honnold scaling Taipei 101 drew 6.2 million viewers on Netflix, offering a clear proof of concept: audiences will tune in real time. Each event of this kind is less a one-off stunt and more a data point in a broader strategy to establish Netflix as the destination for moments that must be watched now, rather than queued for later.
Non-English Content: International originals accounted for 38% of total viewing hours in Q4 2025, up from 31% a year earlier, supporting subscriber growth in emerging markets while enriching the content library for global audiences.
For investors, the growth story is evolving from pure subscriber volume to revenue diversification. Netflix is becoming a multi-stream business, subscriptions, advertising, live content, gaming and that diversification strengthens the long-term compounding thesis.
Netflix (NFLX) Financial Strength Rank
Netflix, Inc. (NFLX) Customisable Charts powered by StockOracle™ - 24th March 2026
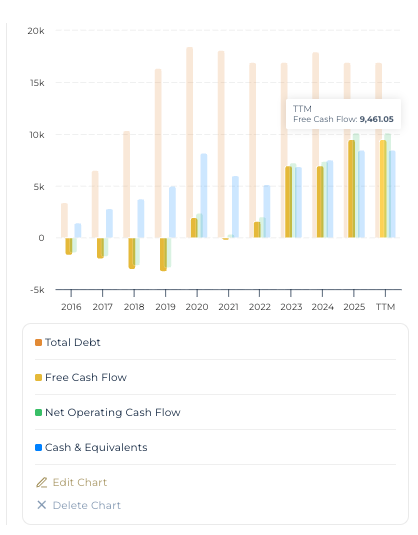
Financial Strength is where Netflix has undergone its most remarkable transformation, and the numbers deserve a moment of appreciation. This is a company that was burning cash just five years ago, and in 2025. It generated $9.46 billion in free cash flow, up 37% Year on Year.
 Netflix, Inc. (NFLX) Cash, Debt and Shares Outstanding Charts powered by StockOracle™ - 24th March 2026
Netflix ended Q4 2025 with around $8.4 billion in cash against $16.9 billion in total debt, a manageable position for a business of this scale.
OracleMoat™ of Netflix on StockOracle™
Netflix holds a Narrow OracleMoat™ rating, a rating that requires careful consideration. Firstly, Netflix's massive annual investment of $18–$20 billion in content, resulting in an extraordinarily expensive-to-replicate library.
Layered on this is a technological edge: their recommendation engine, refined over two decades and now AI-enhanced, significantly boosts engagement. Predictive analytics have improved hit rates by 23%, and personalized artwork increased click-through rates by 31%, creating a powerful technological barrier.
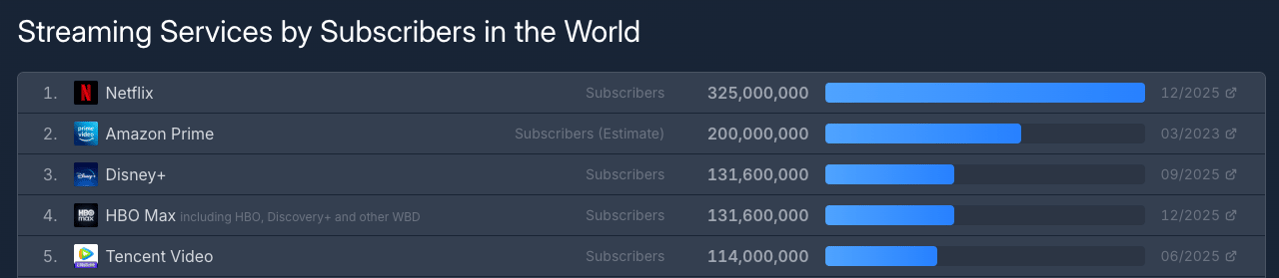
src : https://flixpatrol.com/streaming-services/subscribers/
Globally, Netflix is already synonymous with streaming, which drives efficient subscriber acquisition. Furthermore, while lower than in other industries, switching costs are present; personalised profiles and algorithmic familiarity create meaningful behavioral stickiness, evidenced by the successful conversion of password sharers.
However, the moat remains narrow due to the hyper-competitive streaming market. The market remains crowded with rivals like Disney+, Amazon Prime Video, and YouTube, all vying for consumer attention.
This environment, however, is one that Netflix embraces. As Theodore Sarandos, CEO of Netflix noted in the Q4 2025 earnings call : “...Lots of innovation, lots of competition. But that's also been true of us for twenty-five years. Netflix, Inc. kind of embraces change and thrives on competition because it pushes us to keep improving the service even faster and faster for our members.“
Netflix (NFLX) Valuation Calculation on StockOracle™
Netflix, Inc. (NFLX) Valuation Charts powered by StockOracle™ - 24th March 2026
Netflix's OracleValue™ is estimated at $80.95, against a current market price of approximately $93.38. This yields a Price-to-OracleValue™ ratio of 1.15, indicating that the stock is trading roughly 15% above its estimated OracleValue™.
Price to OracleValue™ measures how a stock's current market price compares to its OracleValue™. A ratio below 1 suggests the stock is trading below its OracleValue™, while a ratio above 1 indicates the market price exceeds its OracleValue™
 Netflix, Inc. (NFLX) Valuation Ratios powered by StockOracle™ - 24th March 2026
A Price-to-OracleValue™ of 1.15 suggests that Netflix is slightly overvalued relative to StockOracle™'s fair-value estimate. The Price-to-Earnings ratio of 36.94 further indicates that the market is pricing in expectations for continued strong execution.

OracleValue™ is an estimate and should not be taken as a recommendation or a signal to buy or sell stocks.
Intrinsic value estimates are based on long-term financial projections and assume multi-year holding periods. Short-term market movements may differ significantly from valuation estimates.
Final Thoughts
From the StockOracle™ lens, Netflix's OracleIQ™ paints a picture of a high-quality business.
At a Price-to-OracleValue™ of 1.15 it may not scream extreme overvaluation — it is a modest premium that reflects the market's confidence in Netflix's execution.
And this is where investors should ask ourselves the honest question: what exactly are we paying for at $93 per share? Are we underwriting higher-than-estimated growth in advertising revenue? Are we placing a premium on management discipline, demonstrated by the WBD walk-away? Do we think that Asia-Pacific penetration will scale faster than expectations?
There is no wrong answer, but having a clear thesis matters. If and when the market price meets the stock's intrinsic value, or a correction that brings the two closer together. Investors with a well-defined view of what they own and why will have the mental confidence to act decisively.
This analysis is shared for educational purposes to illustrate how markets and valuation models react to new information. It is not intended as financial advice or a recommendation on any investment.