By Piranha Profits Team
Last updated on May 22, 2026
It's been a tough 2026 for S&P Global (NYSE: SPGI). The stock has lagged the broader index as capital crowds into semiconductors and the AI infrastructure trade and a still-unproven AI disruption thesis has weighed on the SPGI’s stock price.
|
Key Points :
|
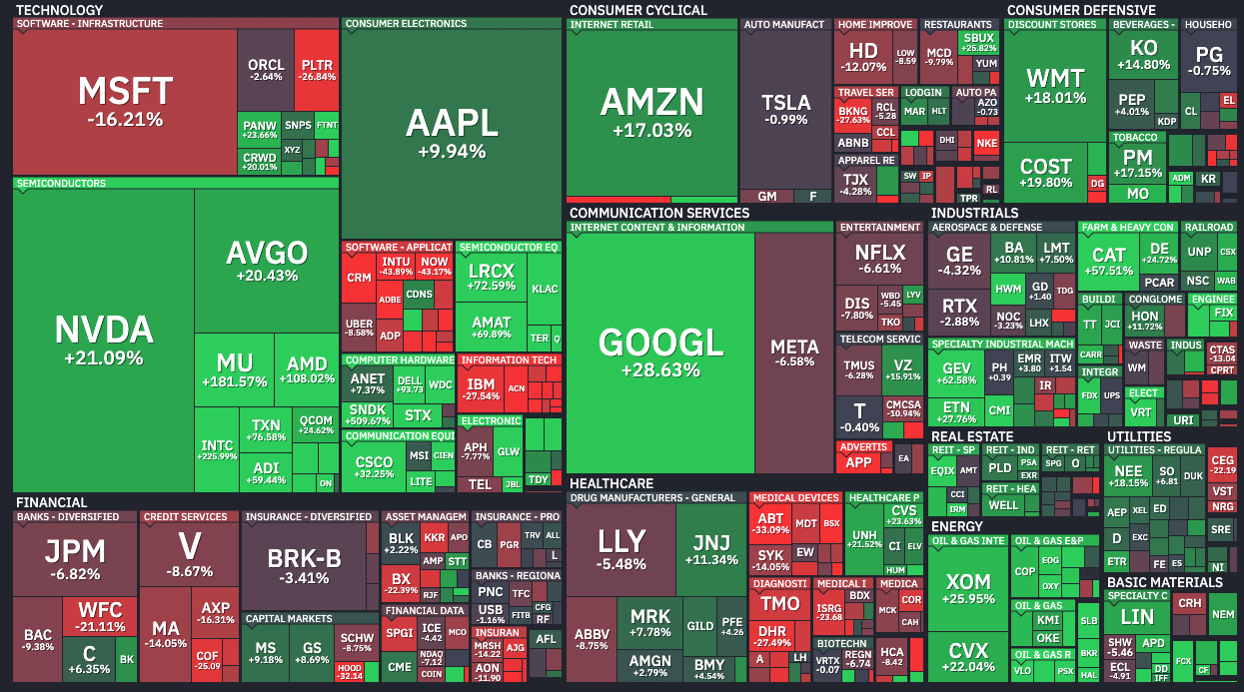
Finviz YTD Performance of the S&P500 (14th May 2026)
What is S&P Global's Intrinsic Value?
The intrinsic value of a company represents its economic worth, usually determined by projecting its future cash flows and discounting them back to today. StockOracle™ 's OracleValue™ estimates SPGI's intrinsic value at $515.65 as of 12 May 2026.
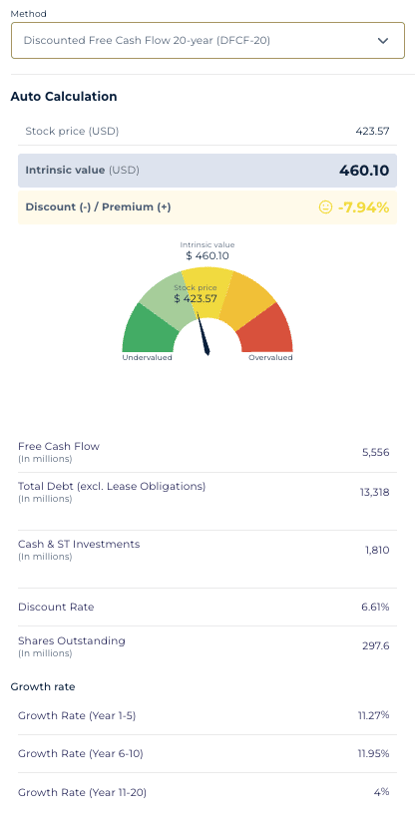
SPGI's intrinsic value calculator - Powered by StockOracle™
Using a 20-year Discounted Free Cash Flow (DFCF-20) model with a discount rate of 6.61%, and growth assumptions of 11.27% (years 1–5) and 11.95% (years 6–10), the estimated intrinsic value for S&P Global (NYSE: SPGI) is calculated at $460.10 per share.

With StockOracle™, you can readjust these growth rates and adjust metrics like shares outstanding to develop your own customised DFCF-20 assumptions.
What makes SPGI's intrinsic value calculation unusually clean is the predictability of its cash flows. Unlike cyclical operating businesses, S&P Global runs on recurring subscriptions, asset-linked licensing fees, and transaction-based ratings each of which behaves differently across market cycles, smoothing the overall cash flow curve. That's the nuance worth understanding before we get to the business itself.
S&P Global Financial Performance Driving SPGI FCF Intrinsic Value
A company's intrinsic value hinges on its capacity to grow revenue, produce increasing cash flow, and uphold its competitive moat. An analysis using OracleIQ™ reveals that S&P Global excels in predictability, profitability, and the strength of its economic moat.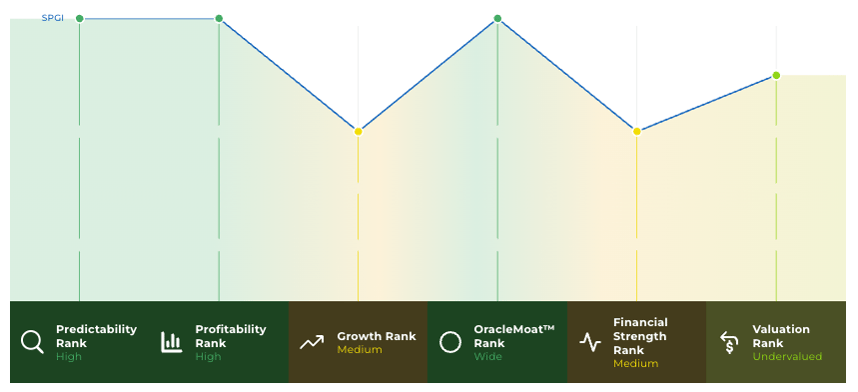
S&P Global's margins sit consistently and substantially above industry benchmarks:
- Gross Profit Margin averages 62.0%, with 2025 closing at 62.6% as the business worked through the IHS Markit integration period of 2022–2023
- Net Profit Margin averages 28.6%
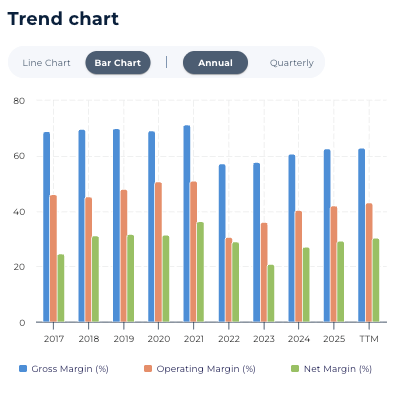
S&P Global (SPGI) Financial Highlights — Gross and Net Profit Margins 2021–2025
Margins in this range are rare outside of pure software businesses and that's the point. S&P Global functions more like a data utility than a traditional financial services firm.
Free Cash Flow: The Core of S&P Global's Intrinsic Value
When investors calculate intrinsic value, they rarely focus on topline revenue alone. Instead, they look at free cash flow, the cash a company has left after all the deductions and costs to run the business. Free cash flow is what typically funds buybacks, dividends, and long-term compounding.
S&P Global generated:
- $5.56 billion in free cash flow (TTM)
- $18.67 in free cash flow per share
- 4.41% free cash flow yield at the current stock price
SPGI Shareholder Returns
S&P Global has also consistently returned capital to shareholders through a combination of dividends and share repurchases. With 297.6 million shares outstanding and $5.56 billion in annual free cash flow, SPGI with a 18.67 Free Cash Flow per Share holds meaningful capacity to retire shares over time. Creating value for shareholders.
What S&P Global Does — And Where Its Future Growth Comes From
Intrinsic value carries a growth component baked into the model. To assess whether those growth assumptions hold, it helps to look at what S&P Global actually sells and how durable those revenue streams are.
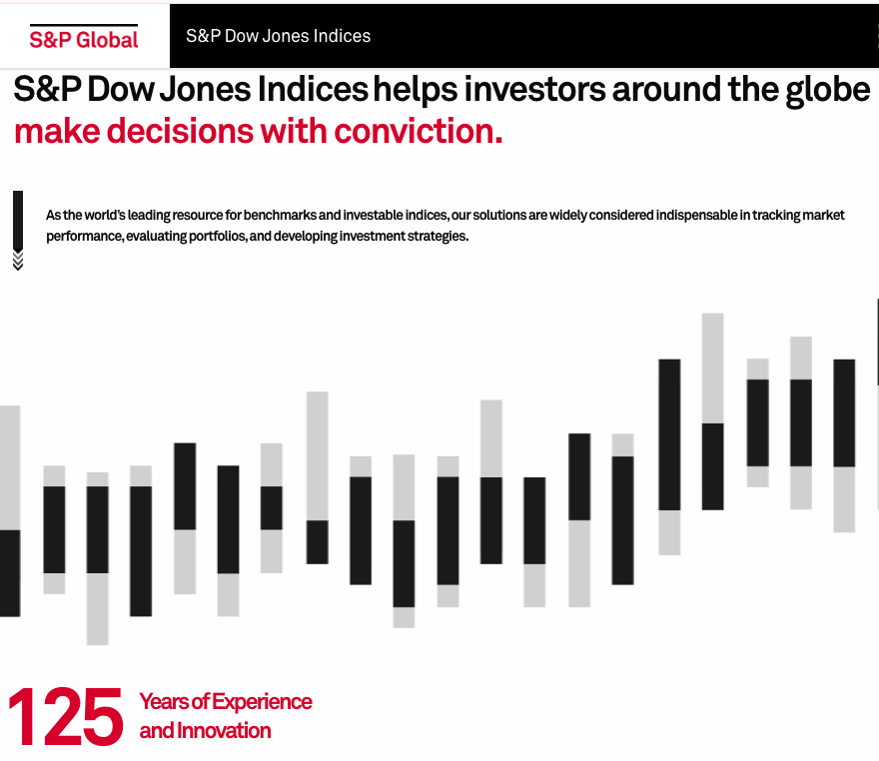
S&P Dow Jones Indices — Source: spglobal.com
A factor in SPGI's revenue is its Indices division, arguably the most structurally powerful segment in the entire business. The S&P 500 is the global standard benchmark for equity performance, tracked by trillions of dollars in passive investment vehicles worldwide. S&P Global earns licensing fees based on the assets under management in funds that track its indices, which means this revenue line scales automatically as markets appreciate and new capital flows into index funds, without S&P needing to sell anything new.
Key attributes of this segment:
- AUM-tied revenue: Index licensing fees rise as passive AUM grows
- More than 100 years of brand credibility: The S&P 500 is not a product that can be easily replicated, it is an institution embedded in global investment mandates, pension fund benchmarks, and regulatory frameworks
Additionally, SPGI has an expanding data marketplace: S&P Global Marketplace offers premium fundamental and alternative datasets via Desktop, Cloud, Data Feed, and API Solutions, layering new subscription revenue on top of the core index business

S&P Global Marketplace — Source: spglobal.com
This is a category of growth that is unusually durable. It is driven not by individual sales cycles but by the structural, decade-long shift of global capital toward passive investing.
Final Thoughts on S&P Global's Intrinsic Value
Total S&P Global revenue grew 7.9% for the full year of 2025, in line with the October guidance of 7% to 8%, demonstrating execution consistency.
In Q1 2026, as markets turned turbulent, S&P Global reported record performances across multiple product lines. S&P Global Energy and S&P Dow Jones Indices recorded a record-setting quarterly average daily volume for S&P 500 Exchange-Traded Derivatives.
Compare SPGI to MCO with StockOracle™ 7 Day Free Trial Here.