By Piranha Profits Team
Last updated on August 17, 2026
Semiconductor stocks have spent 2026 swinging between euphoria and panic. Wall Street erased roughly $1.3 trillion from chip valuations in a single week in early July on doubts about AI capex, then watched the sector claw some of it back.
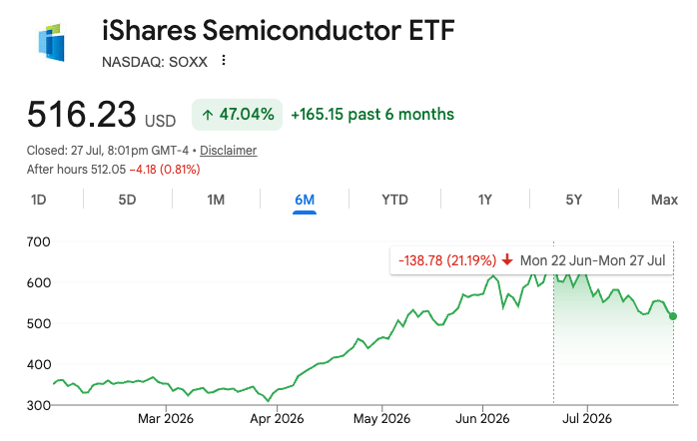
AMD sat at the center of that whiplash, down as much as 21% from its June high, before Baird handed it a street-high $1,250 price target and Bank of America nearly tripled its estimate of AMD's total AI accelerator market to $1.4 trillion, all inside the same month.
When the sell side can't agree on whether this is a bubble or the early stages of a supercycle, the question is simple: what growth rate would actually have to show up to justify today's price and is that the growth rate currently baked into the model?
What Is AMD's Intrinsic Value?
Intrinsic value is what a business is actually worth based on the future cash it can generate, not what the market happens to be paying for it today. For a semiconductor company riding an AI infrastructure buildout this large, the gap between "what the business does" and "what the model assumes it will keep doing for the next two decades" is where the debate lives.
AMD's Intrinsic Value: The OracleValue™ Estimate
Using its proprietary blended model, StockOracle™ estimates AMD's intrinsic value at $519.12 per share, with AMD slightly narrow-moat rated on the platform.
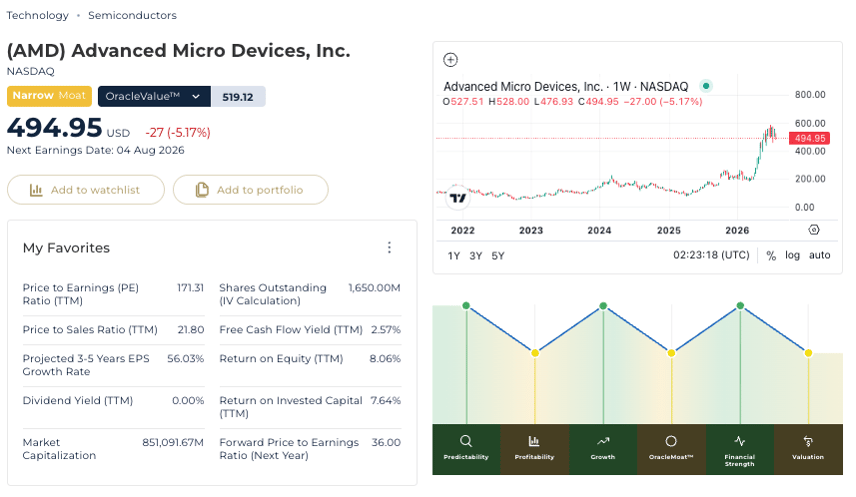
AMD Price & OracleValue™ Overview — Powered by StockOracle™ Accurate as of 28 July 2026
Run AMD through a 20-year discounted cash flow lens and the estimate lands north of $3,600 with high growth rates expected from major financial analysts. Then look at the multiples-based methods — price-to-sales, price-to-book, price-to-earnings-growth — and every one of them clusters between roughly $190 and $260.
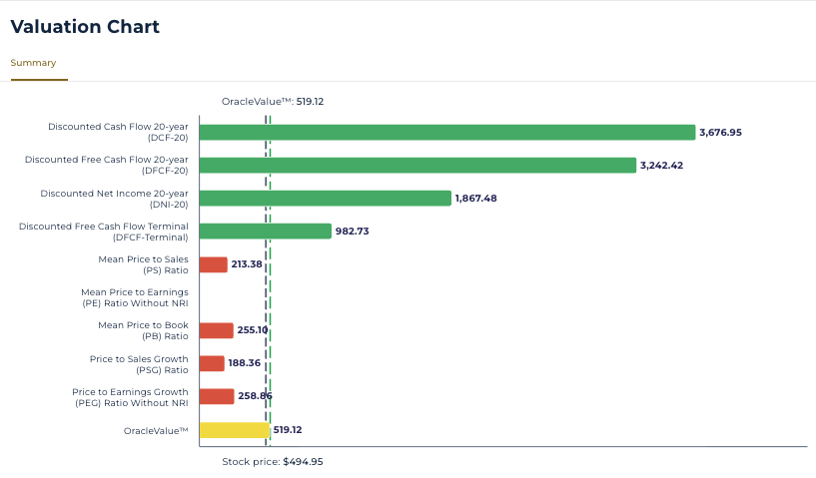
AMD Valuation Chart: Method-by-Method Breakdown — Powered by StockOracle™ Accurate as of 28 July 2026
Here's the plain-English version: the cash-flow methods assume AMD keeps compounding at AI-boom growth rates for years. The multiples-based methods assume the market eventually prices AMD like the rest of the semiconductor industry once growth normalizes.
That split is the entire reason AMD's valuation is so heavily contested right now, and it's worth pulling it apart in detail in the DIY DCF section below.
Advanced Micro Devices (AMD) Financial Performance
Revenue: A Business Being Reshaped by One Segment
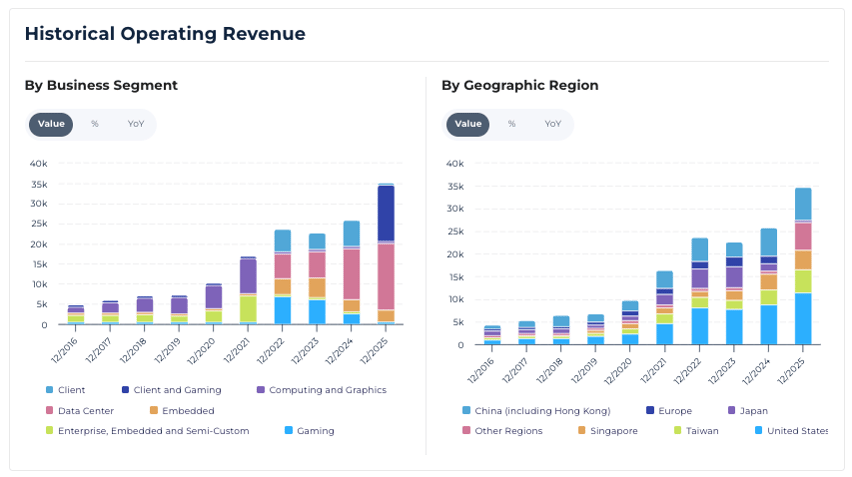
AMD Historical Operating Revenue by Segment and Geography — Powered by StockOracle™ Accurate as of 28 July 2026
For most of the last decade, AMD's revenue mix was a fairly even split between Client (PCs), Gaming, and Embedded. That shape has visibly changed. Data Center has gone from a supporting segment to the dominant driver of AMD's growth, and the geographic mix has broadened well beyond the US and China to include a meaningfully larger European and Japanese contribution. This is a company whose product mix has fundamentally shifted toward the highest-margin, highest-growth part of its business.
Free Cash Flow: The Line the Whole Debate Sits On
Free cash flow is the cash that actually moves through the business after the bills are paid.
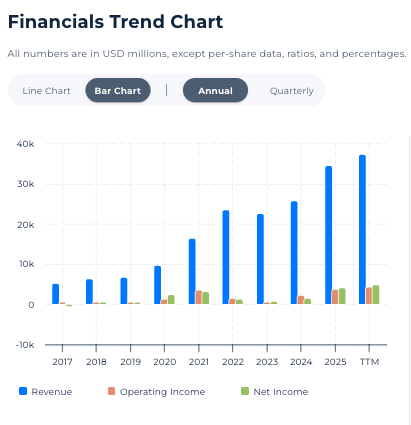
Financials Trend Chart: Revenue, Operating Income, Net Income — Powered by StockOracle™ Accurate as of 28 July 2026
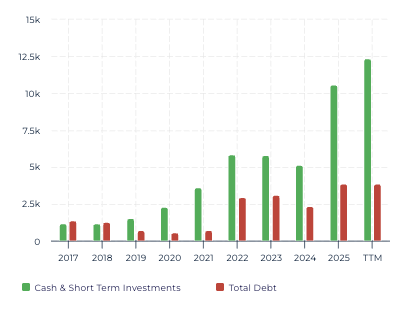
Cash & Short-Term Investments vs. Total Debt — Powered by StockOracle™ Accurate as of 28 July 2026
AMD's free cash flow yield sits at roughly 2.57% on a trailing basis. Pretty modest for a company trading at 171x trailing earnings, but the trend line matters more than the snapshot. Both revenue and net income have scaled sharply on a trailing-twelve-month basis, and the balance sheet has followed: cash and short-term investments have grown well ahead of total debt over the past several years, giving AMD a widening net cash cushion to fund R&D and capacity commitments without leaning hard on the credit markets.
Returns on Capital: A Real Dip, and a Real Recovery
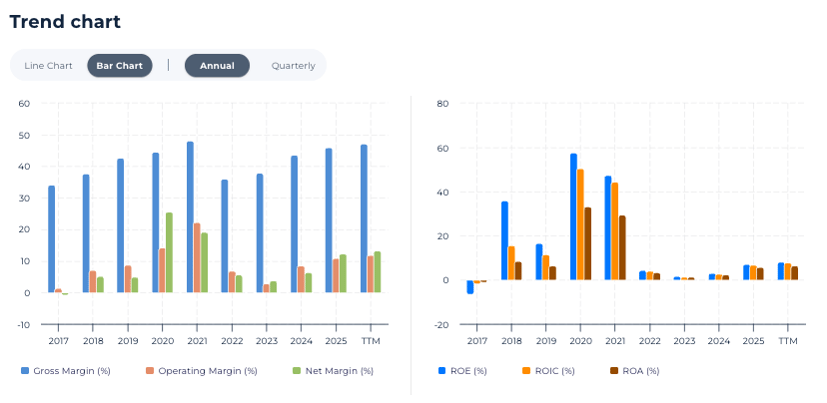
Margins and Returns Trend — Powered by StockOracle™ Accurate as of 28 July 2026
Gross margin has held in the mid-to-high 40s for most of the past decade, but operating and net margins tell a more dramatic story. Both spiked in 2020–2021, then collapsed in 2022–2023 before recovering into the TTM period. That collapse lines up with AMD's 2022 Xilinx acquisition, whose amortization and stock-based compensation charges weighed heavily on GAAP profitability for two years.
Return on equity and return on invested capital followed the same arc, cratering in 2022–2023 before rebuilding to the current 8.06% ROE and 7.64% ROIC.
Advanced Micro Devices (AMD) Growth Catalysts
The bull case doesn't rest on PC or gaming demand. It now rests almost entirely on AMD's position in AI data center compute, and the last month of newsflow has been unusually dense:
Advancing AI 2026 event (July 22–23): AMD launched Zen 6 EPYC "Venice" server CPUs on TSMC's 2nm node and confirmed Helios rack-scale system pricing at $5–5.5 million per rack, with Microsoft Azure confirmed as the anchor customer for Helios systems set to begin shipping in the second half of 2026.
TAM estimates re-rated within days: Following the event, Bank of America raised AMD's total addressable compute market forecast to more than $2 trillion by 2030, up from a prior $1 trillion estimate.
A supportive sector backdrop: FactSet's Q2 2026 Earnings Insight projected the semiconductor industry would deliver 131% year-over-year earnings growth, the single biggest driver of the Information Technology sector's expected 63.3% earnings growth.
Why it matters for valuation: AMD's next earnings report will be the first data point testing whether the TAM upgrades and price-target hikes of the last month are grounded in delivered numbers, or running ahead of them.
Economic Moat: A Narrow Advantage in a Crowded Field
StockOracle™ rates AMD's moat as Narrow, and the label fits. AMD is genuinely competitive in AI accelerators and server CPUs, but every major rival carries a specific, defensible advantage AMD has to work around:
Nvidia (NVDA) owns the CUDA software ecosystem. Over a decade of developer tooling, libraries, and trained engineers that make switching accelerator vendors an organisational cost.
Broadcom (AVGO) has deep custom-ASIC design relationships with hyperscalers like Google (TPU) and Meta, letting those customers bypass merchant silicon entirely for their highest-volume workloads.
Intel (INTC) carries decades of x86 server incumbency and its own foundry ambitions, giving it a captive base of enterprise relationships AMD has spent years chipping away at.
AMD's answer has been the ROCm software stack, chiplet-based design flexibility, and rack-scale system sales like Helios that bundle compute, networking, and memory, a strategy built to defend share in AI compute rather than replicate Nvidia's software lock-in outright.
Building Your Own DCF: Why the Default Assumptions Run Hot
This is the section worth slowing down on, because the auto-calculated scenario makes the intrinsic value worth a second look.
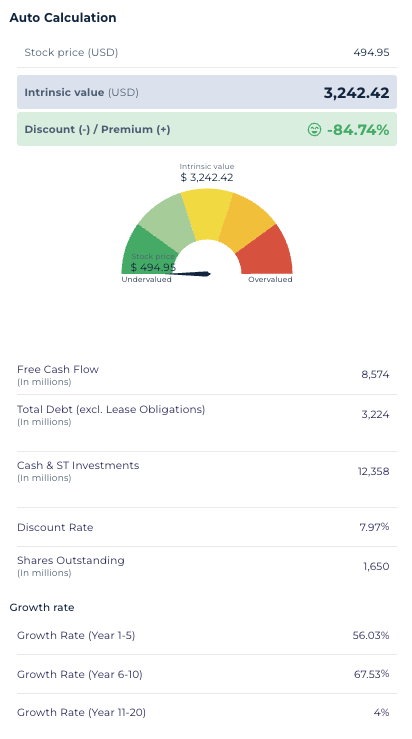
DFCF-20 Auto-Calculation — Powered by StockOracle™ Accurate as of 28 July 2026
Run AMD through the 20-year discounted free cash flow calculator on its default settings and the tool spits out an intrinsic value of $3,242.42 against a $494.95 share price. A huge gap between value and price. Now if we put on a deep lens into the growth formula, look at what has to be true for the model to get there:
- Years 1–5 growth: 56.03%
- Years 6–10 growth: 67.53%
- Years 11–20 growth: 4%
Growth accelerating from 56% to 67.5% in the second five-year stretch is typically not how maturing businesses behave.

A model assuming AMD's growth rate is still climbing a decade from now, on top of an already explosive first five years, is compounding two consecutive periods of hypergrowth before finally stepping down to a 4% terminal rate. That combination is what pushes the DFCF-20 output to more than six times the current share price, even OracleValue™ 's own estimate sits at a far more conservative – $519.12.
This is exactly why StockOracle™'s calculator is built to be adjusted, not taken as-is. Try halving the Years 6–10 assumption, or tapering it below the Years 1–5 rate the way most maturing businesses actually behave, and watch how quickly the implied intrinsic value moves.
Final Thoughts on AMD's Intrinsic Value
Data Center has become AMD's dominant growth engine, backed by a genuine hyperscaler customer. The balance sheet's net cash position has widened, giving AMD room to fund R&D without financial strain
The argument between the bulls and bears is over how many years of that growth rate deserve to be priced in before it has actually shown up on an income statement. If Data Center revenue and free cash flow continue compounding at anywhere close to the rates analysts have been projecting in since July, intrinsic value estimates could trend meaningfully higher from here.
This analysis is shared for educational purposes and is not intended as financial advice or a recommendation on any investment. OracleValue™ is an estimate and should not be taken as a signal to buy or sell. Any past performance mentioned is not indicative of future results.
Related
Home Depot trades at 21.95 times trailing earnings, a multiple that assumes the growth engine ...

Philip Morris International posted its first $11.2 billion revenue quarter, with organic growth ...
Lam Research stock has surged more than 90% this year, outrunning nearly every semiconductor peer, ...