By Piranha Profits Team
Last updated on August 14, 2026
Costco is trading near record highs at 48x trailing earnings slightly richer than Walmart's roughly 41x.
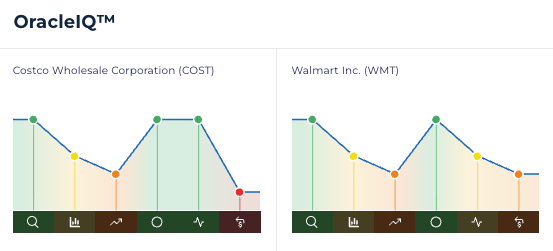
While its own margins and returns on capital sit only modestly above their five-year averages. Some of that gap has a real cause: chip and AI-infrastructure stocks sold off sharply in July on doubts about whether all the AI spending will pay off, and investors moved into safer, dividend-paying names instead.
Costco shares were up roughly 13% through mid-2026 on that shift alone. So the real question isn't whether Costco is a good business, nobody argues that. It's whether a defensive retailer posting single-digit-to-teens improvement in its numbers has actually earned a valuation this rich, or whether the market simply rotated a little too hard into the name everyone already trusts.
What Does Costco Actually Do?
Costco runs on a model that looks boring: charge customers a membership fee for the right to shop, then sell merchandise at razor-thin markups.
The membership fee is where the company makes its profit; merchandise is priced to keep members renewing, not to maximise margin on any single sale. Kirkland Signature, its private label, undercuts name-brand pricing on staples members buy repeatedly, reinforcing that value proposition. That flywheel. Low prices drive renewals and renewals fund low prices is the core of the business.
What Is Costco's Intrinsic Value?
Intrinsic value is an estimate of what a business is actually worth based on the cash it can realistically generate over time, not whatever price the market happens to assign it on a given day.
Costco's Fair Value: What a 20-Year DCF Model Says
Run Costco's own numbers through a 20-year discounted free cash flow model and fair value lands near $486 per share. Well below where the stock recently traded. The model starts from Costco's trailing free cash flow of $8,806 million, nets out $5,766 million in total debt against $19,996 million in cash and short-term investments, and discounts future cash flows at 6.06%.
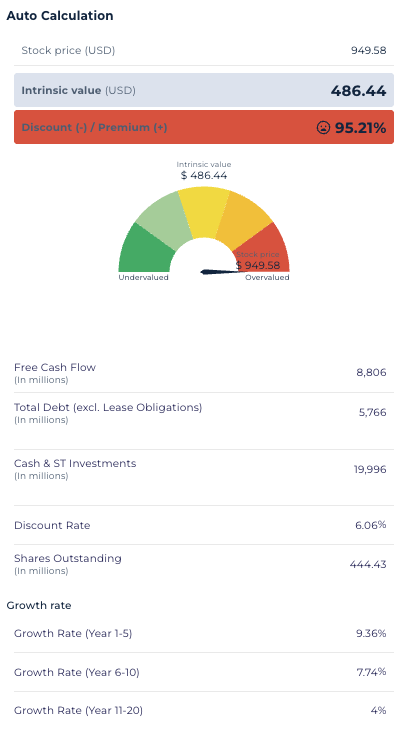
Costco (COST) 20-Year Discounted Cash Flow Model — Powered by StockOracle™ · Accurate as of 13 August 2026
The growth assumptions feeding that number aren't aggressive by retail standards: 9.36% for Years 1–5, tapering to 7.74% for Years 6–10, and settling at 4% for Years 11–20. A normal, tapering shape for a DCF, and roughly in line with Costco's own projected 3–5 year EPS growth rate.
That's what makes the gap between $486 and the market price worth sitting with.
That points to two different stories. The bull case: Costco's international and digital expansion (more on both below) could sustain double-digit growth for longer than a 20-year DCF's tapering structure assumes, which would push the model's own fair-value output higher over time.
The bear case: a meaningful slice of the current price reflects a safety premium from the defensive rotation described above, rather than a change in Costco's underlying cash-generating economics, and that kind of premium can compress quickly if capital rotates back toward riskier assets, even while the business keeps executing exactly as it has been.
Costco (COST) Financial Performance
Revenue: Scale That's Still Accelerating
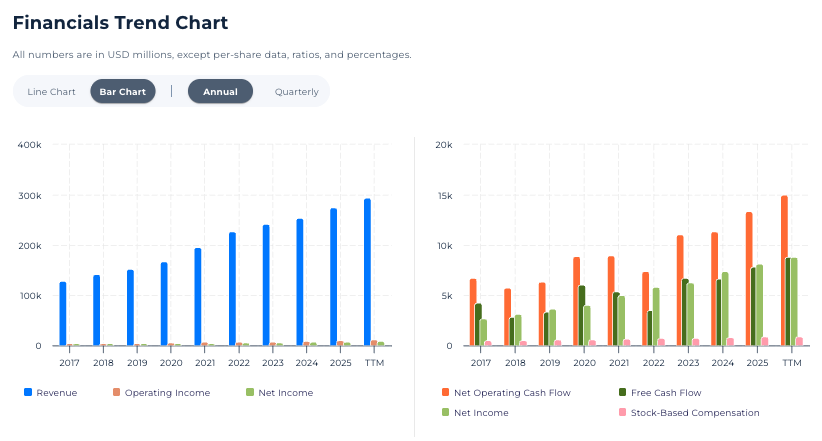
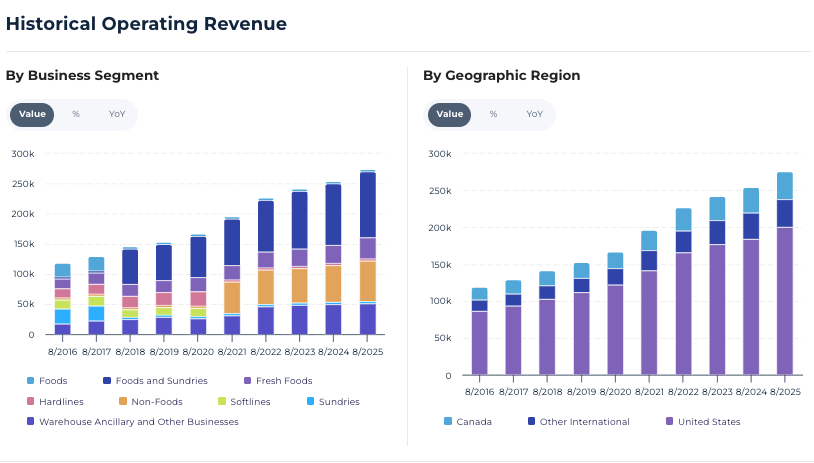
Costco Historical Revenue — Powered by StockOracle™
Costco's net sales grew 11.6% year-over-year to $69.15 billion in the most recent quarter, with adjusted comparable sales up 9.8% globally. Most retailers Costco's size stopped posting years ago.
The revenue mix shows why: U.S. sales still dominate in absolute dollars, but Canada and other international markets have grown into a meaningfully larger share of the base than a decade ago, giving Costco more than one geography carrying the growth load at once.
Free Cash Flow: The Number the Valuation Actually Leans On
A discounted cash flow model is ultimately a bet on one number: how much cash the business will keep throwing off, year after year, after paying for everything it needs to run and grow.
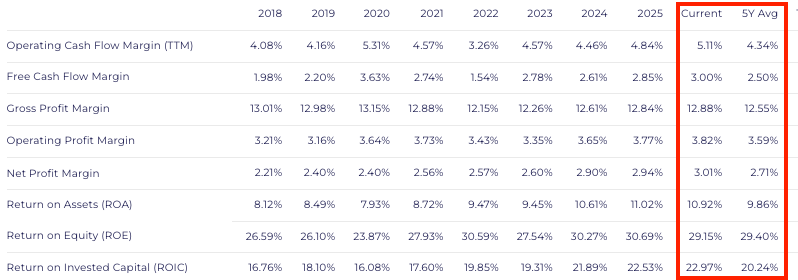
For Costco, free cash flow margin (TTM) sits at 3.00%, up from a five-year average of 2.50%, while operating cash flow margin has climbed to 5.11% against a 4.34% five-year average. In plain terms: for every dollar of merchandise Costco sells, a slightly larger sliver is now converting into real cash than it did a few years ago.
Returns on Capital: Better, But Not Transformed
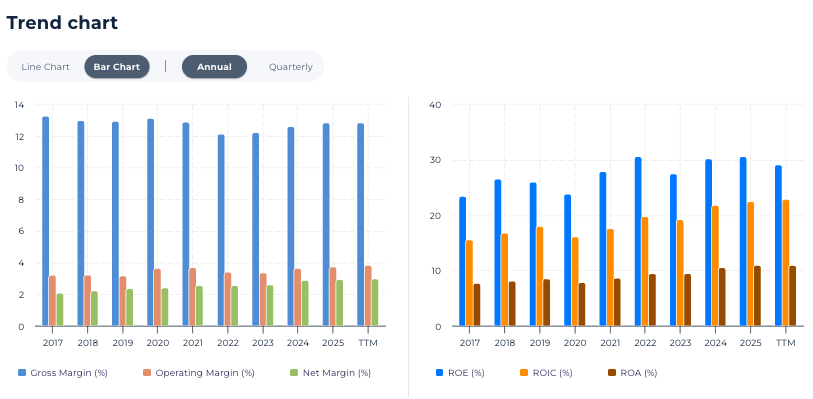
Costco Margins and Returns Trend — Powered by StockOracle™
Return on invested capital (TTM) sits at 22.97%, up from a five-year average of 20.24%, and return on assets has climbed to 10.92% from 9.86% both real, measurable improvements in how efficiently Costco is deploying capital.
Return on equity, by contrast, sits at 29.15%, essentially flat against its own five-year average of 29.40%. Put together, capital efficiency is improving at the margin, which is worth holding up directly against a stock trading at a multiple usually reserved for businesses whose returns are re-rating, not just drifting slightly higher.
Costco (COST) Growth Catalysts
International and Warehouse Expansion
- Costco is targeting 30-plus net new warehouses annually in future years, though fiscal 2026 openings were trimmed to 28 because of construction delays in Spain.
- The company now operates 931 warehouses globally, with recent additions in France and Canada – some built from converted existing structures to hold down capital costs.
Why it matters for valuation: a new-store productivity number that's climbing, not just a store count that's climbing, is what actually feeds a DCF's growth assumptions. It's evidence the incremental warehouse is getting more valuable, not just adding volume.
Digital and Membership Momentum
- Digitally-enabled sales grew 21.5% in the most recent quarter and 21.6% year-to-date roughly double the pace of overall comparable sales.
- Costco's worldwide membership renewal rate stands at 89.8%, a slight step down from 90.2% the prior quarter, which management attributes to a rising share of members joining online, who tend to renew at somewhat lower rates than in-store sign-ups in their first cycle.
- Membership fee revenue reached $1.37 billion in the quarter, up from $1.24 billion a year earlier.
Why it matters for valuation: the question worth asking is whether that renewal dip reflects a membership base that's simply shifting channels, or something softer in the core loyalty loop itself.
Economic Moat: Why Costco's Advantage Holds Up
Costco's moat isn't abstract brand loyalty — it's a set of specific, hard-to-copy mechanics:
- Membership economics that subsidize the price. Because the fee itself is the profit engine, Costco can price merchandise closer to cost than a normal retailer ever could and still run a healthy business.
- Kirkland Signature. A private label with real scale and quality reputation, not just a store-brand afterthought — it gives Costco pricing power a pure reseller doesn't have.
- Treasure-hunt merchandising. A deliberately limited, rotating SKU count creates urgency and repeat visits in a way an infinite-aisle retailer structurally can't replicate.
- Purchasing scale. Buying in the volumes Costco does gives it supplier terms most competitors can't match.
The competitive set each carries a different embedded advantage, and Costco has to defend against each rather than copy it. Sam's Club, under Walmart's umbrella, can lean on Walmart's broader logistics and supply chain network behind its own membership model. BJ's Wholesale Club runs a leaner, more regionally concentrated footprint concentrated in the U.S. Northeast and Southeast, competing hard on price in the markets it's chosen to serve. Amazon, through Prime, reaches a membership base built for at-home delivery speed rather than in-warehouse bulk buying — a different value proposition Costco doesn't need to match head-on, but has to keep from eroding its own relevance against.
Building Your Own DCF: What Would Have to Be True
The $486 estimate above already uses a reasonably generous, tapering growth path.
Turn the exercise around and ask what it would take for a DCF to land closer to the current market price instead, and the answer is a growth and duration assumption well beyond what's already a fairly generous base case.

Essentially betting that the international and digital catalysts above don't just continue, but must accelerate and sustain for longer than a normal 20-year taper assumes. Run your own growth assumptions through StockOracle's DFCF calculator to see where your own numbers land.
Final Thoughts on Costco's Intrinsic Value
- Free cash flow margin and return on invested capital have both climbed above their five-year averages.
- Return on equity is essentially flat against its own historical average.
- New warehouses are getting more productive, with first-year sales per location up from $150 million to $192 million.
- Digitally-enabled sales growing at roughly double the pace of overall comps signals a real second growth engine.
The market isn't wrong that Costco is executing well. It looks like it is. The open question is whether it's paying for that execution, or paying an additional premium for the safety of owning a name everyone already trusts during a year when riskier growth stocks have gotten scarier to hold.
If the international and digital catalysts keep compounding at their current pace, the fair-value estimate above has real room to climb over time. If the rotation into defensive names fades before that growth shows up in the free cash flow line, the multiple has room to compress even if the business itself keeps performing exactly as it has been.
This analysis is shared for educational purposes only and is not intended as financial advice or a recommendation to buy, sell, or hold any security.
The DCF figures above are a model output built on stated, adjustable assumptions — not a fixed or guaranteed valuation — and should not be treated as a standalone signal. Past performance, including any figures referenced above, is historical and is not indicative of future results.
Related
Home Depot trades at 21.95 times trailing earnings, a multiple that assumes the growth engine ...

Philip Morris International posted its first $11.2 billion revenue quarter, with organic growth ...
Lam Research stock has surged more than 90% this year, outrunning nearly every semiconductor peer, ...