By Piranha Profits Team
Last updated on August 14, 2026
Intel just posted its fastest quarterly revenue growth in over 15 years. One of its biggest rivals in AI compute is now also a shareholder (NVDA), and the U.S. government's stake in the company is up in the last nine months.
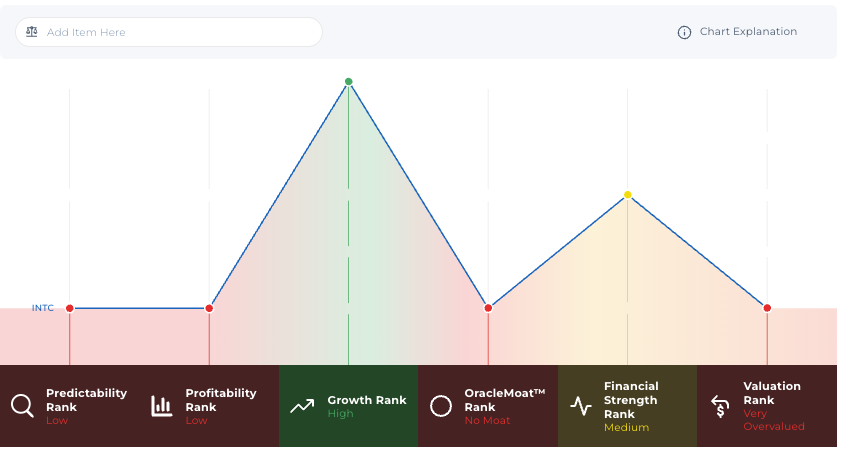
The stock carries a No Moat rating from StockOracle™, and a valuation model that flags it as very overvalued while a discounted cash flow model says it's trading below its own fair-value estimate. That's the puzzle this article is here to unpack.
So. What Does Intel Actually Do?
Strip away the jargon and the semiconductor industry splits into three lanes.
Chip designers - Nvidia, AMD they draw up the blueprints but pay someone else to physically build the chip.
Foundries - TSMC, Samsung, GlobalFoundries. Build, manufacture other companies' designs at enormous scale.
And a shrinking third group, called IDMs (integrated device manufacturers), do both under one roof.
Intel is one of the last major IDMs left standing. It designs its own processors for PCs and servers. That's the Client Computing Group and Data Center & AI segments and it has traditionally manufactured most of those chips itself. Its biggest strategic bet right now is turning that same factory floor into a foundry business, Intel Foundry, that builds chips for other companies too. That move puts Intel in direct competition with TSMC on manufacturing, on top of its existing design rivalry with AMD and Nvidia.
What Is Intel's Intrinsic Value?
Intrinsic value is the estimated economic worth of a business based on the cash it can realistically generate over its lifetime. Not whatever price the market happens to assign it today. For most companies that's a fairly linear exercise. For Intel right now, it isn't, and the gap between different valuation lenses is the real story.
Why Intel's Valuation Looks So Whacky Right Now
Look at Intel through two different lenses and you get two different verdicts.
The Price-to-Sales-Growth (PSG) ratio, currently 40.82. Flags Intel as overvalued. That lens is essentially asking: is the market paying too much for each dollar of sales relative to how fast sales are actually growing?
Given Intel's return on equity (TTM) sits at -12.18% and return on invested capital (TTM) at -8.12% the business is still destroying value on the capital it has deployed. Paying a premium sales multiple on top of that can look illogical, unless the growth rates priced into the stock are assumed to be high.
Then look at a 20-year discounted free cash flow (DFCF) model below, and the read flips.
Using a 7.97% discount rate against Intel's free cash flow base, the model puts fair value near $118.53 per share slightly above the current price. That's not because Intel's cash generation today is strong. Free cash flow (TTM) is just $344 million against roughly $57 billion of revenue. The business essentially at breakeven on real cash.
An important caveat, the entire $118.53 figure is riding on a rich growth assumptions: a 72.53% Year 1–5 growth rate, pulled straight from consensus 3–5 year EPS growth estimates adnd followed by an even steeper 89.37% Year 6–10 assumption, before settling to a more ordinary 4% for Years 11–20.
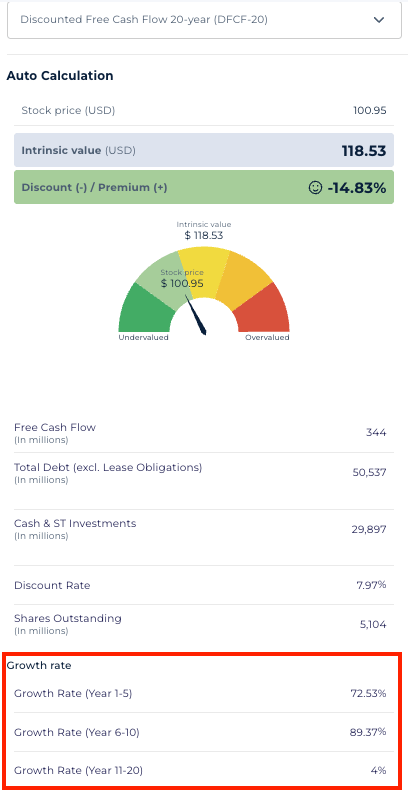
Intel's 20-Year Discounted Free Cash Flow Model — Powered by StockOracle™ · Accurate as of 13 August 2026
To put the scale of that assumption in perspective: compounding at 72.53% a year means the underlying base would need to roughly double every 14–15 months, or grow more than 15-fold over the five-year window alone.
That's the kind of trajectory usually reserved for early-stage growth stories, not a decades-old chipmaker still posting negative returns on capital and it's exactly the sort of number a more conservative investor would trim down toward Intel's own guided or historical growth pace before trusting the model's output.
Put simply: the PSG lens is pricing what Intel is right now (a low-margin business with negative returns on capital). The DCF lens is pricing what Intel could become if a very aggressive foundry-and-AI-silicon growth path plays out on schedule. Neither lens is "wrong" ; they're answering different questions, and that's what makes the valuation feel whacky.
What OracleIQ™ Says About Intel
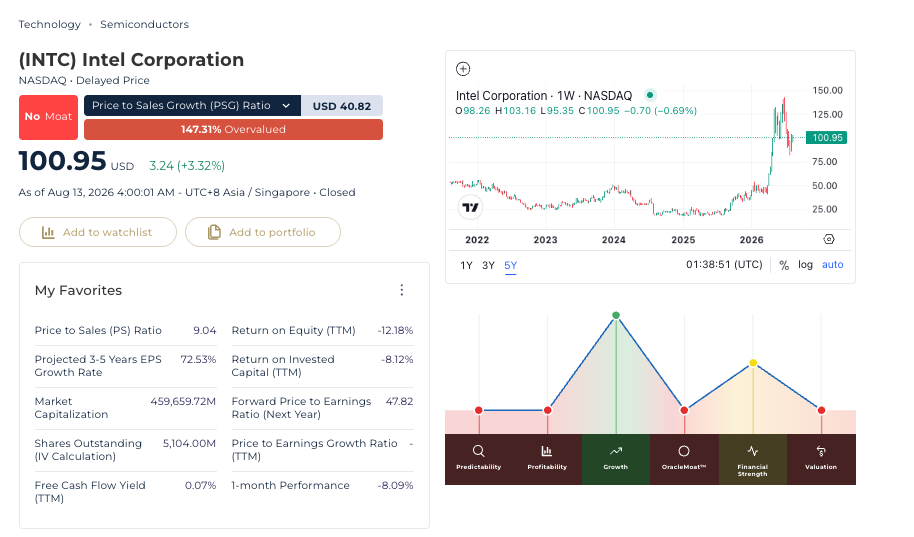
Intel (INTC) Overview — Powered by StockOracle™ · Accurate as of 13 August 2026
- Predictability — Low (red): near-term earnings visibility is genuinely poor for a business mid-transition.
- Profitability — Low (red): negative ROE and ROIC (TTM) show up directly here.
- Growth — High (green): the 72.53% projected 3–5 year EPS growth estimate drives this.
- OracleMoat™ — No Moat (red): more on this below.
- Financial Strength — Medium (yellow): a leveraged but not distressed balance sheet.
- Valuation — Very Overvalued (red): the PSG-ratio read discussed above.
Intel scores green on Growth alone, while Predictability, Profitability, Moat, and Valuation all flash caution. That's the profile of a re-rating bet on a specific catalyst path.
Intel's Revenue: The Foundry and AI Pivot, in the Numbers
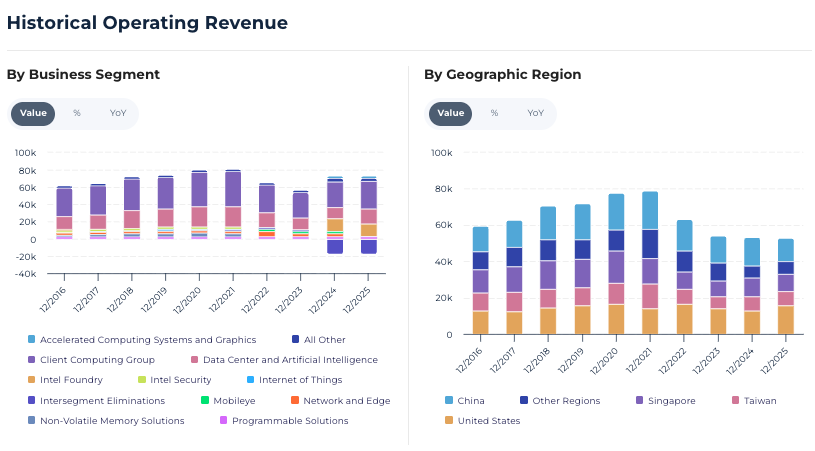
Intel Historical Operating Revenue by Segment and Region — Powered by StockOracle™
Client Computing (PC chips) has long been Intel's largest segment, with Data Center & AI and the newer Intel Foundry segment behind it. Revenue climbed from roughly $62 billion in 2017 to a peak near $79 billion in 2021, then fell to the low-$50 billions through 2023–2024 as PC demand cooled and Intel lost server and desktop share to AMD.
Intel's Q2 2026 results showed quarterly revenue of $16.1 billion, up 25% year-over-year. Its fastest growth in over 15 years, with Data Center & AI revenue up 59% to $6.3 billion and Intel Foundry revenue up 31% to $5.8 billion.
Geographically, the U.S. and China remain the two largest markets, with Taiwan and Singapore rounding out the mix.
Returns and the Balance Sheet
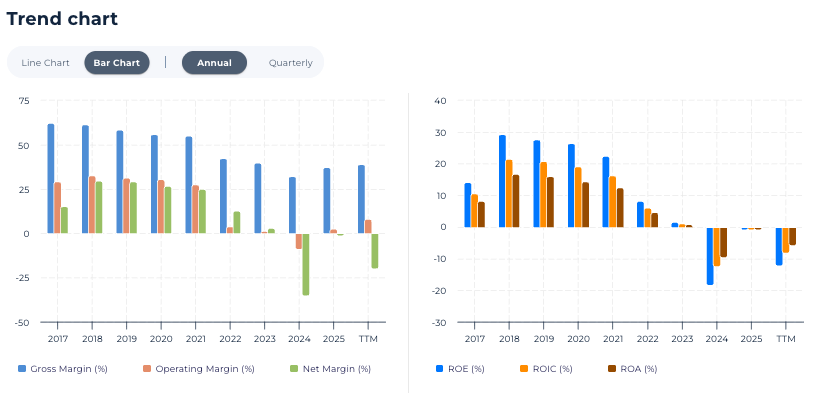
Intel Returns Trend — Powered by StockOracle™
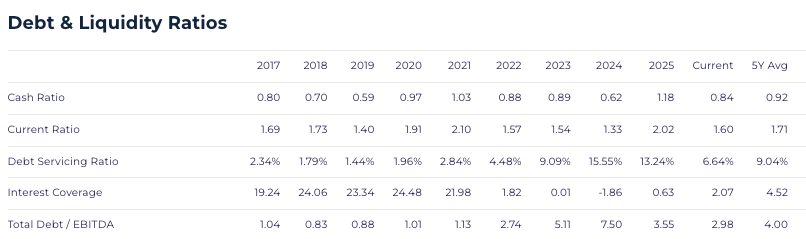
Returns metrics reflect a business still working through the cost of its foundry buildout. On the balance sheet, Intel carries roughly $29.9 billion in cash and short-term investments against $50.5 billion in total debt (TTM). Interest coverage has thinned to 2.07x on a trailing basis, down from a 5-year average of 4.52x but still worth watching as the foundry buildout continues.
Growth Catalysts: What's Actually Changed
Three developments explain why the market's growth expectations for Intel have moved so far, so fast:
- 18A is shipping. Intel began high-volume manufacturing on its 18A process node in early 2026, with "Panther Lake" consumer chips and "Clearwater Forest" server chips shipping from Fab 52 in Arizona at reported yields of 65–75% — generally viewed as commercially viable for a new leading-edge node.
- Nvidia is now a capital partner, not just a rival. Nvidia finalized a $5 billion equity investment in Intel, tied to integrating Nvidia's NVLink interconnect with Intel's x86 architecture — capital and credibility that helps Intel court additional foundry customers.
- Apple is reportedly in early talks with Intel about manufacturing some lower-tier M-series chips as part of a "Taiwan plus one" diversification strategy, alongside a U.S. government equity stake (roughly 9.9%, taken in August 2025) that has more than tripled in value.
Each of these is a reason for the 70+% growth assumptions from analysts. None of them is proof the assumptions will hold.
Economic Moat: Why StockOracle™ Rates Intel No Moat
A "No Moat" rating isn't a verdict that Intel's business is worthless, it's a statement that its competitors currently carry more durable, harder-to-copy advantages than Intel does.
TSMC still runs the largest and most advanced leading-edge foundry capacity in the world, and its scale is the reason Apple, Nvidia, and AMD all manufacture there today.
Nvidia's moat isn't just chip design, it's the CUDA software ecosystem that locks developers into its hardware, an advantage Intel's foundry ambitions don't touch.
AMD has spent the last several years gaining x86 server and desktop share on the back of a flexible chiplet design approach that lets it iterate faster than Intel's own product cycles.
And Samsung Foundry remains a live alternative for any customer weighing where to place manufacturing outside Taiwan.
What Intel is building instead are new, less-proven advantages: government-backed capital, a strategic tie-up with Nvidia, and a U.S.-manufacturing story that appeals to customers wanting supply-chain diversification. Whether those add up to a durable moat, or just a temporary tailwind, is the open question the "No Moat" rating is really pointing at.
A More Conservative Look at Intel's Fair Value
The $118.53 figure above leans on an aggressive growth assumption. Run the same 20-year DFCF model with more conservative inputs with growth rates closer to the pace implied by Intel's own Q3 2026 guidance rather than the full consensus 3–5 year EPS estimate. The fair-value output will compress meaningfully.

That's not a reason to dismiss the base case; it's a reason to treat $118.53 as one point on a range rather than a fixed answer. If the foundry ramp and AI silicon demand keep compounding the way Q2 2026 suggested, the more aggressive scenario becomes easier to defend. If growth cools back toward Intel's historical norm, the fair-value estimate has real room to fall.
Final Thoughts on Intel's Intrinsic Value
What StockOracle™ surfaces on Intel, stripped to the fundamentals:
- Revenue has turned a corner, with Q2 2026 posting its fastest growth in 15 years.
- Free cash flow has climbed from a 5-year average of -15.23% margin to roughly breakeven — real progress, even if the number is still small.
- Return on equity and return on invested capital remain negative, and the OracleMoat™ rating is still "No Moat."
The market hasn't resolved whether Intel is a moated incumbent reclaiming its footing or a capital-intensive turnaround still years from proving it out. Both the PSG-ratio "Very Overvalued" read and the DCF's "undervalued" read are correct, given what each is measuring. If the foundry and AI silicon ramp keeps compounding the way Q2 2026 suggested, the growth case gets easier to defend and the fair-value estimate could trend higher. If it stalls, the valuation has genuine room to reprice lower.
This analysis is shared for educational purposes only and is not intended as financial advice or a recommendation to buy, sell, or hold any security. The DCF/DFCF figures above are a model output built on stated assumptions and should not be treated as a standalone signal. Past performance, including any figures referenced above, is not indicative of future results.
Related

For most of its 24-year life, the company was private. The figures floating around came from leaks, ...

A business that still earns a 22.8% return on invested capital, carries no interest-bearing debt, ...

Home Depot trades at 21.95 times trailing earnings, a multiple that assumes the growth engine ...