By Piranha Profits Team
Last updated on August 03, 2026
Johnson & Johnson has built its reputation on one habit: it loses less than the market when things get bad. In 2022, a year the S&P 500 fell about 18%, JNJ posted a positive total return of nearly 6%, and in Q1 2025, when tariff fears knocked the index down more than 4%, JNJ rose 16% as investors rotated into steadier, less discretionary names.
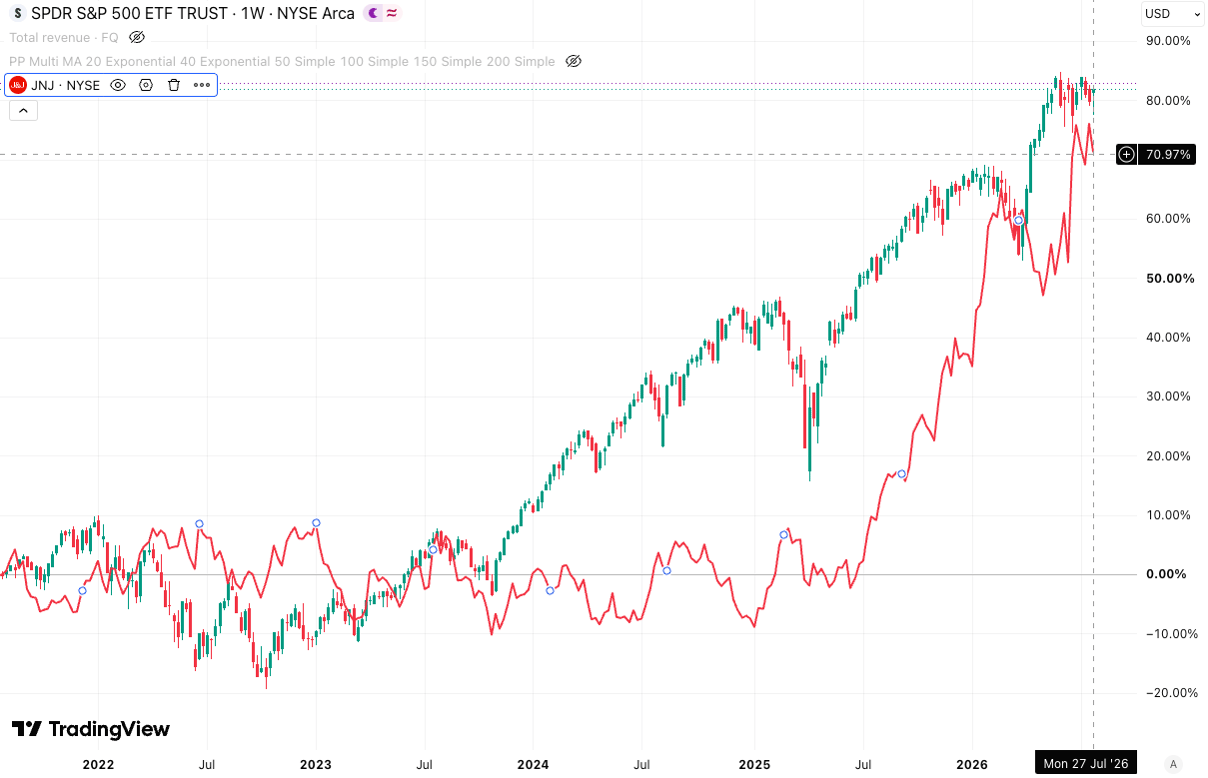
That reputation is exactly what's being tested now: the stock just hit an all-time high near $275 on a $5.5 billion talc settlement, then dropped nearly 4% two days later on news that a new acquisition will cut 2027 EPS by $1.36, and J&J now trades at almost 31x trailing earnings with its relative-performance line up 70.97% since 2022. These are figures that owe far more to growth expectations than recession-proofing, which raises the question of whether J&J's defensive reputation earned this premium, or the market has started pricing a "safe" stock like something it's never actually been.
What Is Johnson & Johnson's Intrinsic Value?
Intrinsic value is what a business is actually worth based on the future cash it can generate, not what the market happens to be paying for it on any given day. For a company as large and diversified as J&J, where pharmaceuticals, medical devices, litigation, and dividends are all pulling the valuation story in different directions, that StockOracle™ estimate cuts through a lot of noise.
Johnson & Johnson's Intrinsic Value: The OracleValue™ Estimate
Using its proprietary model, StockOracle™ estimates Johnson & Johnson's intrinsic value at $183.60 per share.
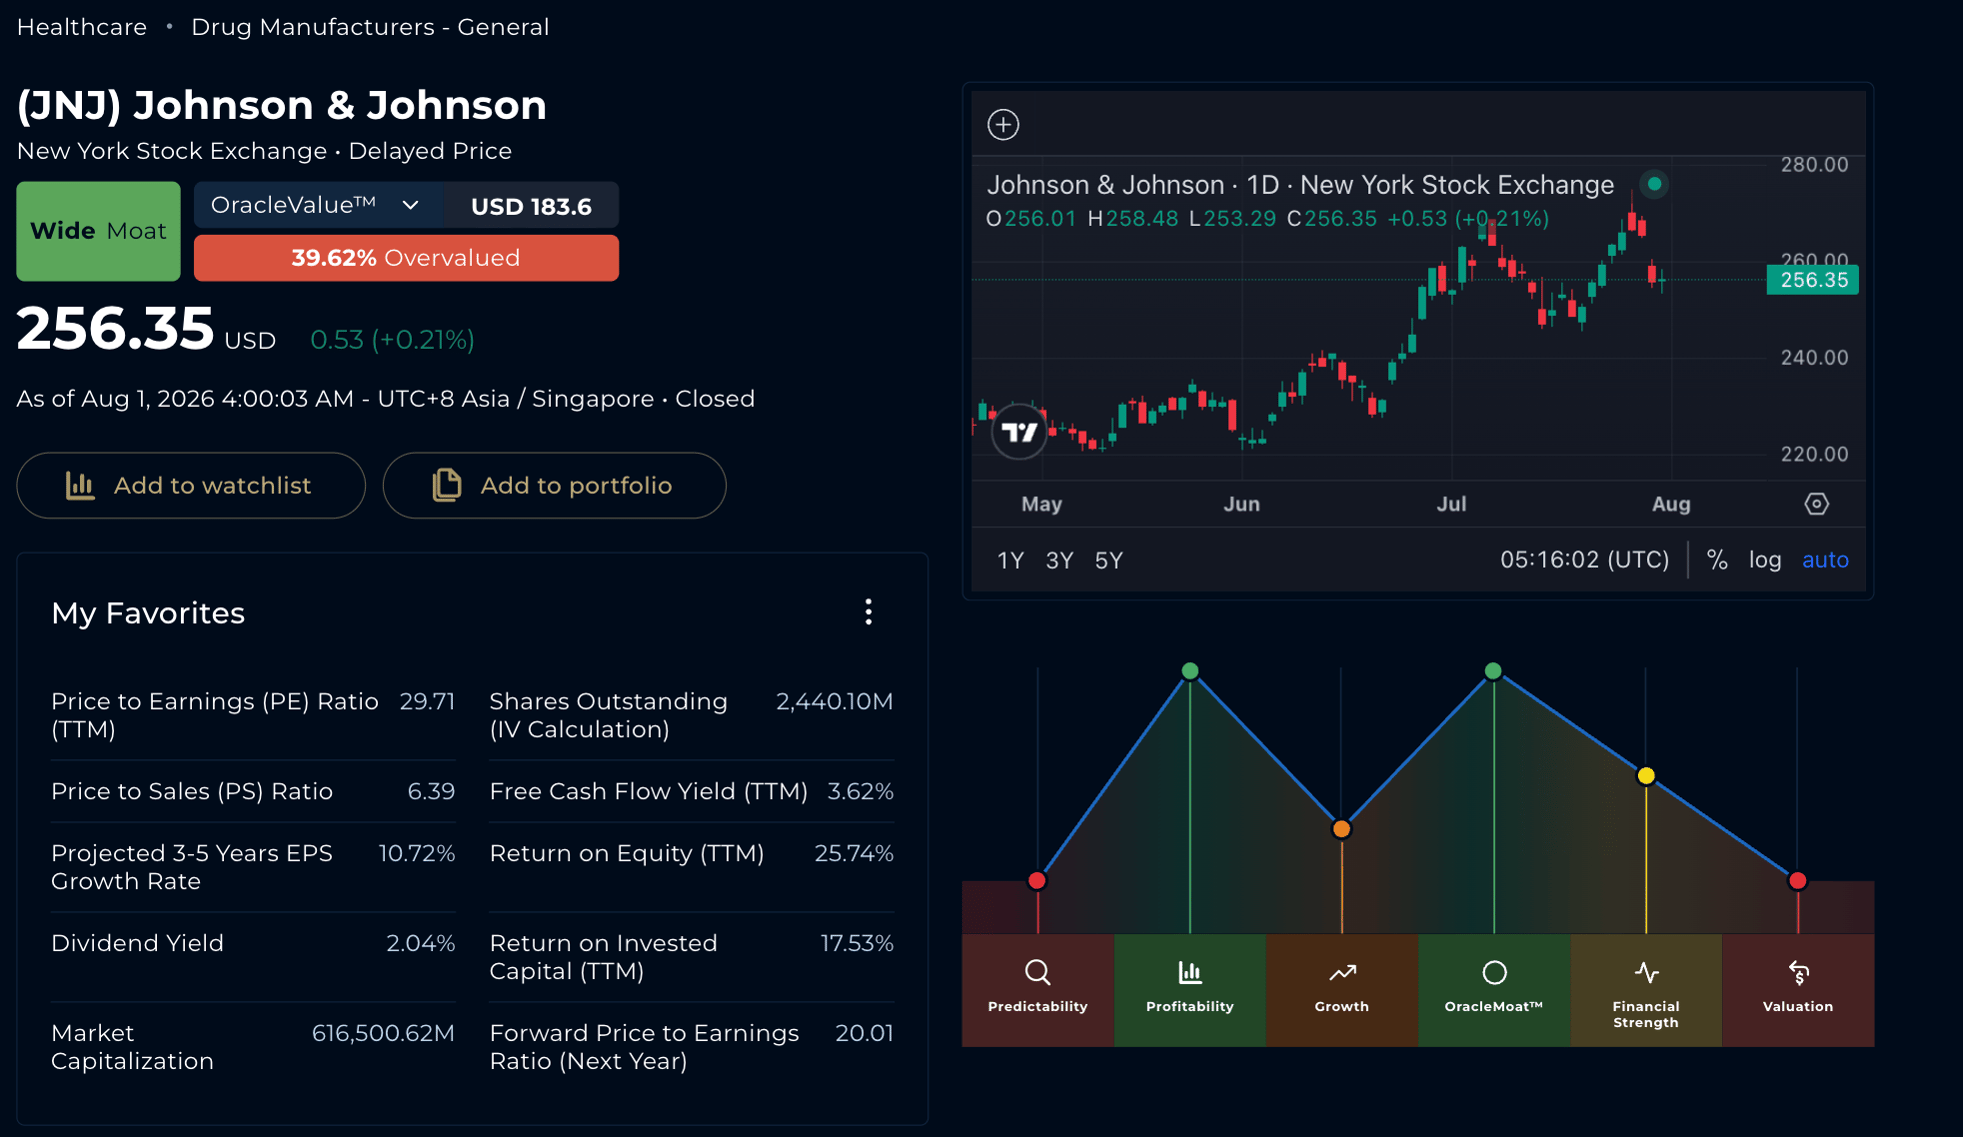
JNJ Price & OracleValue™ Overview — Powered by StockOracle™ Accurate as of 31 July 2026
That fair value estimate sits alongside a Wide OracleMoat™ rating, even as the stock trades near 30.8x trailing earnings and roughly 19.9x forward earnings. These are multiples that price J&J closer to a growth compounder than the defensive healthcare name it's historically been labeled.
Johnson & Johnson (JNJ) Financial Performance
Revenue: A Business Reshaped by Segment, Not Just Scale
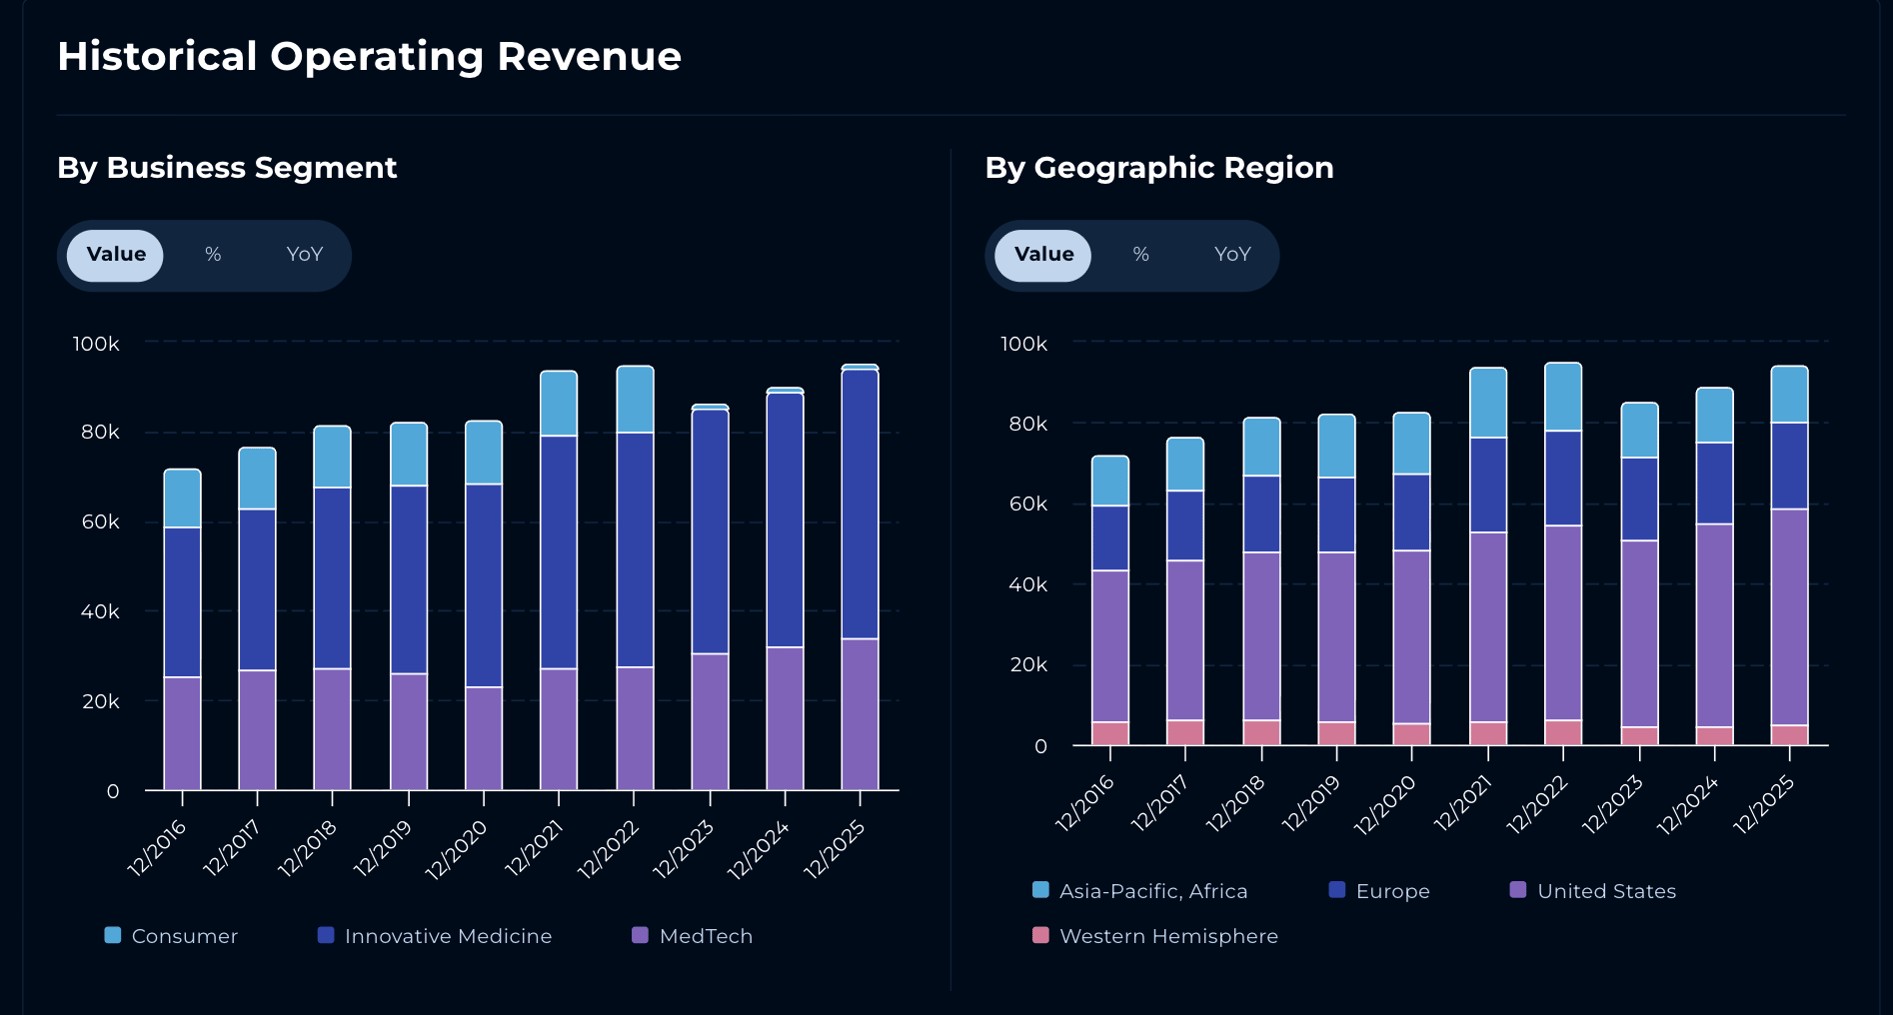
JNJ Historical Operating Revenue by Segment and Region — Powered by StockOracle™ Accurate as of 31 July 2026
Full-year 2025 revenue came in at $94.19 billion, and the current run-rate is accelerating: second-quarter 2026 revenue rose 6.6% year-over-year to $25.31 billion, beating consensus, with management now guiding to roughly $101.1 billion for the full year. Innovative Medicine did the heavy lifting, up 7.8% to $16.38 billion, while MedTech grew a steadier 4.5% to $8.93 billion.
The geographic mix also shows international sales now outpacing the U.S. business as emerging-market healthcare spending scales.
Free Cash Flow: The Line the JNJ DCF Actually Runs On
Topline growth is the headline. Free cash flow is the receipt. J&J converts roughly $23 billion in trailing free cash flow, a figure implied by the platform's 3.62% FCF yield which works out to a free cash flow margin in the low-to-mid 20% range on trailing revenue. That's a materially higher conversion rate than most industrial or retail businesses post.
Returns on Capital: A Business Compounding Efficiently
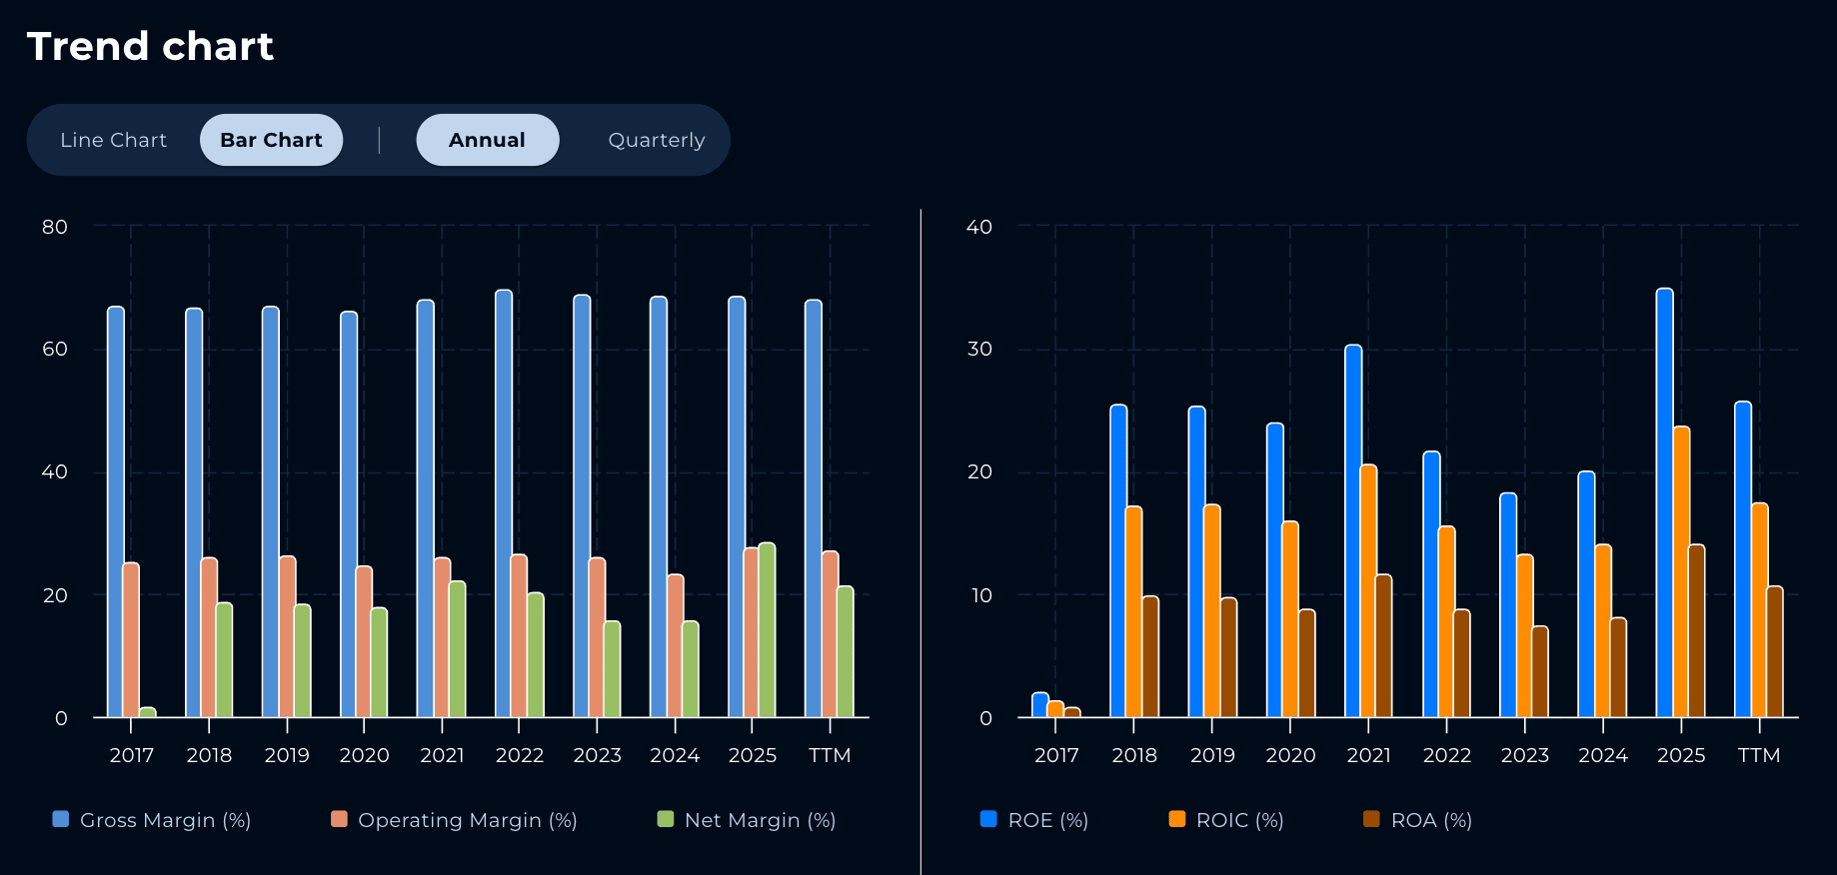
Margins and Returns Trend Chart — Powered by StockOracle™ Accurate as of 31 July 2026
Return on equity, ROIC, and ROA have all trended upward over the past decade, with ROE currently at 25.74% and ROIC at 17.53% on a trailing basis, both comfortably above J&J's cost of capital. 2025 shows a sharp spike in reported net income and ROE, which looks tied to one-off items layered on top of steady operating growth.
Balance Sheet: Debt Financing a Broader Pipeline
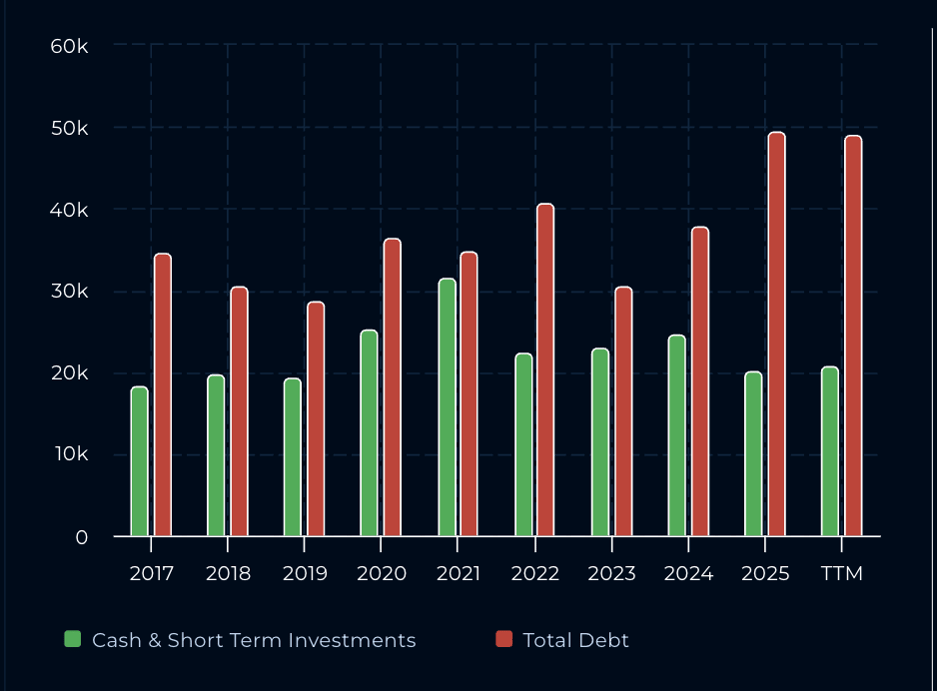
Cash & Short-Term Investments vs. Total Debt — Powered by StockOracle™ Accurate as of 31 July 2026
Total debt has climbed from roughly $34 billion in 2017 to around $48–49 billion on a trailing basis, while cash and short-term investments have stayed comparatively thin by comparison. That widening gap lines up with an active period of dealmaking and the $5.5 billion talc settlement cash outlay has yet to flow through a future quarter's balance sheet.
Shareholder Returns: A Shrinking Share Count
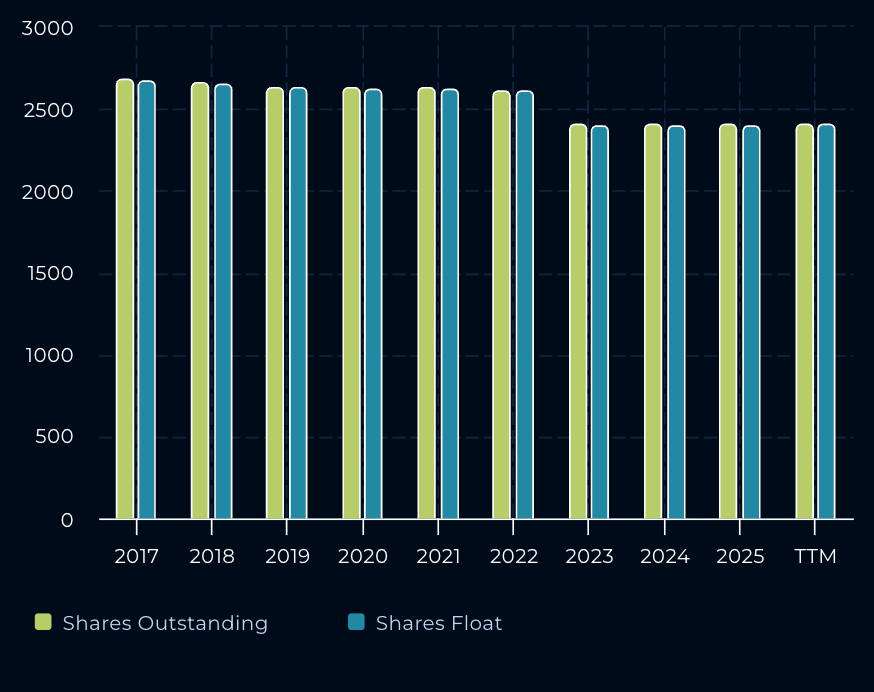
Shares outstanding have declined from roughly 2.65 billion in 2017 to about 2.38 billion on a trailing basis, the multi-year result of an ongoing buyback program. Each remaining share now owns a slightly larger slice of J&J's cash flow and earnings, a modest but steady tailwind to per-share intrinsic value, independent of anything happening in the underlying business.
Dividend & Intrinsic Value
J&J’s dividend is worth naming upfront: J&J's 60.73% dividend payout ratio (on an earnings basis) is a capital-allocation choice, but it does mean less of that ~$23 billion in free cash flow is available for the reinvestment the DCF-based scenarios assume.
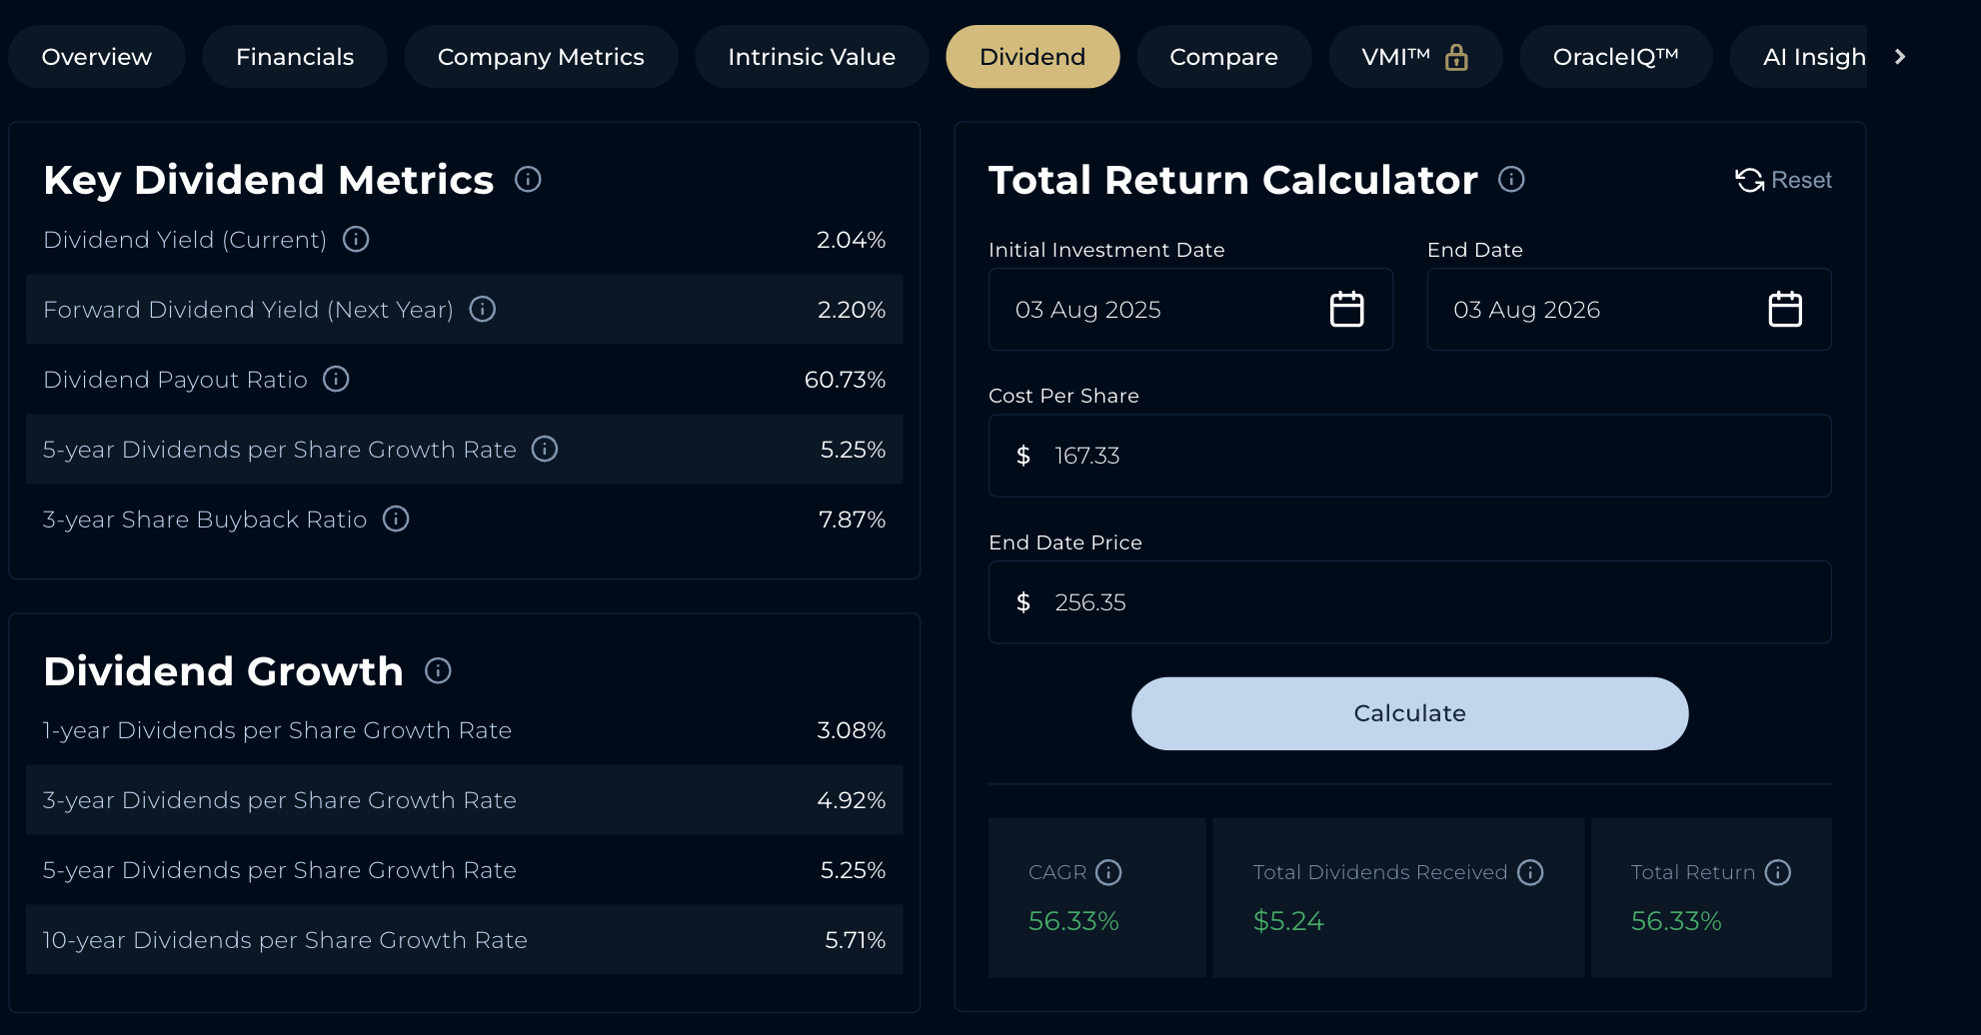
Judged on a free cash flow basis rather than earnings, the picture is a little more comfortable: trailing dividends paid (roughly $5.24 per share across ~2.38 billion shares, or about $12–13 billion) work out to a FCF payout ratio in the low-to-mid 50% range, tighter coverage than the headline 60.73% earnings-based ratio suggests, but still leaves meaningful room.
J&J has raised its dividend for 55 consecutive years, a Dividend King track record spanning multiple recessions. That streak is a record of capital-return discipline.
Total return for a J&J shareholder over the trailing year comes to 58.47% — made up of price appreciation, a 1.97% current dividend yield (2.20% forward), and 5.25% five-year dividend growth.
Johnson & Johnson (JNJ) Growth Catalysts
Innovative Medicine: Oncology and Immunology Doing the Heavy Lifting
- TREMFYA revenue hit $2 billion in Q2 2026, up 72.5% year-over-year, ahead of analyst estimates
- CARVYKTI (cell therapy) revenue rose 62.1% year-over-year in Q1 2026, with DARZALEX also contributing to oncology growth
- Recent approvals (ICOTYDE, VARIPULSE Pro) continue expanding the oncology and cardiovascular pipeline
- STELARA's biosimilar-driven decline (down nearly 60% in Q1 2026) is being offset, not masked, by these newer franchises
MedTech and New Platforms
- Abiomed grew 16.3%, Shockwave 18.5%, and electrophysiology 12.6% in Q1 2026
- OTTAVA, J&J's new robotic surgical system, received FDA marketing authorization in July 2026 — J&J's formal entry into a category it has never directly competed in before
- The Firefly Bio acquisition (~$1 billion, completed July 2026) and a new Sail Biomedical partnership add oncology-adjacent capabilities, with management flagging roughly $1.36 of 2027 adjusted EPS dilution from the combined impact
Economic Moat: Why StockOracle™ Rates J&J Wide
A moat only matters if it holds up against specific, well-funded rivals and J&J's is being tested from multiple directions at once. In pharmaceuticals, AbbVie carries its own embedded advantage in immunology: the commercial infrastructure and payer relationships built around Humira, now redeployed behind Skyrizi and Rinvoq. Pfizer leans on vaccine manufacturing scale and hospital-system relationships forged during the pandemic. In MedTech, Medtronic and Stryker hold entrenched device-rep relationships inside operating rooms that took decades to build.
None of these are direct substitutes for J&J's combination. A business that spans oncology, immunology, cardiovascular devices, and neuroscience all under one balance sheet, funding R&D across therapeutic areas that would sink a single-focus competitor in a bad year. That breadth is J&J's moat that creates a resilient business than narrower rivals.
Building Your Own JNJ DCF: What Has to Go Right
When a stock trades at a premium to most of the fair-value estimates a model produces, the productive exercise now becomes: "what has to be true to justify this price?"

StockOracle™ enables you to stress-test these assumptions yourself through a customizable intrinsic value calculator. Compare other pharmaceutical and healthcare companies' intrinsic value against their current price with a free StockOracle™ trial.
Final Thoughts on Johnson & Johnson's Intrinsic Value
The market isn't debating if Johnson & Johnson is a well-run company. What's still open for argument is whether a 30.8x earnings multiple is the right price for a business whose growth still depends on out-running patent expirations franchise by franchise. If TREMFYA, CARVYKTI, and OTTAVA keep compounding at their current pace, StockOracle™'s more optimistic scenarios have room to move higher; if STELARA-style erosion shows up in a newer franchise before the pipeline is ready, the gap between price and OracleValue™ closes from the other direction.
This analysis is shared for educational purposes and is not intended as financial advice or a recommendation on any investment. OracleValue™ is an estimate and should not be taken as a signal to buy or sell. Any past performance mentioned is not indicative of future results.
Related
Home Depot trades at 21.95 times trailing earnings, a multiple that assumes the growth engine ...

Philip Morris International posted its first $11.2 billion revenue quarter, with organic growth ...
Lam Research stock has surged more than 90% this year, outrunning nearly every semiconductor peer, ...