By Piranha Profits Team
Last updated on August 03, 2026
Visa closed the book on another expectedly strong quarter and the market barely blinked.
On 28 July 2026, Visa reported fiscal Q3 2026 net revenue of $11.6 billion, up 14% year-over-year, with non-GAAP EPS of $3.32 (beating estimates by $0.09) and GAAP EPS of $2.97, up 10%.
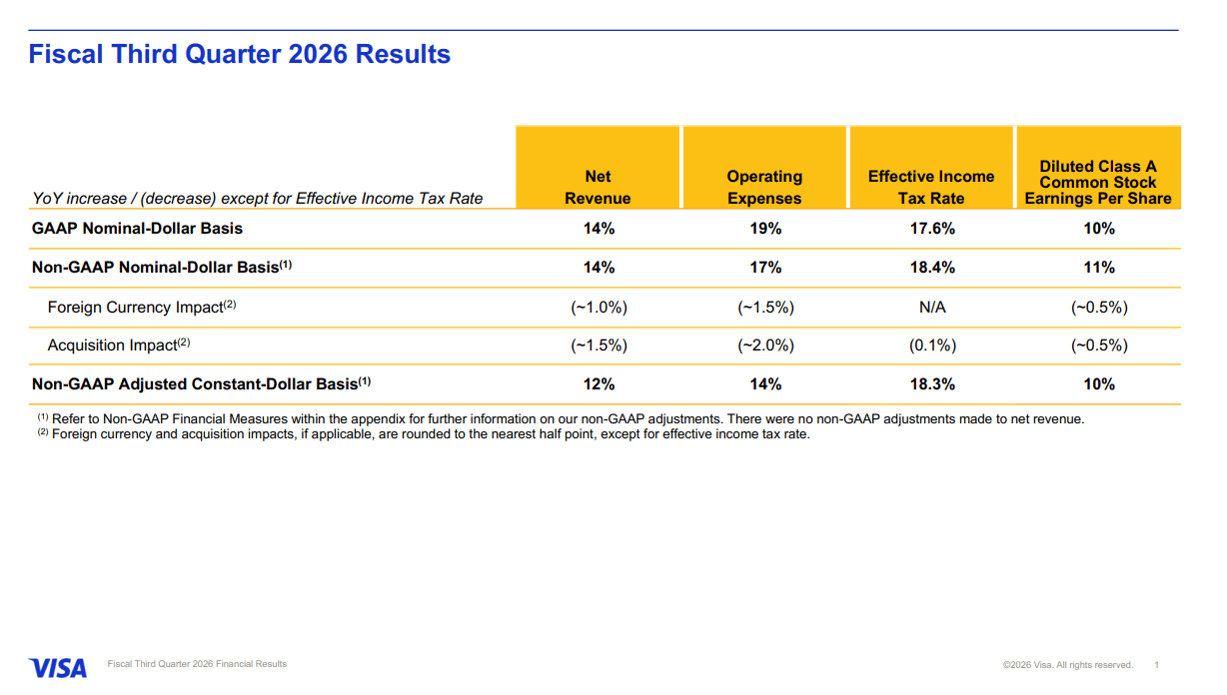
Payments volume grew 10%, total cross-border volume climbed 13%, and processed transactions rose 10%. CEO Ryan McInerney called it "a strong fiscal third quarter," pointing to resilient consumer and business spending across "consumer payments, commercial and money movement solutions and value-added services."
The stock, already sitting near the top of its 1-year range, absorbed the beat without much drama. With growth this consistent already priced in, what is Visa actually worth?
What Is Visa's Intrinsic Value?
Intrinsic value is an estimate of what a business is really worth based on the cash it can generate over its lifetime, independent of what the market happens to be paying for it on any given day.
StockOracle™'s Intrinsic Value Estimate for Visa
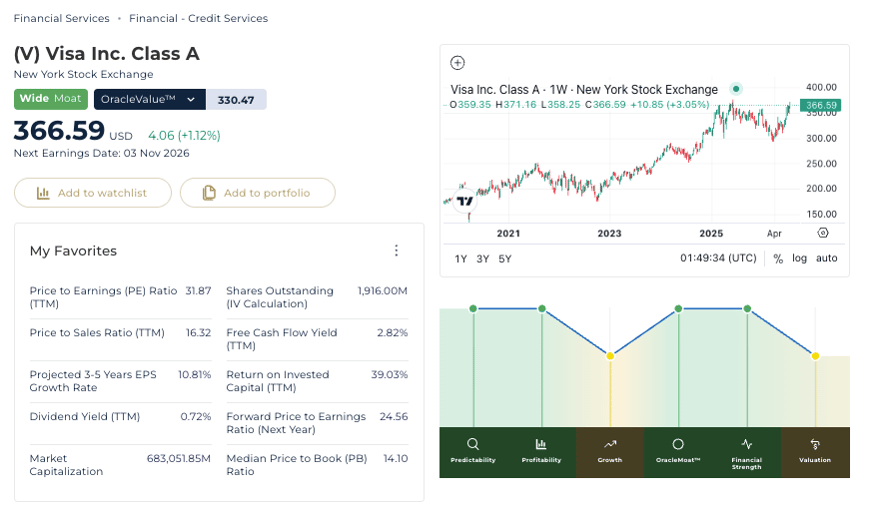
Running Visa through StockOracle™'s valuation model, OracleValue™ estimated it at $330.47 per share, alongside a Wide Moat rating.
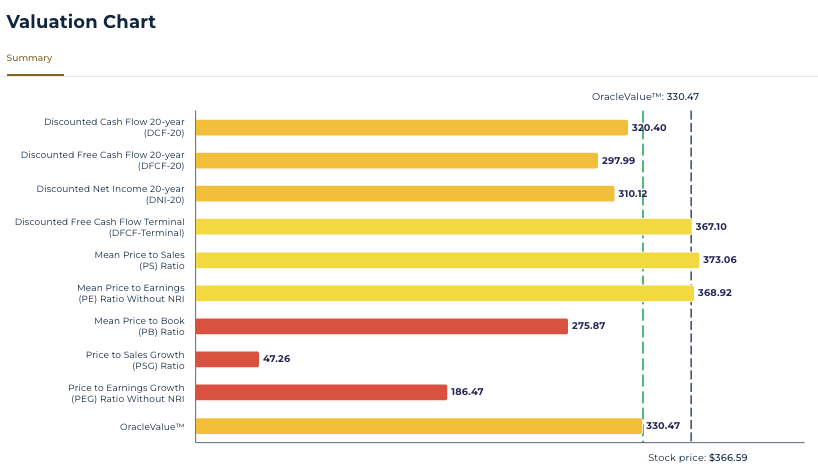
OracleValue™ intrinsic value calculation for Visa (V) — Powered by StockOracle™ Accurate as of 29th July 2026
The individual models tell a more detailed story. The cash-flow-based methods cluster tightly. DCF-20 at $320.40, DFCF-20 at $297.99, DNI-20 at $310.12 while the terminal free cash flow model runs higher at $367.10.
The multiple-based comparisons are more scattered: mean P/S ($373.06) and mean P/E ($368.92) sit well above the cash-flow cluster, while mean P/B lands far lower at $275.87.
This gap is typically found in asset-light, high-return network businesses like Visa. That doesn't really need much book capital to generate its cash flows.
Revenue: Broad-Based, Not Reliant on One Region
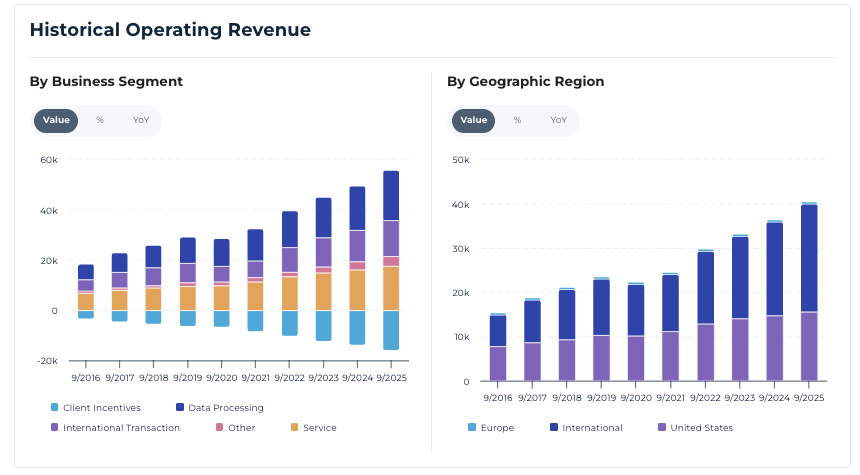
Visa's historical operating revenue by segment and by geography — Powered by StockOracle™
Visa's revenue is built on five lines. Service, data processing, international transaction, value-added services, and other, net of client incentives. Every one of them has trended higher over the past decade. Geographically, the U.S. and international segments have grown roughly in step with each other. That diversification matters for durability: a slowdown in any single market is a dent, not a major crisis.
Free Cash Flow: The Number That Actually Funds Buybacks and Dividends
Topline growth is the headline. Free cash flow is the receipt.
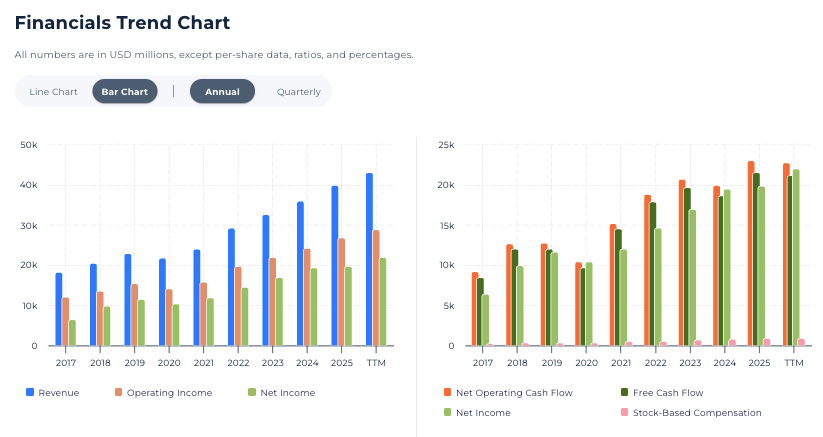
Operating cash flow and free cash flow trend — Powered by StockOracle™ accurate as of 29th July 2026.
Visa generated $6.8 billion in operating cash flow in fiscal Q1 2026 alone, and $9.79 billion over the first six months of the fiscal year. That cash is what funded $11.7 billion in share buybacks and $2.6 billion in dividends in the same six-month window. Capital returned to shareholders without touching the balance sheet's flexibility. Visa's TTM free cash flow yield sits at 2.82%, modest on its face, but it's a yield sitting on top of a business still compounding double-digit growth.
Returns on Capital: The Moat Showing Up in the Numbers
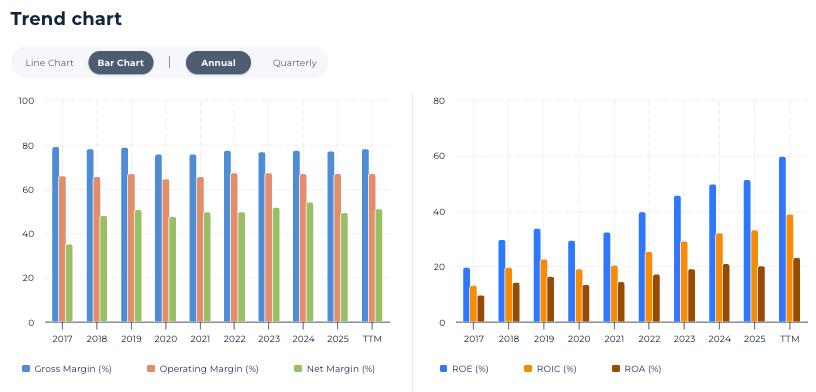
Visa's TTM return on invested capital is 39.03%, and the broader returns picture. ROE, ROA, and ROIC together have trended upward for most of the past decade. It's what it looks like when a network business scales revenue faster than it scales the capital required to run it.
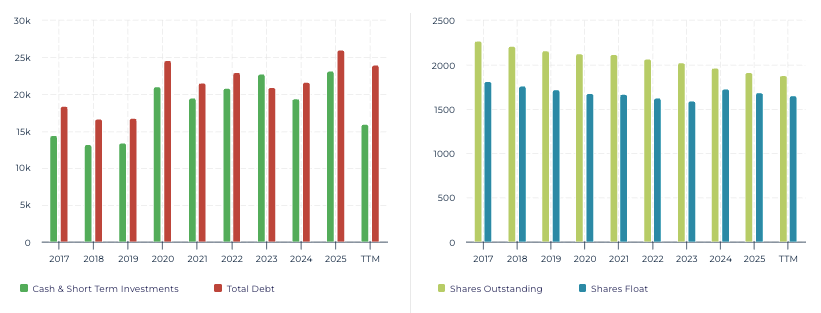 Each buyback also does quiet work here: with 1,916 million shares outstanding used in the IV calculation and a shrinking float over time, every remaining share owns a slightly larger claim on that cash flow.
Balance Sheet: Leverage Down, Debt-Servicing Capacity Up
Two ratios worth separating here. Visa's cash ratio (0.55 current vs. a 0.93 five-year average) and current ratio (1.09 vs. 1.40) have both drifted down. This means there is less cash sitting idle, consistent with a company prioritizing buybacks over building a larger cash pile.
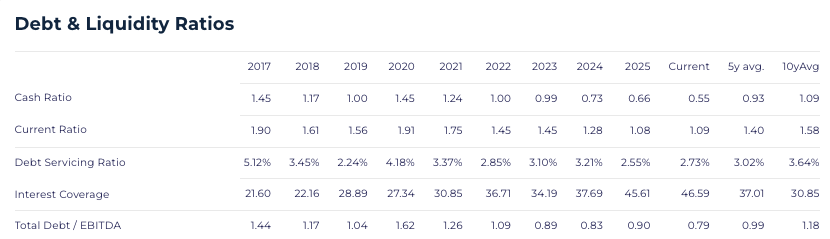
But the ratios that measure whether Visa can comfortably service its debt have moved the other way: interest coverage has climbed to 46.59x (from a 10-year average of 30.85x), and total debt/EBITDA has fallen to 0.79x (from 1.18x). Read together, Visa is running a tighter cash position but a stronger earnings base underneath its debt, a typical sign of confidence in cash generation from management.
Growth Catalysts: Beyond the Core Swipe
Visa's core network is still growing, but we should not overlook their newer lines:
Value-added services revenue grew roughly 28% year-over-year. Commercial and money movement solutions grew around 20% over the same period.
Visa as a Service (VaaS), built on the Pismo issuer-processing acquisition, has landed early commercial wins in Chile and New Zealand. A cloud-native push into issuer processing that didn't exist in Visa's model a few years ago.
Visa has issued over 17.5 billion tokens globally as it expands digital credentials and stablecoin capabilities, positioning the network for mobile wallets and digital-currency settlement rather than just card-present transactions.
Lastly, cross-border activity remains a genuine tailwind: fiscal Q3 2026 cross-border volume grew 13% overall (12% excluding intra-Europe), consistent with the 10-12% cross-border e-commerce and travel growth seen earlier in the fiscal year.
These are the lines that matter most for growth centric intrinsic value models.
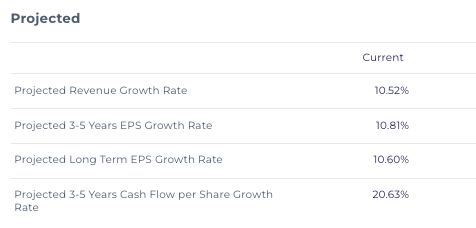
Projected 3-5 year EPS growth sits at 10.81%, long-term EPS growth at 10.60%, and 3-5 year cash-flow-per-share growth at a notably higher 20.63% a gap that projects operating leverage and buybacks doing real work on a per-share basis, above and beyond top-line growth alone.
The Bull Case of Visa
- Scale and financial strength. Visa's network processed close to $4 trillion in payments and 69 billion transactions in Q1 FY2026 alone, with roughly 50% market share outside China — backed by $6.8 billion in Q1 operating cash flow.
- High-growth, higher-margin services. Value-added services (+28% YoY) and commercial/money movement solutions (+20% YoY) are diversifying revenue away from pure transaction-swipe economics.
- Tokenization and digital-credential leadership. Over 17.5 billion tokens issued positions Visa for mobile wallets, IoT commerce, and stablecoin-based settlement.
- Disciplined capital return. $11.7 billion in buybacks and $2.6 billion in dividends in H1 FY2026, funded entirely by cash flow.
- Secular payments tailwinds. Cross-border e-commerce and travel volume continue to outgrow the broader economy.
- Operational reliability. VisaNet can process up to 100 billion computations per second across secure, distributed data centers.
- Network effects and brand equity. More merchants accepting Visa attracts more cardholders, and vice versa — a reinforcing loop that's difficult for a new entrant to break.
The Bear Case of Visa
- Regulatory pressure on interchange economics. Legislation like the Credit Card Competition Act could cap interchange fees or curb rewards programs, directly pressuring Visa's take rate.
- Disintermediation risk. Blockchain-based rails, central bank digital currencies, and fintech payment infrastructure could route volume around card networks over time.
- Fintech and Big Tech competition. Embedded finance and digital wallets from large tech platforms could chip away at Visa's relevance, particularly with younger consumers.
- Execution risk in new lines. Issuer processing, stablecoins, and advisory services are still being scaled, success isn't guaranteed just because the initial data points look good.
- Geopolitical fragmentation. Nationalistic payment-schemes in some markets could limit Visa's global network reach over the long run.
- Macro sensitivity. A global slowdown, sustained inflation, or a shift back toward cash would weigh on payments volume and cross-border activity.
- Antitrust scrutiny. Visa's scale invites regulatory attention that could eventually result in structural remedies.
A Conservative, Do-It-Yourself DCF
Visa's own StockOracle™ figures give a useful starting point for investors who want to stress-test the number themselves rather than take OracleValue™ at face value.

A more conservative investor might trim the long-term EPS growth assumption down further, or discount the 20.63% cash-flow-per-share growth rate to account for execution risk. Doing so would pull the estimate closer to or below the DFCF-20 figure, which is effectively what a skeptic betting only on Visa's core network, and none of the newer growth lines, would land on.
Investors who want to run these scenarios themselves, adjust the growth and discount-rate assumptions, and compare the output against other payments and financial-services names can do so with a free StockOracle™ trial.
Final Thoughts on Visa's Intrinsic Value
Visa's fiscal Q3 2026 results beat estimates and they reinforced the same durable characteristics that show up across its financials: broad-based revenue growth, expanding higher-margin service lines, a Wide Moat rating, and cash flow strong enough to fund double-digit buybacks and dividends simultaneously.
None of this guarantees nor predicts where Visa's stock trades next and how the market will reward or punish “boring” business like Visa. Regulatory outcomes, fintech competition, and macro conditions are all still genuine variables. If however, value-added services growth, tokenization adoption, and VaaS wins continue on their current trajectory, the cash-flow base that carries Visa's strong intrinsic value will still have room to compound further.
Related

Home Depot trades at 21.95 times trailing earnings, a multiple that assumes the growth engine ...

Philip Morris International posted its first $11.2 billion revenue quarter, with organic growth ...

Lam Research stock has surged more than 90% this year, outrunning nearly every semiconductor peer, ...