By Piranha Profits Team
Last updated on June 26, 2026
The Magnificent 7. Apple, Microsoft, Alphabet, Amazon, Nvidia, Meta, and Tesla usually get talked about as one trade. They dominate the major indices, they’re all pouring billions into AI, and they tend to move together on the same macro headlines.
For a lot of investors, owning “big tech” has effectively meant owning these seven.
So how are they priced now?.. let's start with three numbers that travel well together: the Price to OracleValue™ ratio (today’s price divided by StockOracle™’s intrinsic-value estimate), the PE ratio (price relative to trailing earnings), and the PEG ratio (PE adjusted for expected growth).
None should be seen as a verdict on its own.

Magnificent 7 valuation comparison Powered by StockOracle™ (June 25, 2026)
Reading it top to bottom: Meta and Microsoft are both trading below their OracleValue™ estimates with PEs in the low 20s and PEGs near 1. Nvidia is the standout on growth-adjusted value, the lowest PEG in the group (0.71) despite the highest projected growth (43.10%), with a price still slightly under its OracleValue™ estimate.
Amazon sits almost exactly on its estimate. At the expensive end, Alphabet and Apple trade above OracleValue™, and Tesla sits furthest above a 348x trailing PE and a PEG above 8 puts it in a category of its own.
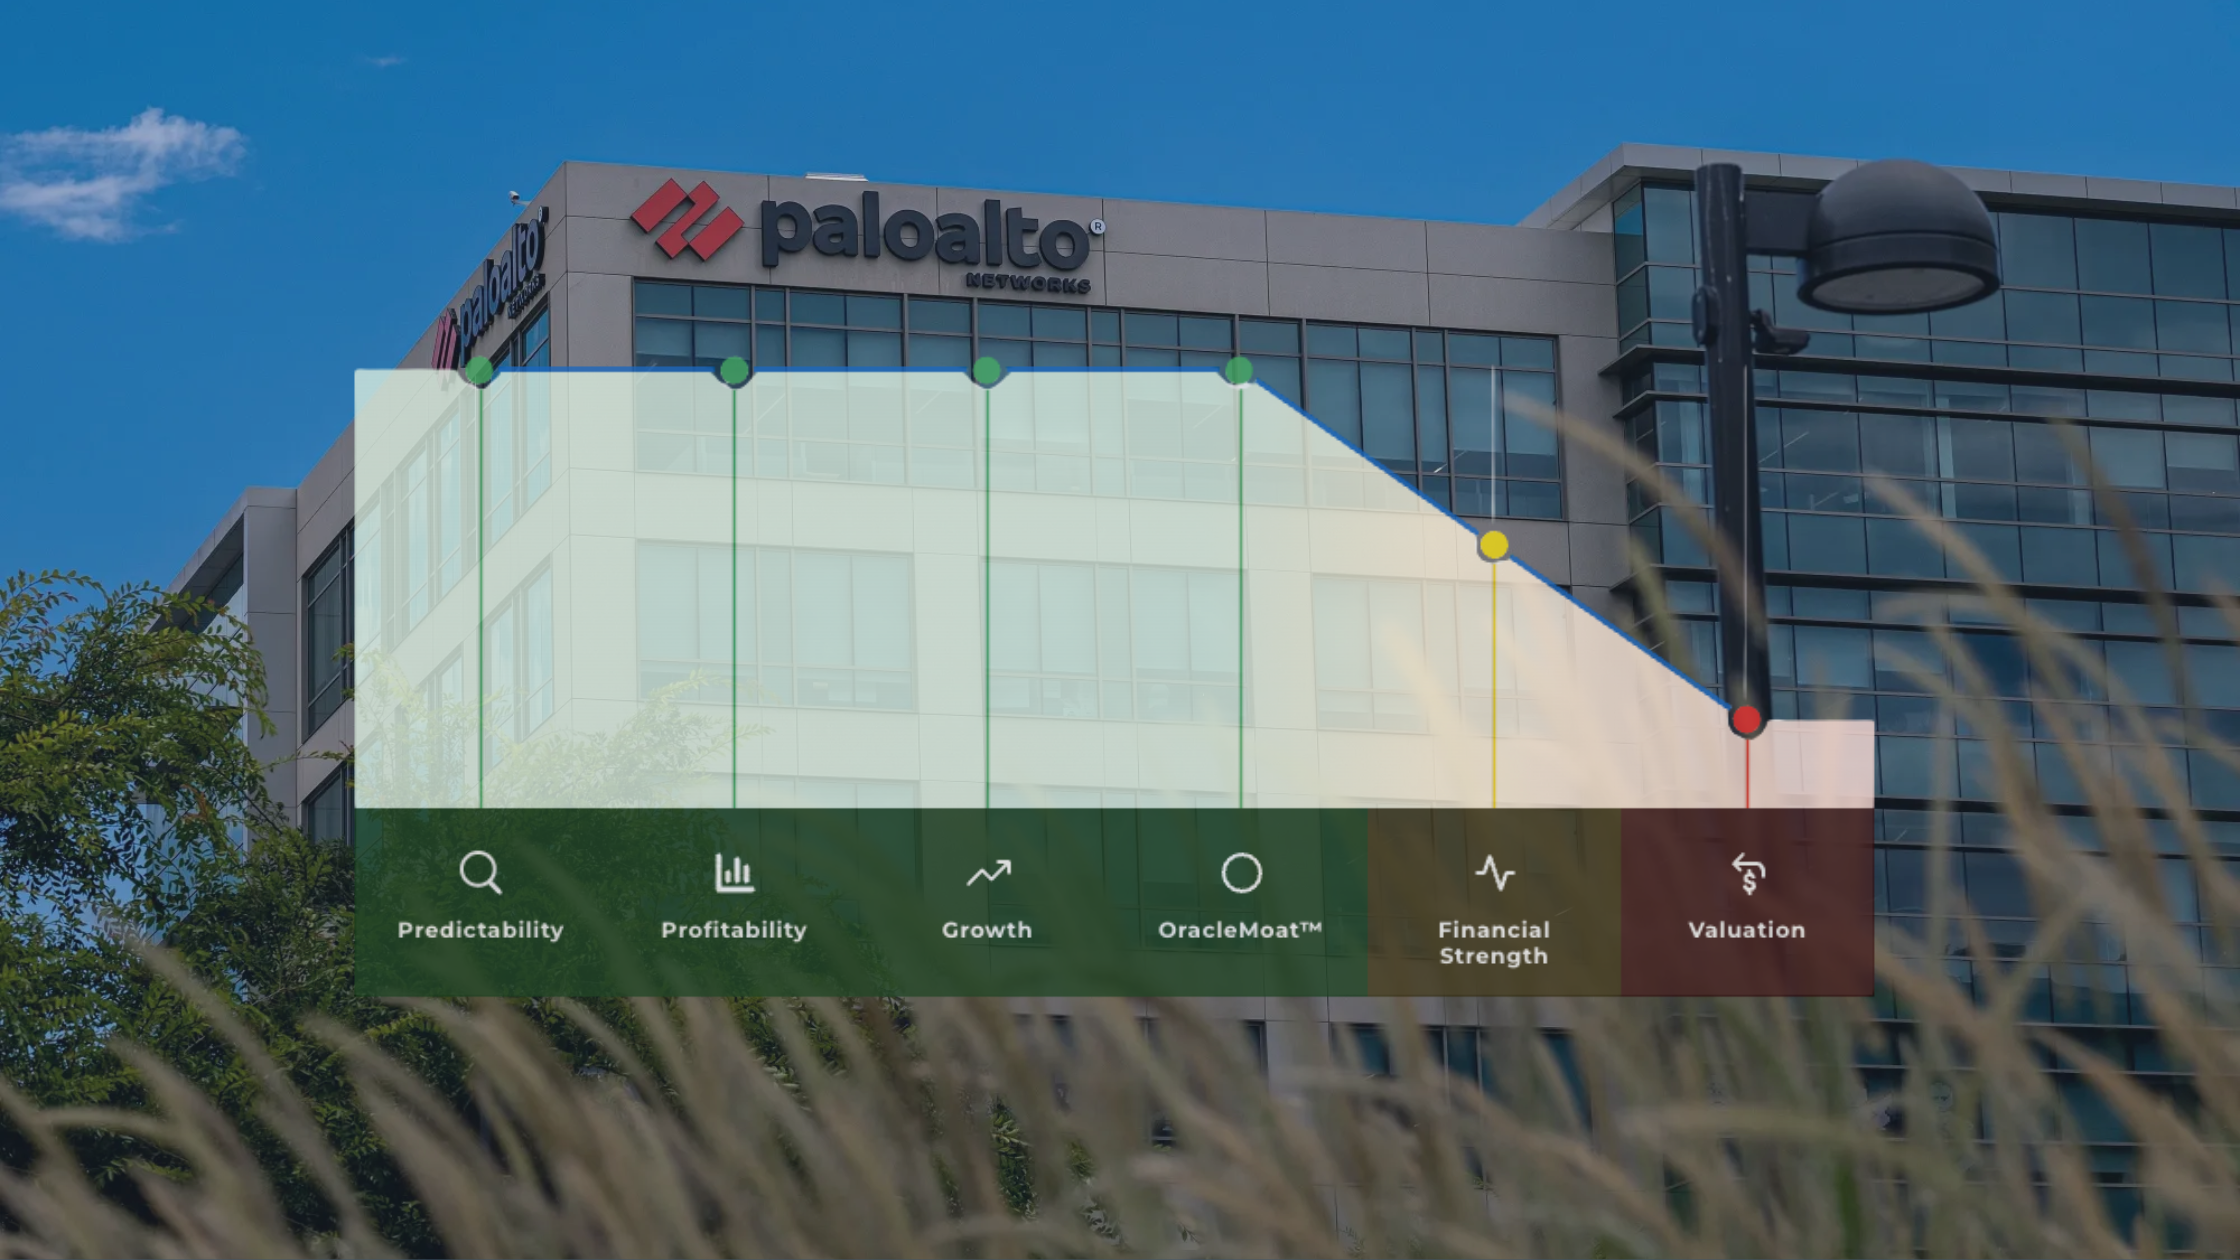
What OracleIQ™ Reveals About the MAG7

Magnificent 7 OracleIQ™ Powered by StockOracle™ (June 25, 2026)
OracleIQ™ scores each company across six dimensions. Predictability, Profitability, Growth, OracleMoat™, Financial Strength, and Valuation. Viewed side by side, a clear pattern emerges.
Two dimensions are strong in all the magnificent seven. Financial Strength and Profitability. Suggesting that they are all businesses that are generating steady cash and have strong balance sheets to support their growth.
Where the group diverges is on Growth and Valuation.
Apple scores the weakest on Growth, a gap that stands out against peers that have tied their narratives more directly to the AI boom.
Valuation tells a more varied story: Meta and Microsoft come in green, Nvidia and Amazon sit at amber, Alphabet and Apple slip to orange, and Tesla sits alone in the red given its extreme multiples .

Meta Platforms (META)

Meta Platforms (META) first-load dashboard — Powered by StockOracle™(June 25, 2026)
Meta carries the lowest Price to OracleValue™ in the group: a price of 557.67 against an OracleValue™ estimate of 905.68.
A five-year average gross margin near 81%, net margin around 30%, and ROIC of 25.18%.
Its only soft spot on OracleIQ™ is Growth, which reads amber against a projected 19.15% EPS growth rate. A PE of 20.44 and a forward PE under 16 make it one of the cheaper names on earnings, too.
The open question is whether its advertising dominance and AI investments can sustain the growth the model assumes.
On top of that are two ongoing market concerns: regulatory exposure, and Meta's track record of betting big on projects that have yet to prove themselves. The metaverse, Ray-Ban Meta glasses and even building a prediction market app (“arena”) being the most visible and recent examples.
Microsoft (MSFT)

Microsoft (MSFT) first-load dashboard — Powered by StockOracle™(June 25, 2026)
Microsoft is trading at a price of 365.46 against an OracleValue™ of 553.78, the second-lowest ratio in the group.
Underneath, the business is still pretty solid. Net margin near 36%, ROIC of 26.72%, a Wide Moat, and strong financial strength. Growth reads amber on a projected 19.58% EPS rate. The tension for investors is whether the AI and cloud spend converts into the durable growth the estimate assumes.
The deeper question is whether its OpenAI investment will ultimately translate into returns. More immediately, a recent Xbox console price hike was attributed to rising component costs. Triggered a short-term selloff, adding some near-term noise.
Nvidia (NVDA)

NVIDIA (NVDA) first-load dashboard — Powered by StockOracle™(June 25, 2026)
Nvidia is the growth engine of the group, and the numbers show it: a projected 43.10% EPS growth rate, a 66.90% five-year revenue growth rate, and an extraordinary ROIC of 106.18%.
Its price of 199 sits just under its OracleValue™ of 218.91, and its PEG of 0.71 is the only sub-1 reading in the cohort.
Suggesting that the market may not have fully priced in that growth. On OracleIQ™, it’s green across the board except Valuation, which steps down to amber. The entire bull-bear debate on Nvidia comes down to whether AI data-centre capex keeps flowing at the pace baked into that growth rate.
It’s the toll booth on the AI build-out for as long as the build-out continues.
Amazon (AMZN) 
Amazon (AMZN) first-load dashboard — Powered by StockOracle™(June 25, 2026)
Amazon sits almost exactly on its OracleValue™ estimate. The figure that jumps out looks alarming until you read it in context: a trailing free-cash-flow margin of -0.33%.
That negative reading reflects Amazon's reinvestment philosophy. Enormous capital being deployed into AI and logistics infrastructure may not paint Amazon as a business in trouble.
Net margin sits at a thin-but-positive 6.40%, with ROIC at 16.65%. OracleIQ™ reads amber on both Growth and Valuation. The main question for Amazon is whether its aggressive capex cycle eventually converts into the free cash flow that valuation models are built on.
Alphabet (GOOGL) 
Alphabet (GOOGL) first-load dashboard — Powered by StockOracle™(June 25, 2026)
Alphabet trades above its OracleValue™ estimates of 345.29 against 298.27. It’s a high-quality business on every OracleIQ™ measure except the two that separate this group: Growth reads amber and Valuation orange.
The fundamentals are strong, ROIC of 34.05%, net margin around 27%, a Wide Moat. But its projected EPS growth of 17.43% is among the more modest in the cohort, and a PEG of 1.51 reflects a price that has moved ahead of that growth.
Apple (AAPL)

Apple (AAPL) first-load dashboard — Powered by StockOracle™(June 25, 2026)
Apple is the most expensive of the Wide-Moat names relative to its OracleValue™ estimates of 293.08 against 240.52. And it carries the lowest growth profile in the entire group.
Projected EPS growth of 11.44% and five-year revenue growth of just 8.71% are the data behind the “Apple has stopped innovating” narrative, and OracleIQ™ marks both its Growth and Valuation dimensions down.
None of that means the business is weak. ROIC of 75.14% and a Wide Moat confirm an exceptional franchise. But with a PE of 35.60 and a PEG above 3, the market is paying a premium multiple for what increasingly screens as a stable, cash-generative compounder rather than a fast grower.
The assumption being tested is whether Services and a new product cycle can reaccelerate growth enough to support the price.

A recent price increase across its product lineup triggered a similar selloff . Though the real verdict won't come until earnings. The question worth asking is whether Apple, as a consumer hardware giant, has enough pricing power to push prices higher without sacrificing volume.
Tesla (TSLA) 
Tesla (TSLA) first-load dashboard — Powered by StockOracle™(June 25, 2026)
Tesla is the outlier on almost every axis. It’s the only Narrow Moat in the group, it trades furthest above its OracleValue™ estimate (375.53 against 275.30), and it carries a trailing PE of 348.63 with a PEG above 8.
Its OracleIQ™ profile is the choppiest. Amber on Predictability, Growth, and Moat, and red on Valuation. The paradox is that Tesla also posts the second-highest projected EPS growth (40.39%) yet the lowest ROIC in the cohort at 4.24%. The market is valuing Tesla less on current fundamentals and more on a belief about future businesses that the financials don’t yet reflect.
Final Thoughts on the MAG7’s Valuation
The Magnificent 7 shares a theme, an index weighting, and a balance-sheet strength that lets all seven fund the AI race from cash flow. What they no longer share is a price.
So here’s the question worth sitting with. If all seven carry similar financial strength and (mostly) wide moats, then the gap between a 0.62 and a 1.36 comes down almost entirely to what the market believes about each company’s future growth and how much it will pay today for that belief.