By Piranha Profits Team
Last updated on August 03, 2026
What Is ExxonMobil's Intrinsic Value?
Intrinsic value is what a business is actually worth based on the cash flows and earnings power it can sustain over time, not what the market happens to pay for it on any given day. For an oil and gas major, that question carries an extra important thought: the "cash flows it can sustain" found in most intrinsic value models depend heavily on a commodity ExxonMobil doesn't set.
ExxonMobil's Intrinsic Value: What the Model Says
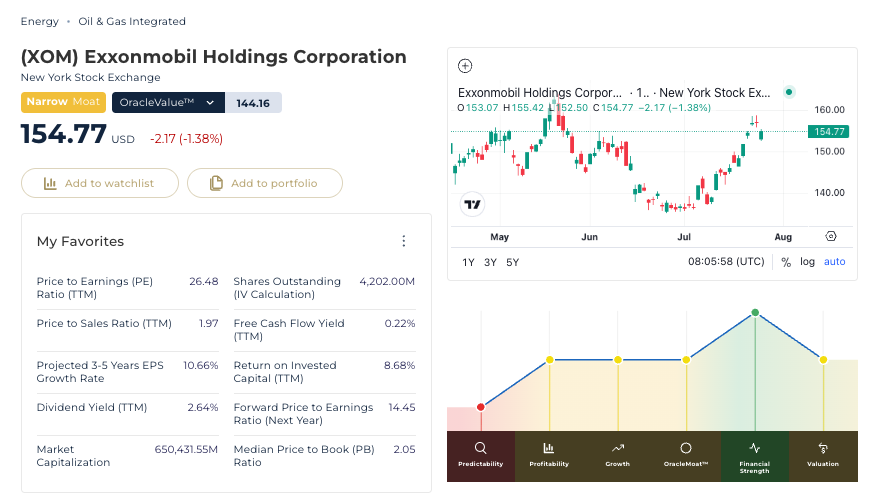
XOM Price & OracleValue™ Overview — Powered by StockOracle™ Accurate as of 28 July 2026
Using its proprietary model, StockOracle™ estimates ExxonMobil's intrinsic value at $144.16 per share.
ExxonMobil currently trades around 26.5x trailing earnings but just 14.5x next year's consensus estimate, it's a gap consistent with a business set up for a much easier earnings comparison than it faced a year ago, given how much of last year's results were still working through a lower oil-price environment.
Valuation Chart — Model Breakdown
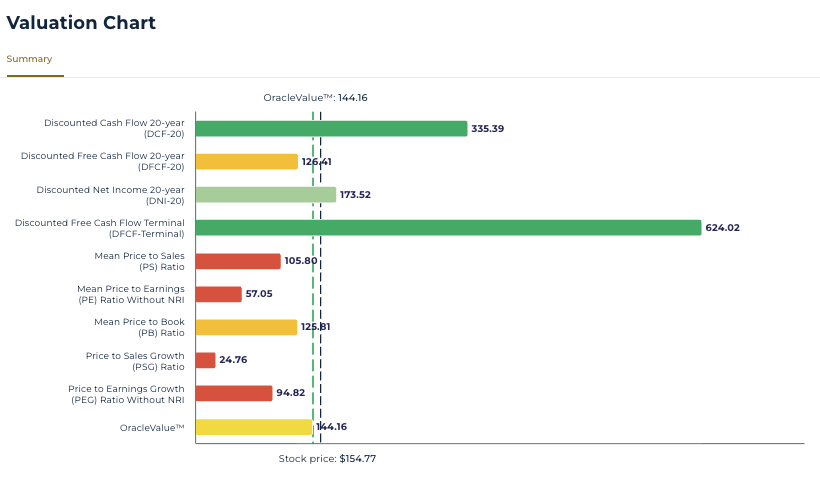
Valuation Chart — Model Breakdown — Powered by StockOracle™ Accurate as of 28 July 2026
On the earnings and terminal-growth side, the 20-year discounted cash flow method values ExxonMobil near $335 per share. On the pure free-cash-flow side, the 20-year discounted free cash flow method lands at just over $126, while the ratio-based methods (price-to-sales, price-to-earnings, PEG) cluster far lower still, in the $25–$105 range.
It is what happens when the same barrel of oil gets valued through a growth lens and a cash lens at the same time. The growth-oriented methods assume today's earnings power compounds forward for two decades; the cash and ratio-based methods are pricing what ExxonMobil throws off right now.
OracleValue™'s estimates of $144.16 sits closer to the cash-based cluster than the earnings-based one, which says something about how much weight the model places on sustainable cash generation over a two-decade earnings extrapolation for a cyclical business.
ExxonMobil (XOM) Financial Performance
Revenue: A Business Segmented by Where the Barrel Goes
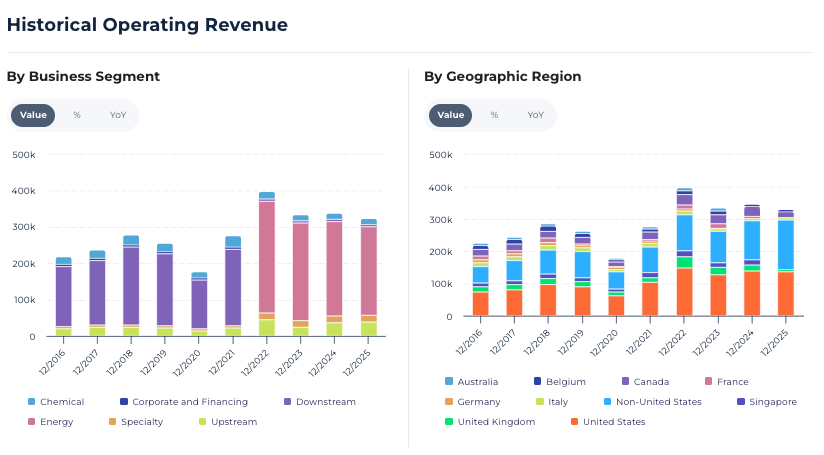
XOM Historical Operating Revenue by Segment — Powered by StockOracle™ Accurate as of 28 July 2026
ExxonMobil's revenue runs through four reporting lines. Upstream, Energy Products (refining), Chemical, and Specialty.
Reading off the trend chart: revenue held in a roughly $220–280 billion range from 2016 through 2019, cratered to around $175 billion in 2020, swung to a peak near $400 billion in 2022, then settled back to roughly $320–335 billion over the past three years.
A swing of more than 2x between trough and peak inside two years isn't a company suddenly growing and then losing its customer base. It's the same production volume multiplied by a wildly different commodity price. An integrated oil major reporting the same swing tends to be just reporting the price of crude.
Why Predictability Runs Structurally Low Here
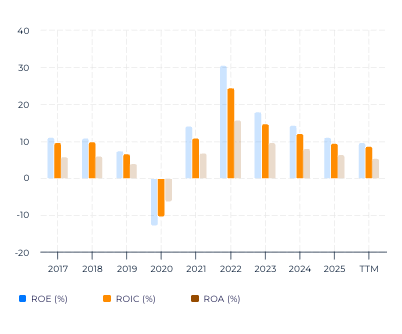
Returns Trend (ROE / ROIC / ROA) — Powered by StockOracle™ Accurate as of 28 July 2026
The predictability of XOM is worth naming directly, because it isn't a knock on ExxonMobil specifically. It's mostly true of the entire integrated oil and gas category.
Returns on equity, invested capital, and assets tell the same story as revenue.
The reason this happens sector-wide, not just here, is structural: revenue is production volume multiplied by a commodity price set in a global market ExxonMobil doesn't control, rather than a price the company sets itself.
Businesses with pricing power or recurring demand like a software subscription, a retailer with brand loyalty, can smooth their own earnings path. An oil major can optimize volume and cost, but the price side of the equation stays highly volatile. Investors pricing this stock should expect earnings and cash flow to move like a wave rather than a staircase, and that's a description of the business, not necessarily a flaw in the model.
Free Cash Flow: Where the Cycle Actually Shows Up
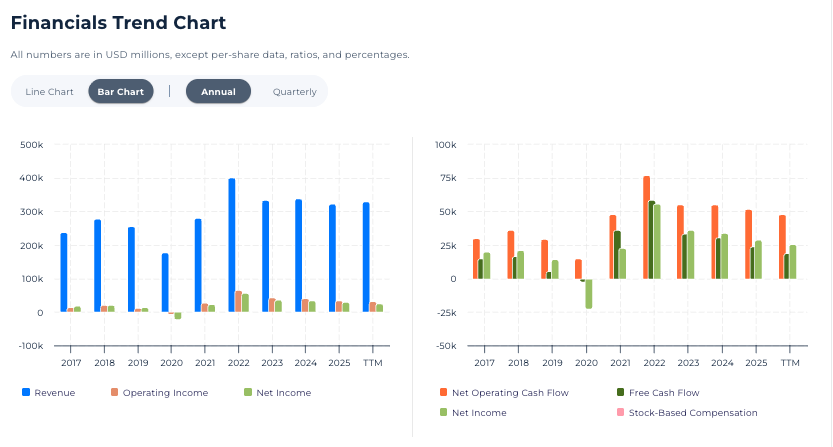
Operating Cash Flow and Free Cash Flow Chart — Powered by StockOracle™ Accurate as of 28 July 2026
Revenue tells you what a business sells. Free cash flow tells you what it actually keeps. For ExxonMobil, free cash flow moved from negative in the depths of 2020 to its highest point on record in 2022, before settling into a lower, steadier band over the past three years.
The mechanical link between free cash flow and intrinsic value matters more here than for most businesses, since the DCF and DFCF methods above disagree by nearly 5x depending on which years of cash flow the model leans on. Which is the whole argument for treating the 20-year DFCF figure, just above $126, as the more conservative, cash-grounded end of the range.
Balance Sheet: How the Cycle Gets Absorbed
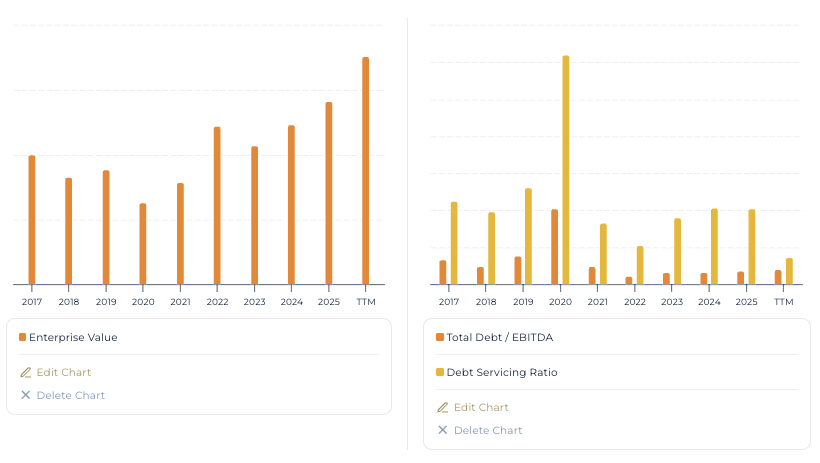
Debt Servicing Ratio and Enterprise Value — Powered by StockOracle™ Accurate as of 28 July 2026
Total debt relative to EBITDA has stayed low and stable across most of the past decade, with one exception. In 2020, the debt servicing ratio spiked to 12.43.
That single spike is the balance sheet absorbing a commodity shock, and it's the same year enterprise value dipped before resuming its climb toward the current trailing figure of roughly $705 billion.
With shares outstanding near 4.2 billion and a market cap around $650 billion, that $705 billion enterprise value reflects a meaningful net debt layer built up specifically around that 2020 period.
What is Enterprise value? : Enterprise value (EV) is a measure of a company’s total value. Calculated using market capitalisation plus total debt and equity/interest, minus cash. It roughly represents the total cost to buy the business.
ExxonMobil (XOM) Growth Catalysts
Permian scale, post-Pioneer: The 2023 all-stock acquisition of Pioneer Natural Resources roughly doubled ExxonMobil's Permian footprint. Management has guided to a cost of supply under $35 per barrel on the combined acreage — well below the Permian region's average new-well breakeven of roughly $60–69 per barrel reported by the Federal Reserve Bank of Dallas.
Guyana's Stabroek Block: Offshore production has scaled past 900,000 barrels per day, on assets with an estimated breakeven cost near $30 per barrel.
Structural cost cuts: Management has targeted a $30-per-barrel structural breakeven by 2030, on top of more than $12.7 billion in cost reductions already booked since 2019. External growth input to test: consensus analysts currently project a 10.66% five-year EPS growth rate — an outside estimate you can plug into StockOracle™'s customisable scenario tool, separate from the OracleValue™ baseline above.
Economic Moat: Why It's Narrow, Not Wide
StockOracle™ rates ExxonMobil a Narrow OracleMoat™. ExxonMobil carries real embedded advantages: integration across upstream, refining, and chemicals lets it capture margin at multiple points in the barrel's life, and its Permian and Guyana assets sit meaningfully below the region's average cost curve.
But those advantages are advantages of degree, not of kind, against its closest peers. Chevron runs a comparably efficient Permian operation and has pursued its own low-cost consolidation through the Hess acquisition; Diamondback Energy, a pure-play Permian operator, has guided to economics that hold even at $50 oil. None of ExxonMobil's rivals are locked out of the same basin, the same drilling technology, or the same capital markets.
Building Your Own DCF: What Has to Go Right
Strip out the earnings-multiple-based methods and lean on the model's most conservative cash-based estimate, the 20-year discounted free cash flow figure near $126 and the number sits below where the stock trades today.
Closing that gap without help from higher oil prices means the Permian and Guyana cost advantages above need to keep showing up specifically in the free cash flow line: continued production growth without a proportional rise in capital spending.
StockOracle™ enables this through a customisable intrinsic value calculator, letting you stress-test your own oil-price and cost assumptions. Start your free StockOracle™ trial →
Dividend & Intrinsic Value: Reading the Income Side of the Stock
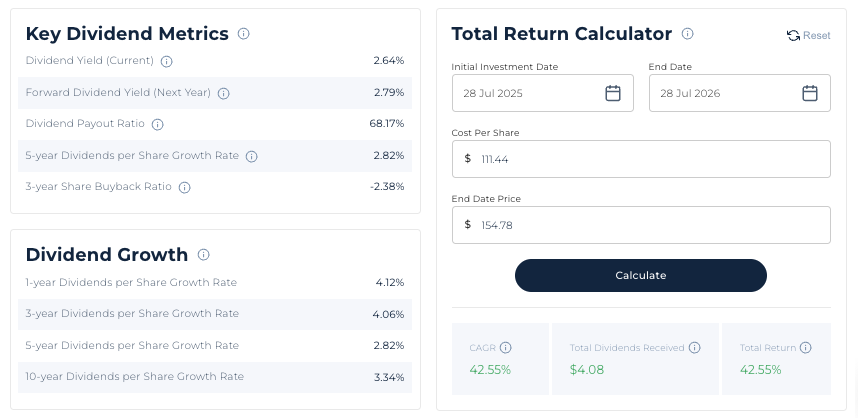
Key Dividend Metrics and Total Return Calculator — Powered by StockOracle™ Accurate as of 28 July 2026
Everything above values ExxonMobil as a compounding machine. A dividend investor may ask a different question: is the cash coming to me now, and can I count on it? For a stock with a 2.64% current yield and a payout ratio in the high 60s, that question deserves its own section rather than a single sentence buried in shareholder returns.
Why do the models disagree here? OracleValue™ and the DCF-family methods above implicitly reward cash that's retained and compounded forward. A dividend removes cash from that loop the moment it's paid. For a mature producer with a capped reinvestment runway, returning cash to shareholders rather than force-feeding it into lower-return projects can sometimes be the economically sound choice.
The dividend payout ratio above sits at 68.17%. For a capital-intensive, cyclical payer, the free-cash-flow-based version of that ratio is the tighter, more honest test, since free cash flow is what actually funds the check every quarter.
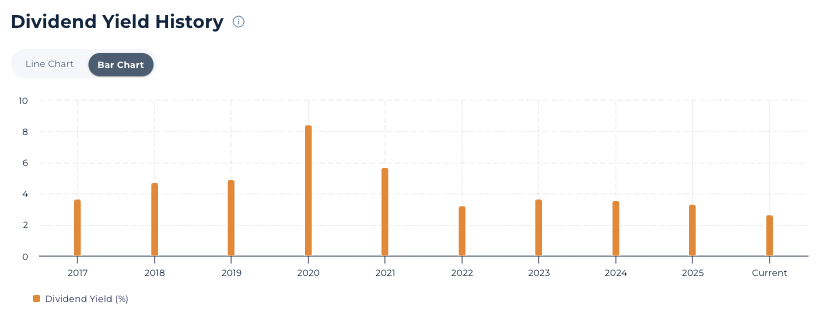
The real stress test happened in 2020. The Dividend Yield History chart shows a spike to roughly 8% that year, not because the payout was raised, but because the share price collapsed underneath it. The debt servicing ratio spike to 12.43 covered earlier in this article is the other half of that same story: with free cash flow turning negative during the 2020 oil crash, ExxonMobil funded the dividend from the balance sheet rather than cut it, taking on debt to preserve a dividend-growth streak that by then already stretched back decades. That's a more useful durability test than the streak length alone: an uninterrupted dividend is reassuring, but an uninterrupted dividend that survived a negative-free-cash-flow year by taking on debt tells you exactly what "durable" means.
Total return, not yield alone. The total return calculator shows a cost basis of $111.44 a year ago against a current price near $154.78, a combination of price appreciation and roughly $4.08 per share in dividends collected over that stretch. Yield is one input to that outcome, not the whole of it; it's worth reading dividend income as one component of return.

Final Thoughts on ExxonMobil's Intrinsic Value
The tension is straight forward : If the Permian and Guyana cost advantages keep compounding into the free cash flow line the way management has guided, the gap between the conservative cash-based fair value estimate and today's price has a real path to closing without oil prices needing to cooperate. If the current rally is mostly a geopolitical risk premium unwinding, the multiple has further to give back than the underlying business does.
This analysis is shared for educational purposes and is not intended as financial advice or a recommendation on any investment. OracleValue™ is an estimate and should not be taken as a signal to buy or sell. Any past performance mentioned is not indicative of future results.
Related
Home Depot trades at 21.95 times trailing earnings, a multiple that assumes the growth engine ...

Philip Morris International posted its first $11.2 billion revenue quarter, with organic growth ...
Lam Research stock has surged more than 90% this year, outrunning nearly every semiconductor peer, ...