In 2021, AppLovin traded at more than 1,000 times its trailing earnings. Today, after a 69% fall from its December 2025 peak, the same stock trades at roughly 17 times earnings, even as its profits have grown more than a hundredfold.
So which number is wrong: the hype of the past, or the fear of the present? That question is the focus of the APP intrinsic value debate, and it is why so many investors are asking whether AppLovin is now cheap, or simply cheaper.
What Does AppLovin Actually Do?
AppLovin (NASDAQ: APP) is a Palo Alto based advertising technology company. Its software helps mobile app developers, and increasingly online retailers, find new customers and earn more from the ads inside their apps.
The engine behind it all is AppLovin Axon, an AI ad-matching system that predicts which ad a given user is most likely to act on. Think of Axon as a matchmaker sitting between millions of advertisers and billions of ad slots, getting a little smarter with every match.
AppLovin used to own game studios too. It sold that apps business to Tripledot Studios, completing the deal on June 30, 2025, and is now a pure advertising platform.
What Is the AppLovin Intrinsic Value? Reading the APP Intrinsic Value Models
Intrinsic value is an estimate of what a business is worth based on the cash it can generate in the future, discounted back to today. The gap between that estimate and the market price is what investors call the margin of safety.
For AppLovin, the answer depends heavily on which lens you use.
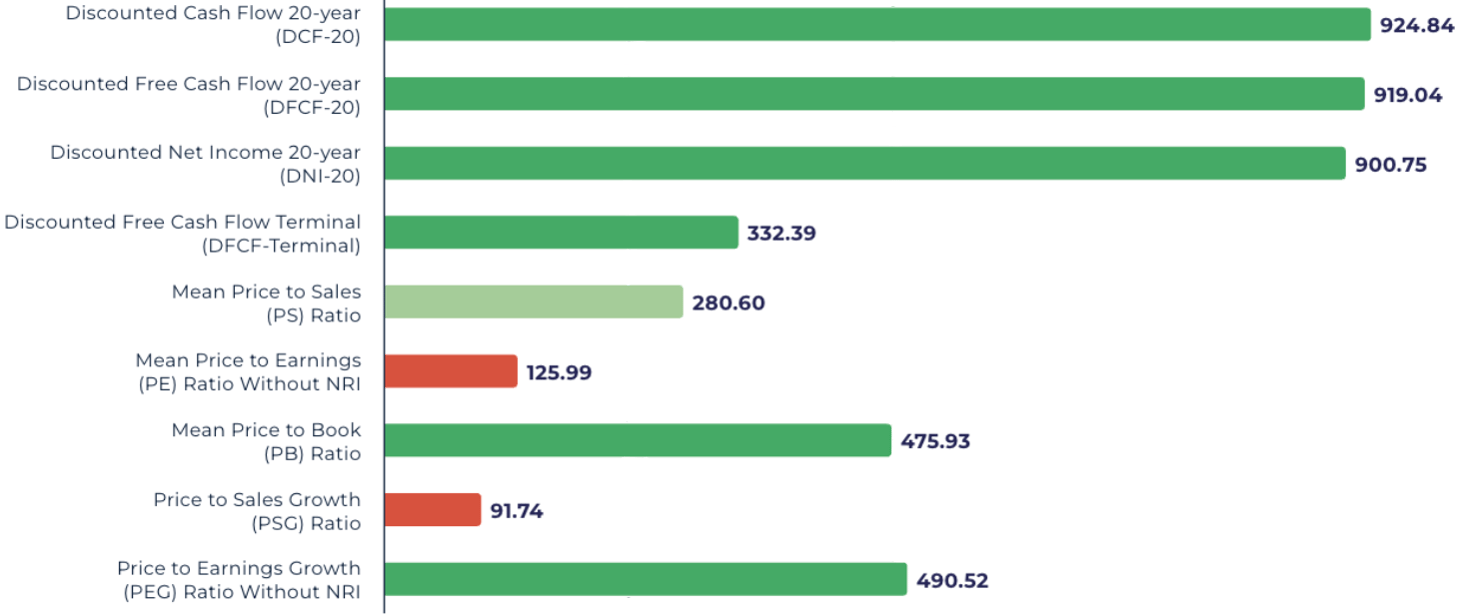
AppLovin (APP) Intrinsic Value Models, Powered by StockOracle™ 5th November 2026
The nine valuation models range from $91.74 to $924.84 per share, a tenfold spread. That spread is the story in itself.
- The three 20-year models, DCF-20 at $924.84, DFCF-20 at $919.04, cluster tightly. These models assume that AppLovin will keep compounding its cash flow for two decades.
- The terminal DCF lands far lower at $332.39, because it puts less weight on long-run growth.
- The multiple-based models Mean P/S at $280.60, Mean P/B at $475.93, PEG at $490.5) sit in between.
- The PSG and Mean P/E models come in lowest, at $91.74 and $125.99.
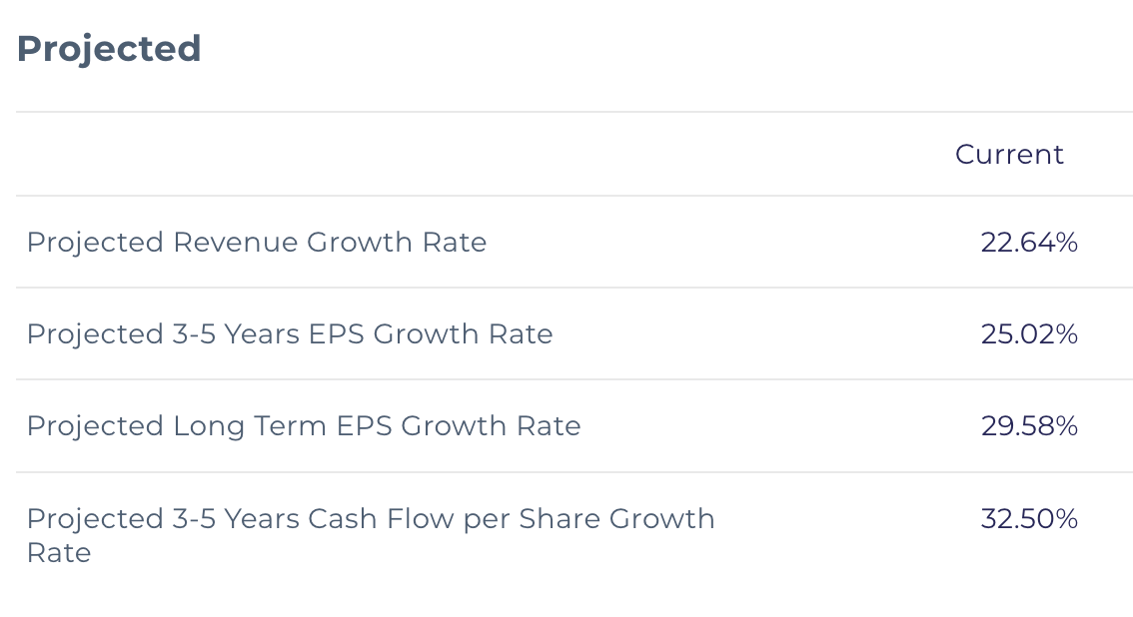
If you believe AppLovin's cash machine will continue to run for 20 years with its 20+% projected growth rates, the models say one thing.
However, if you believe its best years are already in the price, you can adjust its growth rates accordingly with StockOracle™ intrinsic value calculator .
Why the PSG Ratio and Mean P/E Models Come in Lowest
Both models lean on yardsticks that understate what AppLovin looks like today.
The Mean P/E model applies a historical average, and AppLovin's history is unusual: it reported losses in 2020 and 2022 and earned just $0.09 per share in 2021.
Depending on how a model averages those years, the "normal" earnings picture it builds can sit well below today's profit run rate.
The PSG model is the more revealing of the two, so it is worth a closer look.
PSG (price-to-sales growth) divides a stock's price-to-sales ratio by its revenue growth rate.
It values a company on how much it sells, adjusted for how fast sales are expected to grow. What it leaves out is how much of each sale the company keeps.
That blind spot matters more for AppLovin than for almost any large company. Over the 12 months to June 2026, AppLovin turned roughly $6.8 billion of revenue into about $4.4 billion of net income, or around 65 cents of profit per dollar of sales.
Picture two lemonade stands, each selling $100 a day. One keeps $65 after costs; the other keeps $10.
A sales-based model sees two similar businesses. An earnings-based model sees one worth far more.
That is why AppLovin's PEG model ($490.52), which uses the same growth lens but on earnings, lands more than five times higher than its PSG result.
The second factor is slowing growth. Revenue grew 70% in 2025, 53% in Q2 2026, and Q3 guidance implies roughly 47%. Because PSG divides by the growth rate, every step down in growth pushes the PSG value lower, even while profits keep rising.
A low PSG result flags that revenue growth is decelerating. It says less about AppLovin's profitability, which is where most of its value case rests.
AppLovin just posted its earnings - Check out changes in APP intrinsic value with StockOracle™
AppLovin Revenue and Free Cash Flow: What Feeds the APP DCF
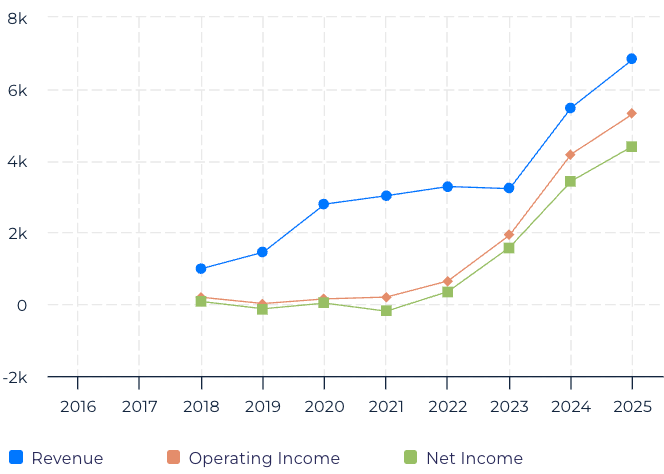
APP Revenue Trend Powered by StockOracle™ 5th November 2026
AppLovin's revenue rose from $3.22 billion in 2024 to $5.48 billion in 2025, a 70% jump, according to its Q4 and full-year 2025 results. In the second quarter of 2026, revenue climbed another 53% to $1.92 billion.
What stands out is that costs barely kept pace. Adjusted EBITDA margin widened from 75% in 2024 to 84% in Q2 2026, so each new dollar of revenue arrives with very little extra cost attached. That is operating leverage in its purest form.
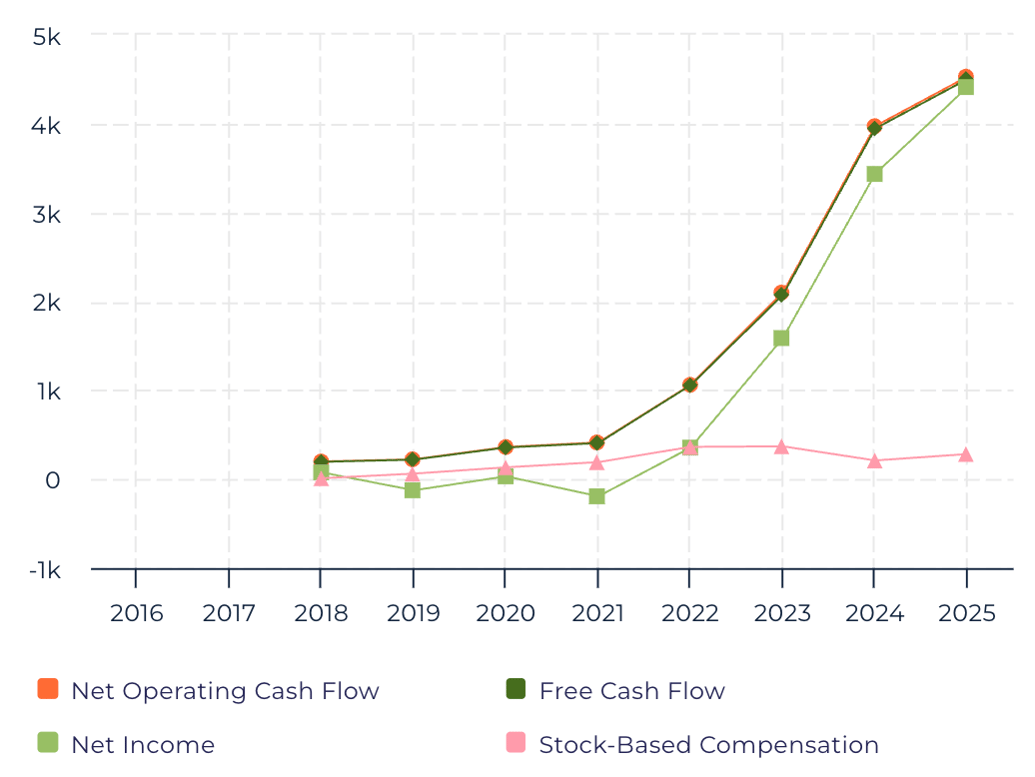
APP Operating Cash Flow and Free Cash Flow Chart Powered by StockOracle™ 5th November 2026
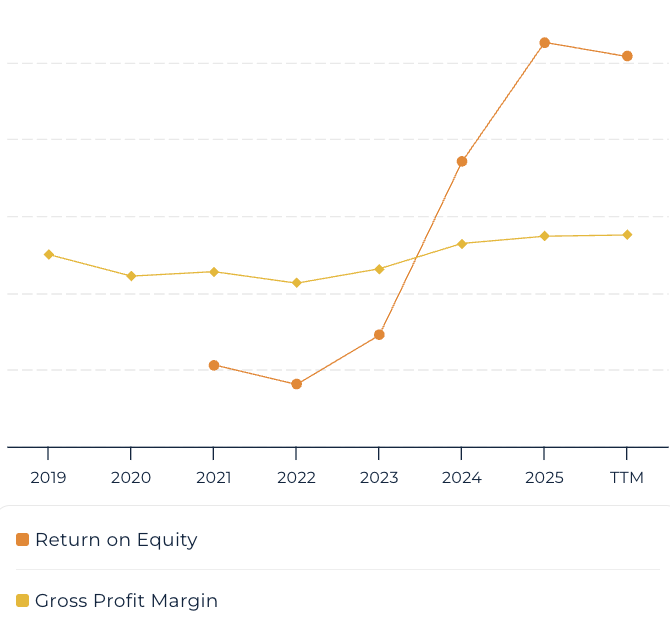
APP Margin Chart Powered by StockOracle™ 5th November 2026
Free cash flow is the cash left after the business pays for everything it needs to run and grow. AppLovin generated $3.95 billion of free cash flow in 2025, roughly 72 cents of real cash for every dollar of revenue, up from $2.07 billion in 2024. Because intrinsic value models are built on future cash flows, this line does more to shape the APP intrinsic value than any other.
Balance Sheet Snapshot of APPLovin
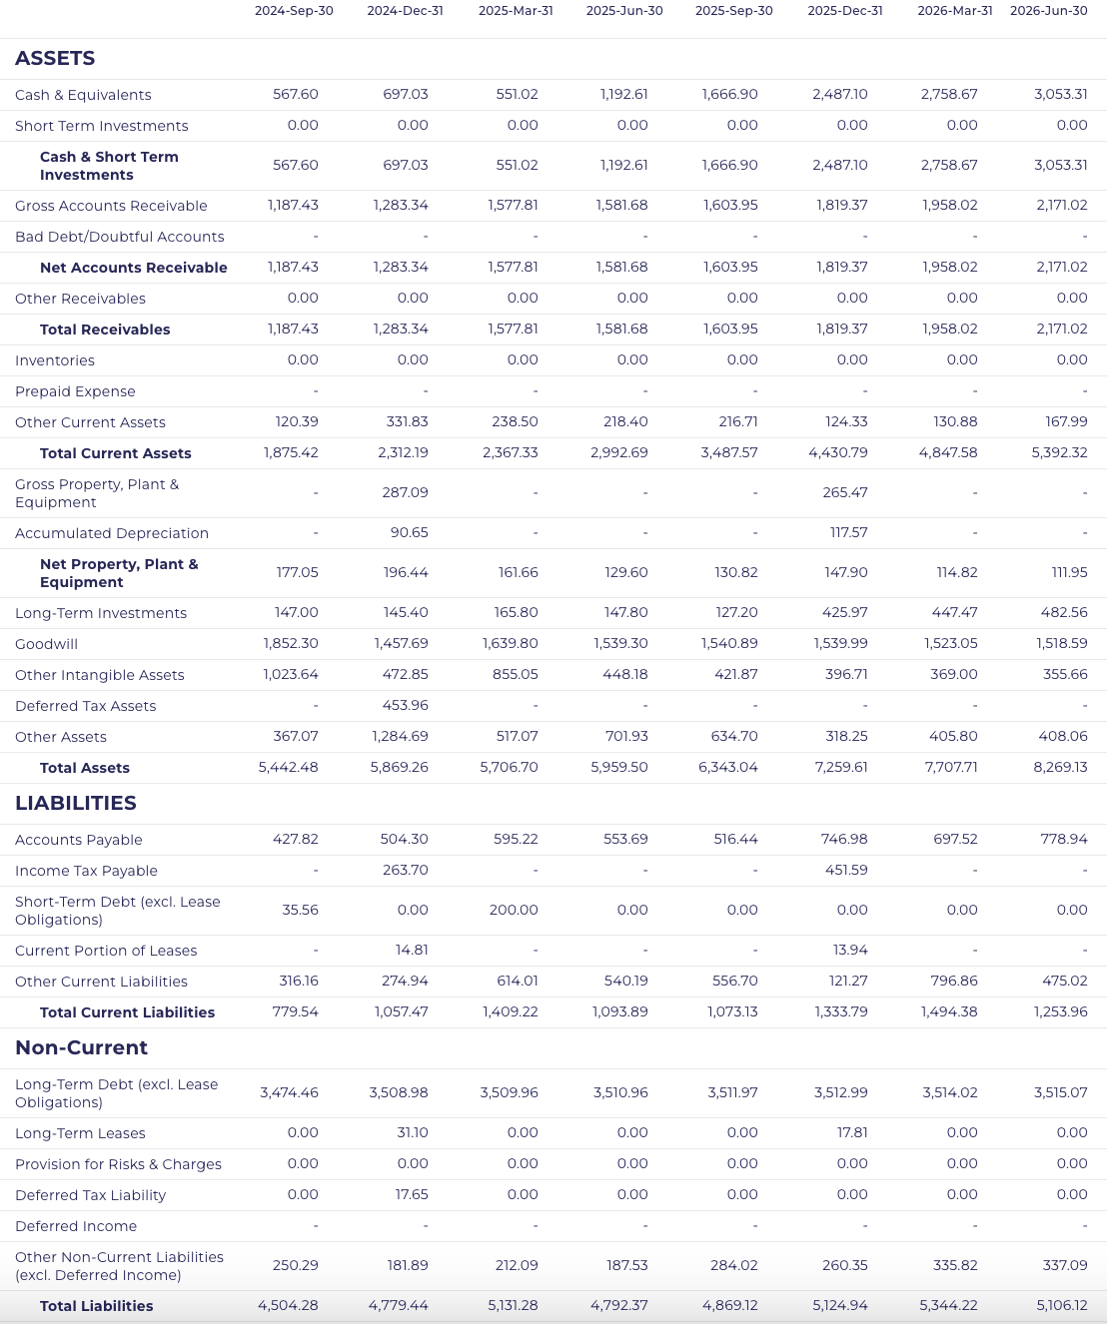
APP Balance Sheet Powered by StockOracle™ 5th November 2026
As of June 30, 2026, AppLovin held $3.05 billion in cash against $3.52 billion in long-term debt, leaving net debt of under $0.5 billion. Relative to its annual cash generation, that is a light load.
This gives AppLovin room to keep funding buybacks and the compute behind its AI models from its own cash, even if the ad market softens, instead of leaning on new borrowing.
AppLovin Axon: The Growth Engine Behind the Valuation
AppLovin Axon is the reason the stock went from forgotten to famous, and the reason it now swings so hard on every earnings call.
- Axon 2.0 launched in Q2 2023, and revenue growth accelerated sharply in the quarters that followed.
- The self-serve Axon Ads platform launched on October 1, 2025 on a referral-only basis, and opened to advertisers globally in June 2026.
- E-commerce is the new frontier. In Q1 2026, consumer advertiser spend in March ran about 25% above January, and April 2026 set a record for the vertical.
- Revenue is global: Q1 2026 revenue split almost evenly between the US ($907 million) and the rest of the world ($935 million).
Axon's growth comes in steps, each tied to a model improvement.
When the Q2 2026 step landed just after quarter end, revenue came in slightly below expectations.
Compute costs also rose, with AppLovin spending about $0.10 on computing for each extra dollar of revenue.
For valuation, the question is less whether Axon improves and more how regularly.
Steady upgrades make the long-run DCF assumptions look more plausible, and lumpy ones make the market more cautious.
P/E ratio From 1,000x to 17x: AppLovin Investor Sentiment Since the IPO
2021: The IPO Hype
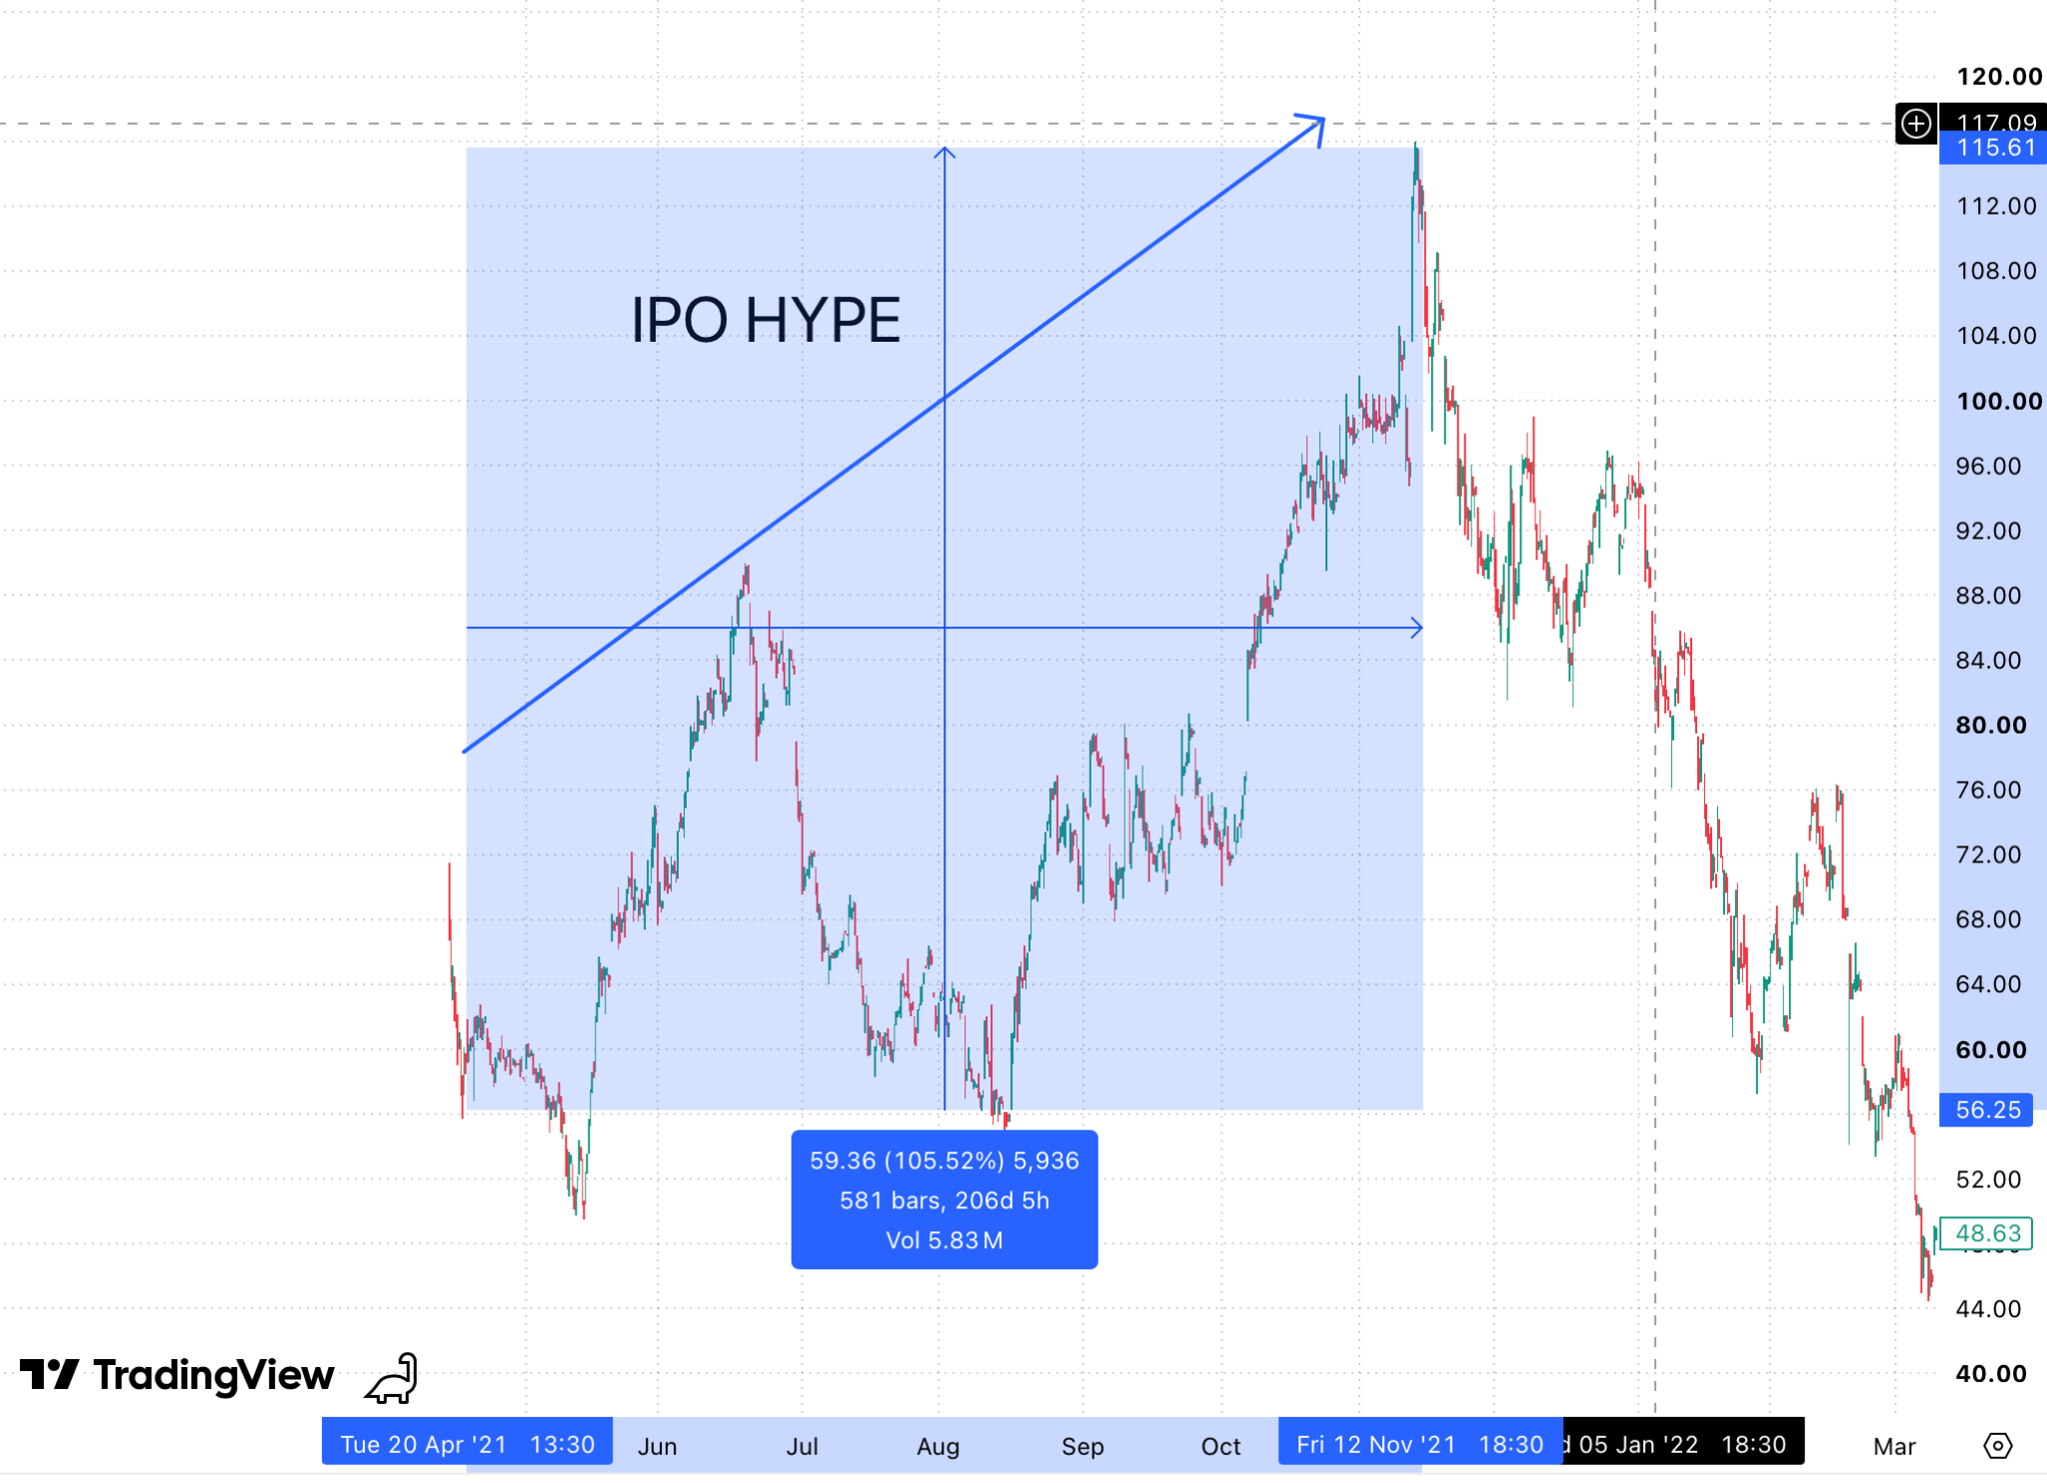
AppLovin listed on Nasdaq on April 15, 2021 at $80 per share, raising about $1.8 billion. The debut was rocky: shares closed day one at $65.20, down 18.5%.
The excitement built later in the year.
Mobile gaming had boomed during the pandemic, and AppLovin was buying its way to scale, including the measurement firm Adjust and Twitter's MoPub ad exchange around $1.05 billion.

The shares peaked on November 11, 2021 which is when P/E topped 1,000x.
In 2021, AppLovin earned only $35.4 million on $2.79 billion of revenue, or $0.09 per share. Investors were paying for a growth story, with almost no profit underneath it yet.
2022: The Crash
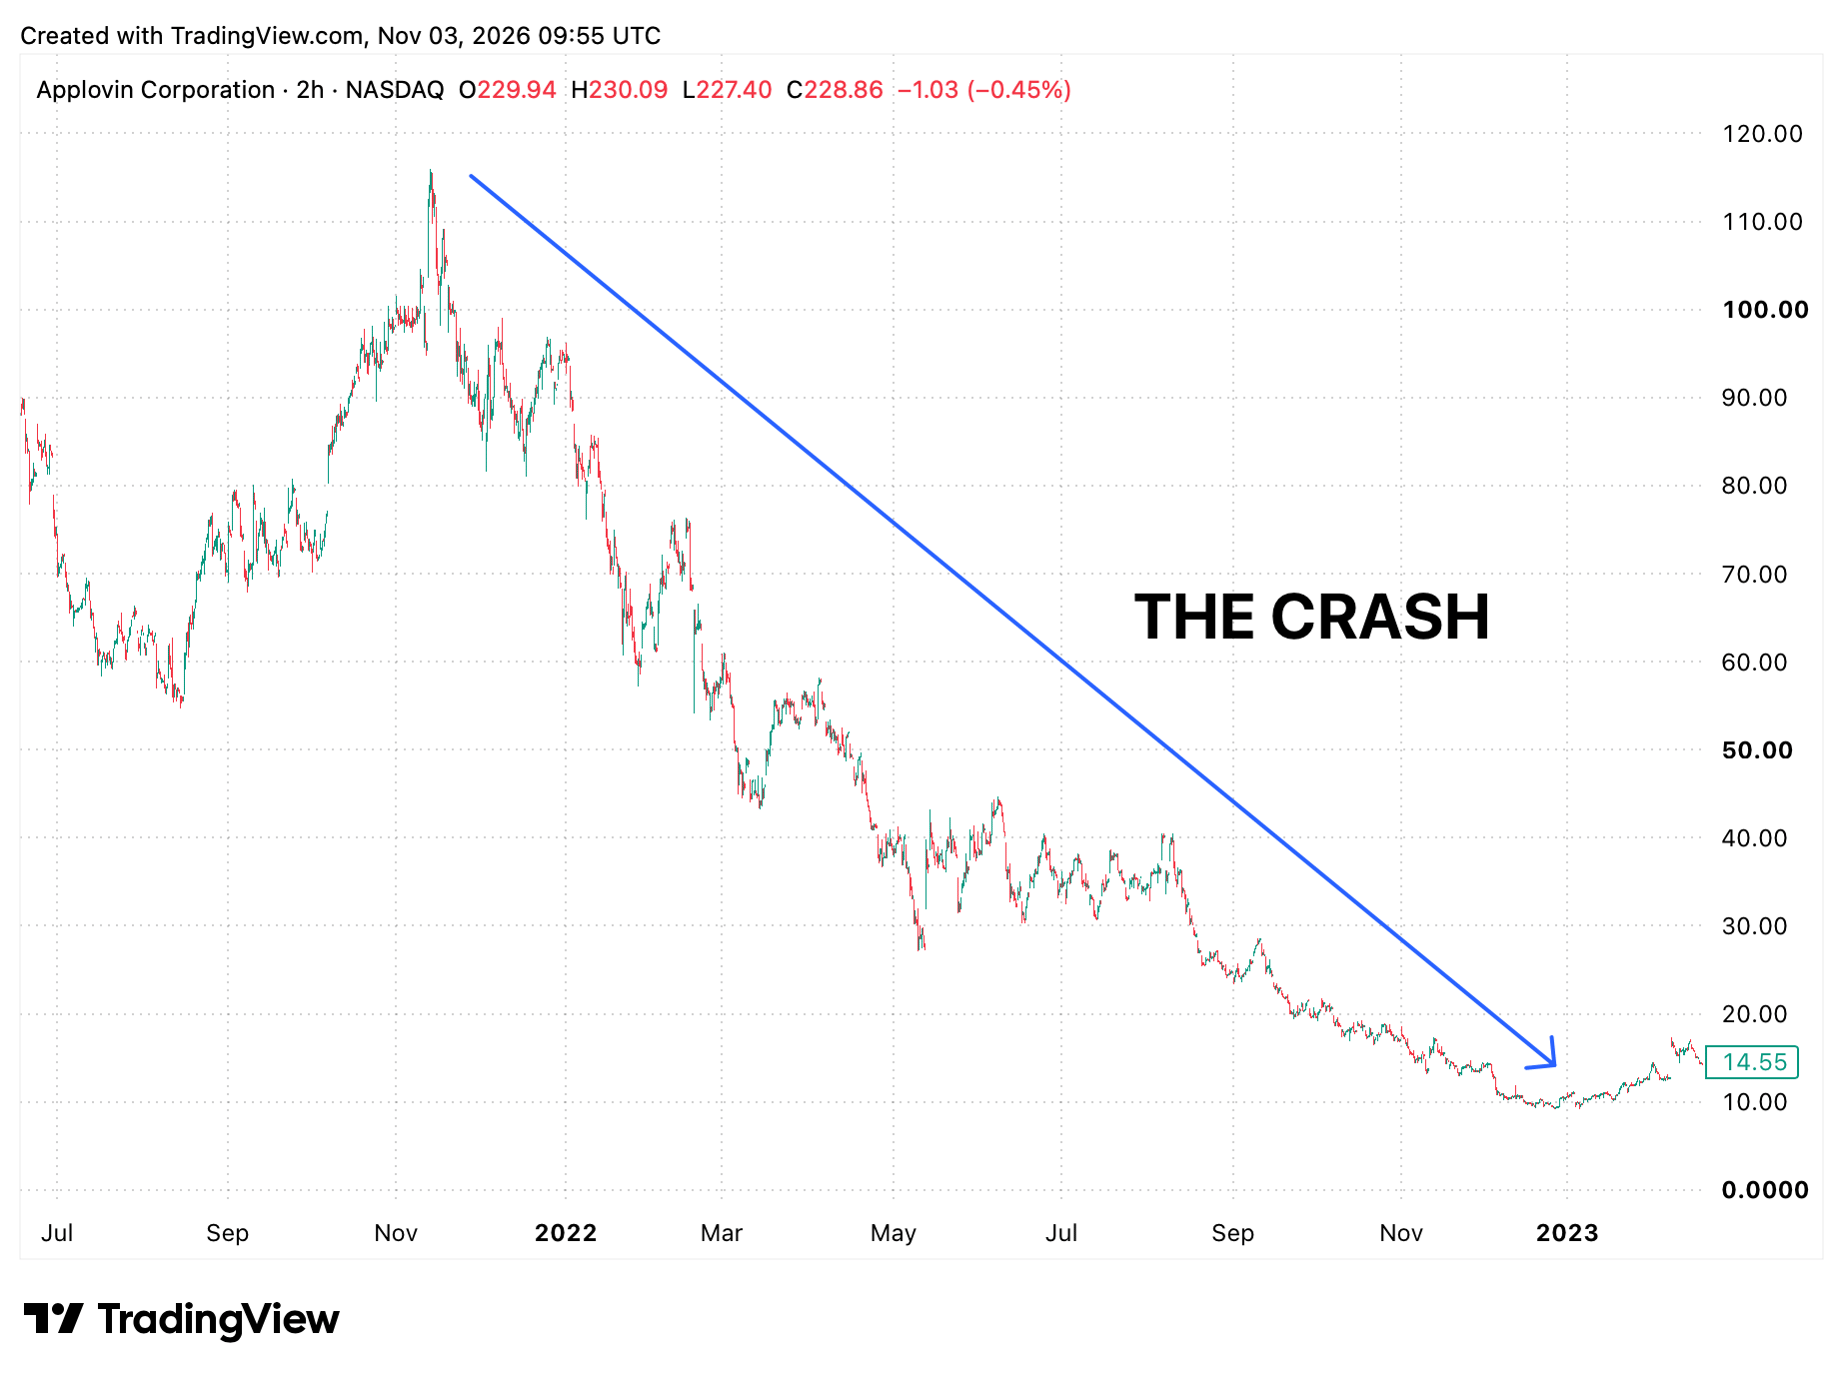
From the November 2021 peak to December 27, 2022, the stock fell about 92%. Post-pandemic gaming demand cooled, Apple's privacy rules made mobile ad targeting harder, and rising interest rates hit unprofitable growth stocks broadly.
AppLovin also lost money for the year, and its $17.5 billion bid for Unity in August 2022 was rejected.
2023 to 2025: The Axon Rerating
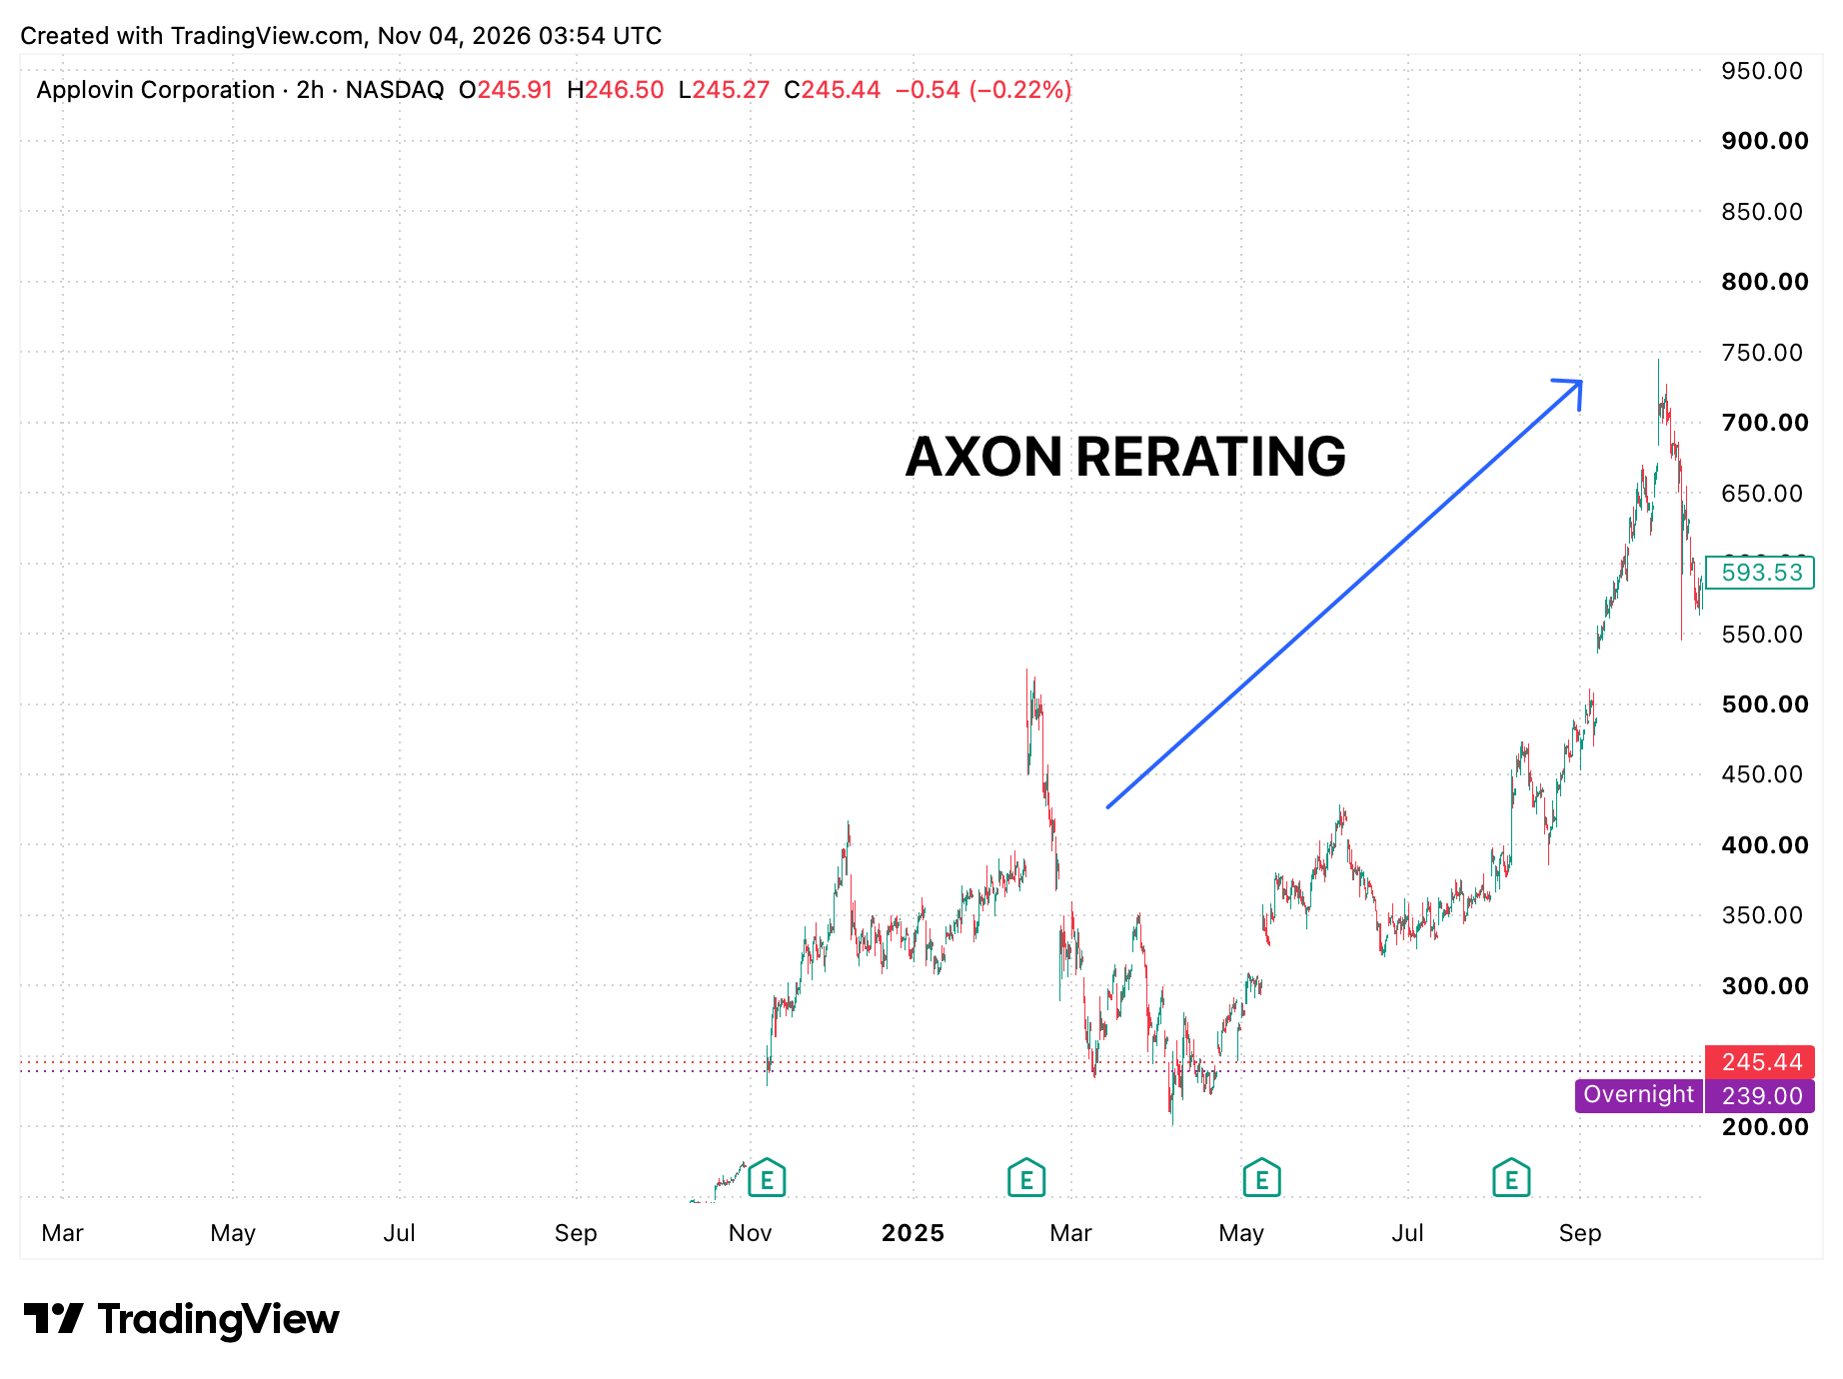
Axon 2.0 changed the narrative. Profits surged, and the stock went from the low $70s in April 2024 to around $500 by February 2025, a gain of more than 900% in a year.
AppLovin joined the S&P 500 on September 22, 2025, and hit a record close of $733.60 on December 22, 2025.
Even then, the P/E stood at roughly 68x to 69x at the end of 2024 and 2025, rich but a world away from 1,000x, because earnings were finally catching up with the price.
2026: The Derating
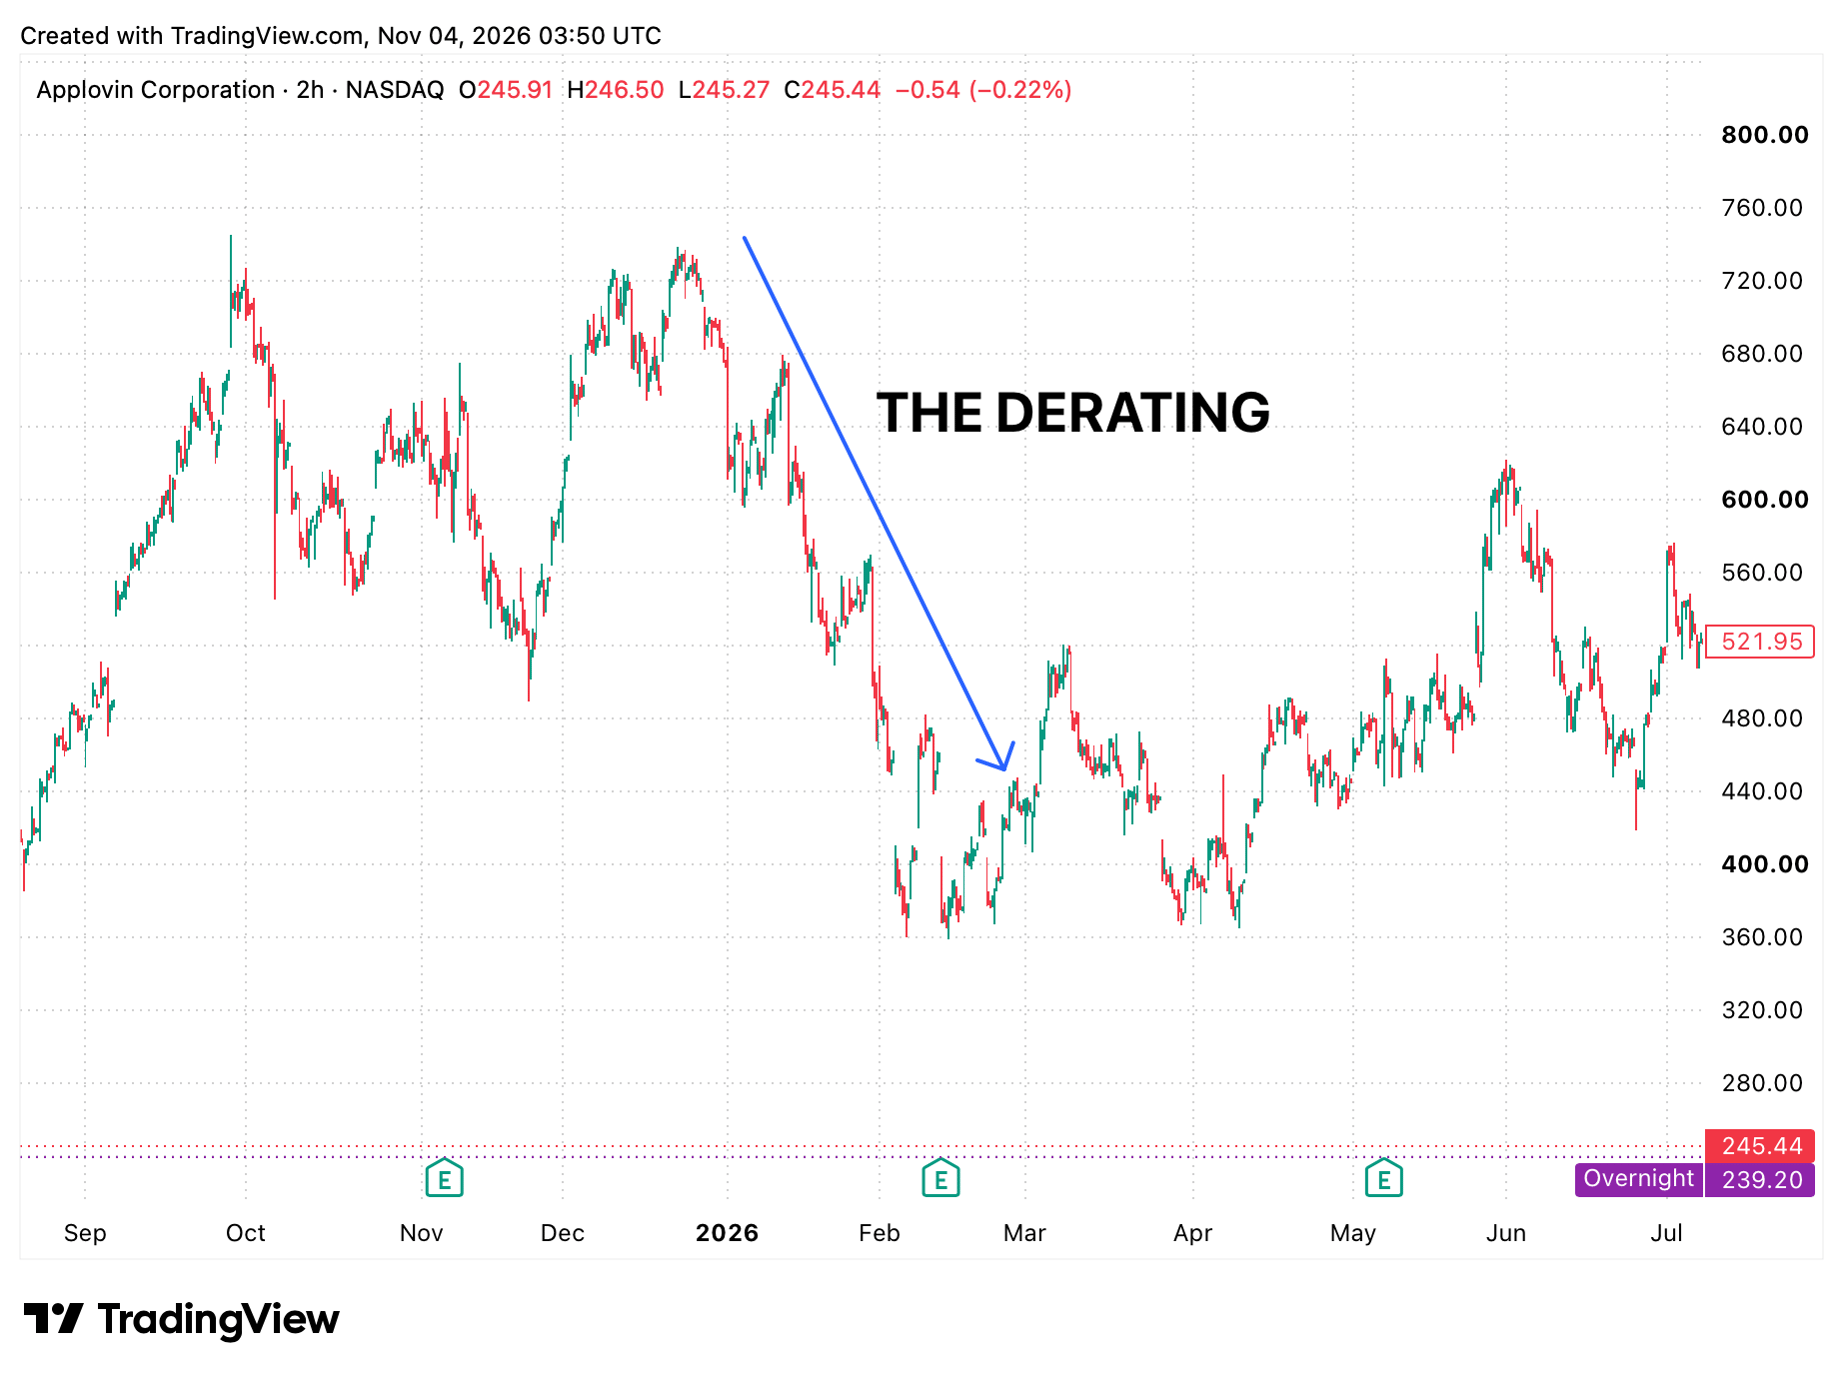
The stock lost 30% in January 2026 alone, hit by a software sector selloff, a new short-style report, and a 17% one-day drop after Google unveiled its Project Genie AI game-creation tool.
Concerns that Meta would compete harder for iOS ad traffic added pressure.
The biggest blow came after Q2 2026 results on August 5: a slight revenue miss and softer guidance sent shares down 19.7% the next day.
By October 30, 2026, APP closed at $228.50, its lowest close in a year.
So what drove the P/E from 1,000x to about 17x? Two forces at once. Earnings per share grew from $0.09 in 2021 to $10.04 in 2025, and in 2026 the share price fell by roughly two thirds.

P/E history chart, 2021 to 2026 Powered by StockOracle™
The AppLovin Short Report Saga: How the Scandals Hit the Stock
Few large-cap stocks have faced as many short attacks in as short a time.
|
Date |
Event |
Share price reaction |
|---|---|---|
|
Feb 26, 2025 |
Fuzzy Panda and Culper Research publish short reports alleging inflated metrics and improper data practices |
|
|
Mar 27, 2025 |
Muddy Waters alleges AppLovin breached Apple and Google app store terms |
|
|
Oct 6, 2025 |
Bloomberg reports an SEC probe into AppLovin's data collection practices |
|
|
Jan 20, 2026 |
CapitalWatch publishes allegations around anti-money-laundering controls; partly retracted on February 4 |
|
|
Aug 5, 2026 |
CFO says the SEC concluded its inquiry with no recommended action |
Overshadowed by the Q2 revenue miss |
The most consequential was the Muddy Waters AppLovin short report. Its core argument was that AppLovin's ad targeting relied on practices that could breach platform rules, and that the platforms could shut it down.
CEO Adam Foroughi called the earlier reports "nefarious" and disputed the claims point by point.
For investors, the lasting effect was a risk discount.
Even after the SEC inquiry closed without action, the stock carries a reputation for headline volatility.
A separate securities class action, covering purchases from February 12 to August 5, 2026, centers on statements about model improvements.
These are allegations, not findings, and the lead plaintiff deadline is November 16, 2026.
AppLovin Bull Case vs Bear Case
The bull case
- Exceptional margins: an 84% adjusted EBITDA margin and about 65 cents of net profit per revenue dollar.
- Cash generation: $3.95 billion of free cash flow in 2025, funding sizable buybacks.
- New markets: the global opening of the Axon self-serve platform and early e-commerce traction could widen the advertiser base beyond gaming.
- Regulatory overhang eased: the SEC inquiry closed with no recommended action.
- Valuation reset: the P/E has compressed from about 68x at the end of 2025 to about 17x.
The bear case
- Slowing growth: revenue growth has stepped down from 70% in 2025 toward roughly 47% implied by Q3 guidance, and management's long-term ambition is about 30% a year.
- Lumpy model gains: growth depends on regular Axon upgrades, and one slower quarter cost the stock nearly 20% in a day.
- Well-armed competitors: Meta brings first-party data from billions of users and its own ad network.
- Google owns Android, and the Play Store and Unity pairs its ironSource ad network with a game engine used by many developers. AppLovin has to defend against each of these advantages.
- Platform dependence: much of AppLovin's business runs on Apple and Google app ecosystems, whose rules it does not control.
- Legal and reputational risk: the pending class action and repeated short reports keep headline risk elevated.
- Rising compute costs: training better models costs more, which could pressure margins over time.
Final Thoughts on AppLovin's Intrinsic Value
- AppLovin's profits have grown more than a hundredfold since 2021, while its P/E has fallen from above 1,000x to about 17x.
- The APP intrinsic value models span $91.74 to $924.84, the intrinsic value depends on how long growth is expected to last.
- Sales-based models (PSG, Mean P/S) understate a business that keeps about 65 cents of each revenue dollar as profit.
- Growth is slowing, model gains are lumpy, and competition from Meta and Google is real.
- Legal and short-seller headlines remain a source of volatility, even after the SEC inquiry closed.
The market has swung from euphoria to deep skepticism in five years. The fundamentals in between have been far steadier than the share price. Whether the AppLovin intrinsic value sits closer to the low or high end of the model range will depend on whether Axon keeps improving, quarter after quarter.