KFC is replacing Pepsi with Coca-Cola at its roughly 3,700 US restaurants, ending a fountain partnership that traces back to 1986.
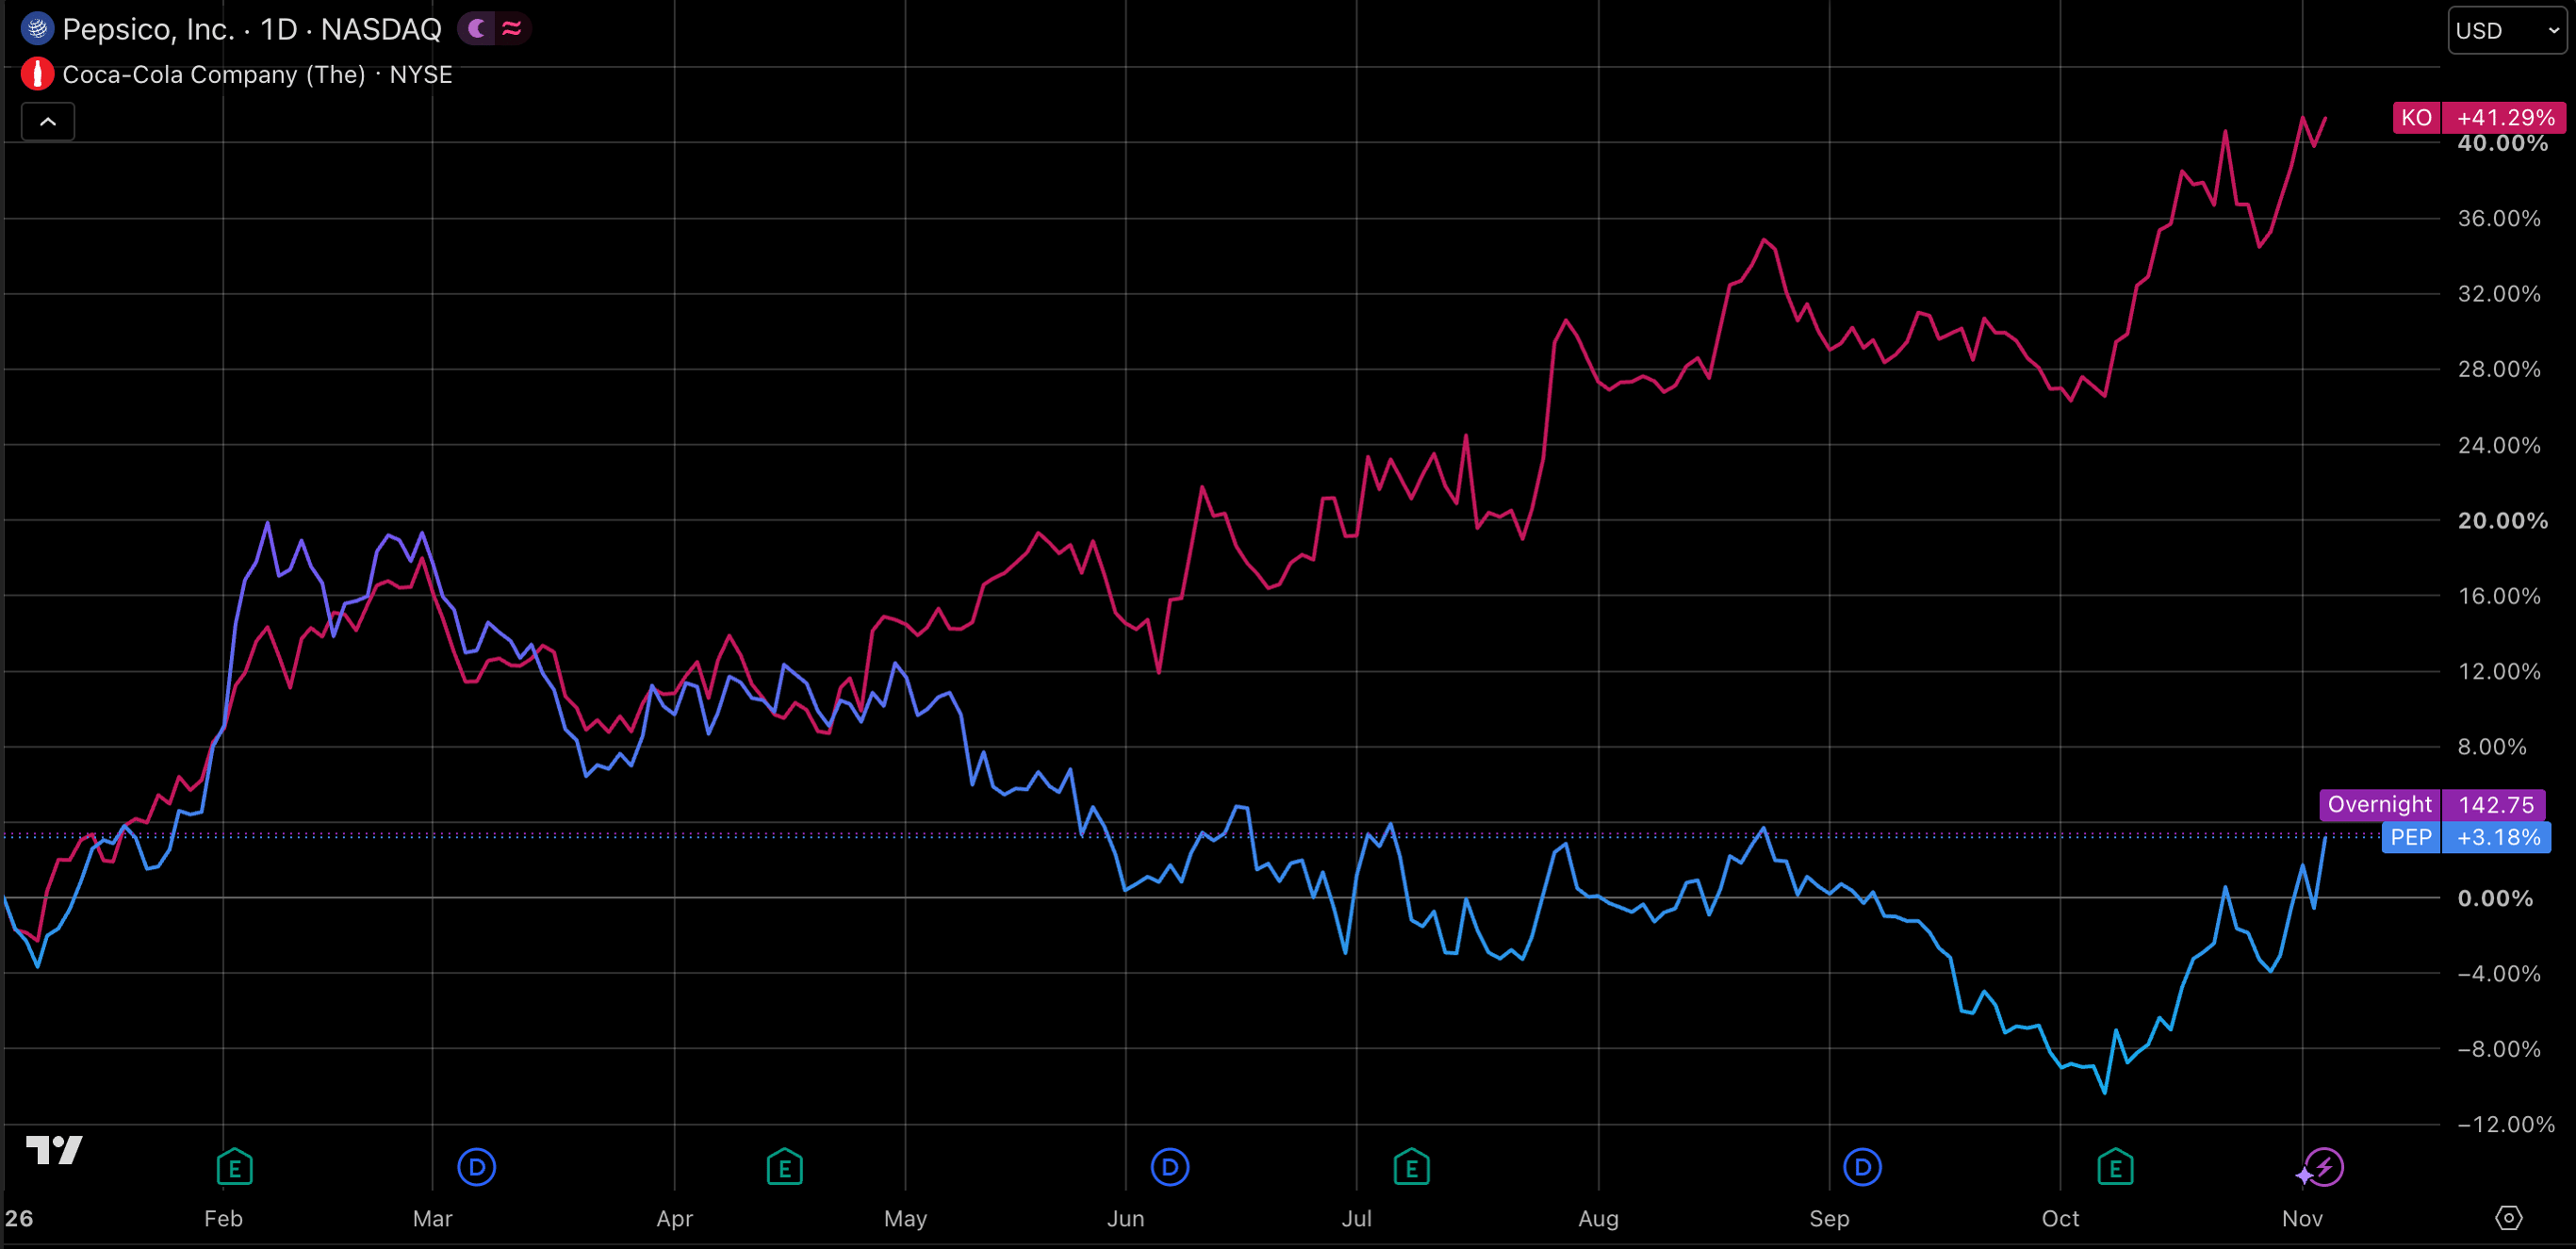
The headline lands at a tense moment for the cola rivals. As of November 5, Coca-Cola stock is up about 41% for the year, while PepsiCo was up only about 3%.
What is each business actually worth?
|
Key Points
|
Coca-Cola vs Pepsi Stock: Two Very Different Businesses
Coca-Cola mostly sells concentrate and syrup to independent bottlers, who carry the factories, trucks and retail relationships. Full-year 2025 net revenue was $47.9 billion.
PepsiCo is roughly twice the size, with $93.9 billion in 2025 net revenue. Beverages make up only about 40% of it. The rest comes from Frito-Lay, Quaker and other food brands, and PepsiCo runs much of its own manufacturing and distribution.
Think of it this way: Coca-Cola sells the recipe, while PepsiCo runs the kitchen, the delivery fleet and part of the store. That single difference explains most of what follows in this KO vs PEP stock comparison.
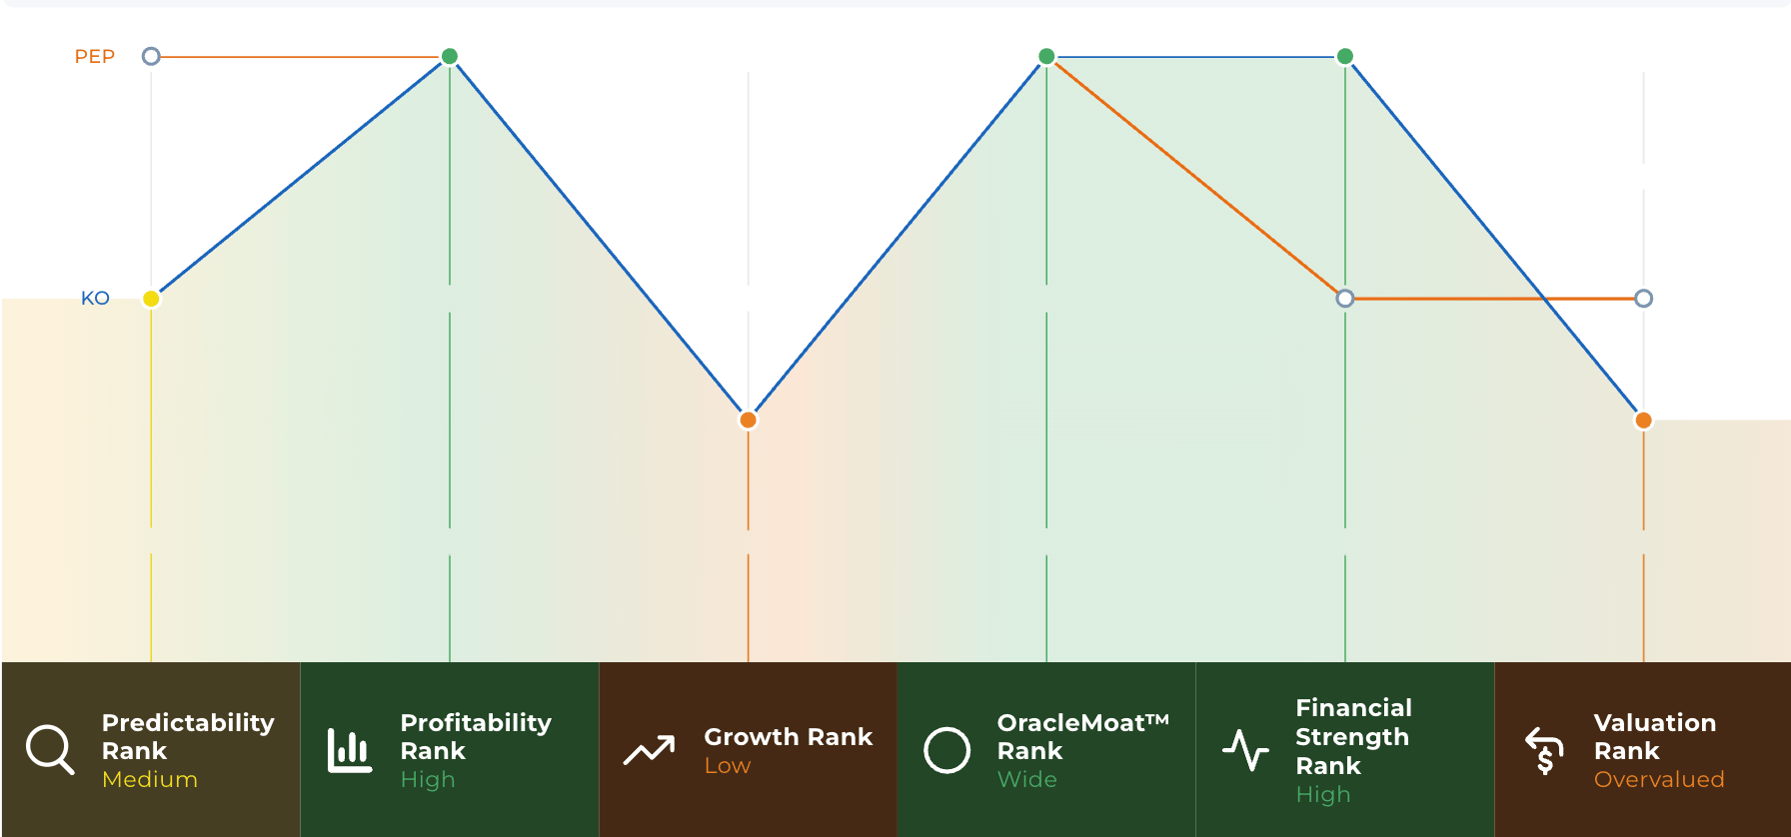
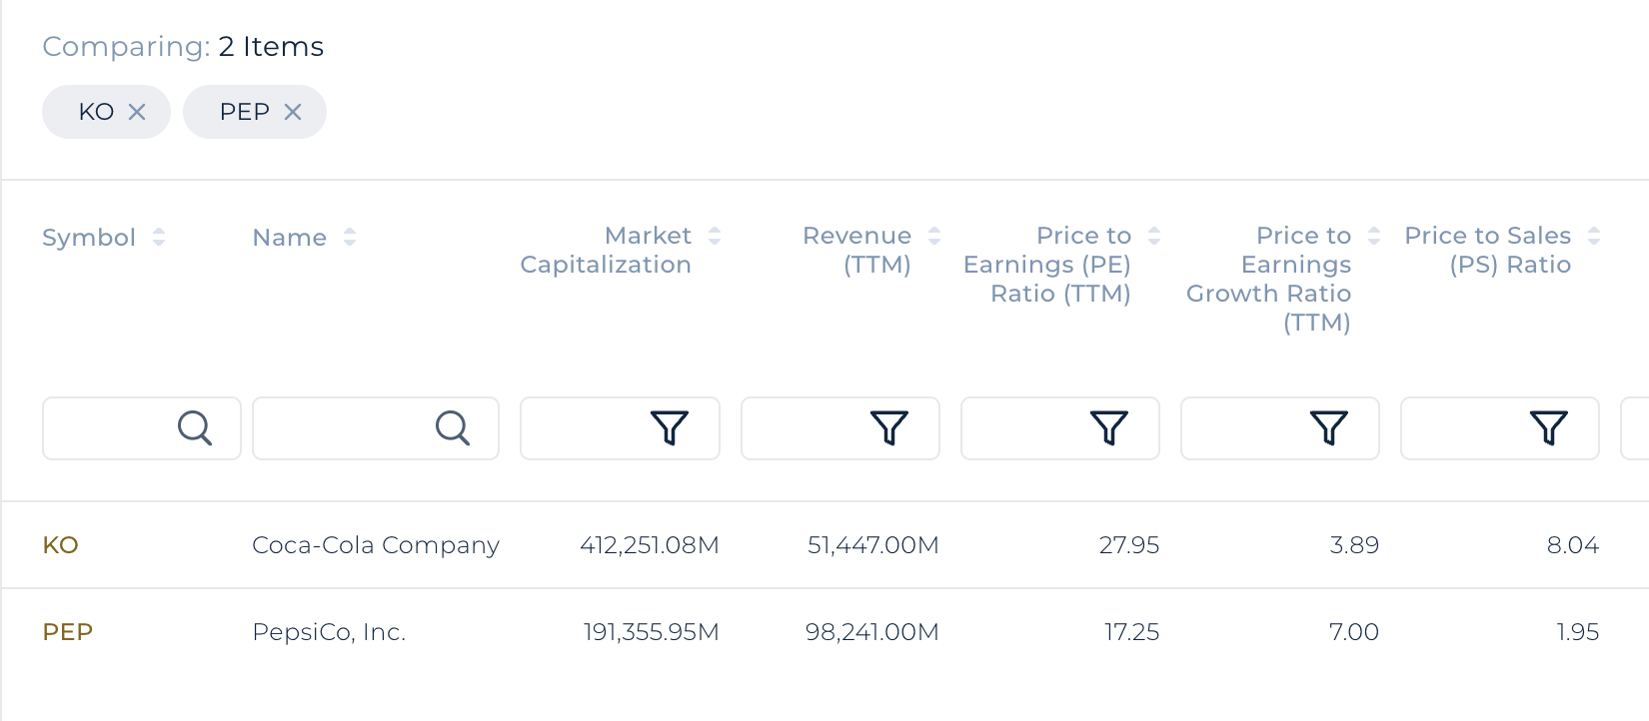
KO vs PEP Comparison Table Powered by StockOracle™
The market already prices that difference. Coca-Cola carries a market capitalisation of about $404 billion, against roughly $179 billion for PepsiCo, even though PepsiCo brings in about twice the revenue.
KO vs PEP Stock: Intrinsic Value Side by Side
What is the intrinsic value of Coca-Cola and PepsiCo stock?
Intrinsic value is an estimate of what a business is worth based on the cash it can produce in the future. Investors compare it with the market price to judge their margin of safety, the cushion that protects them if their assumptions turn out too optimistic.
No single model holds the final answer. So instead of one number, here is how each stock looks across several valuation frameworks in StockOracle™, as of October 2026.
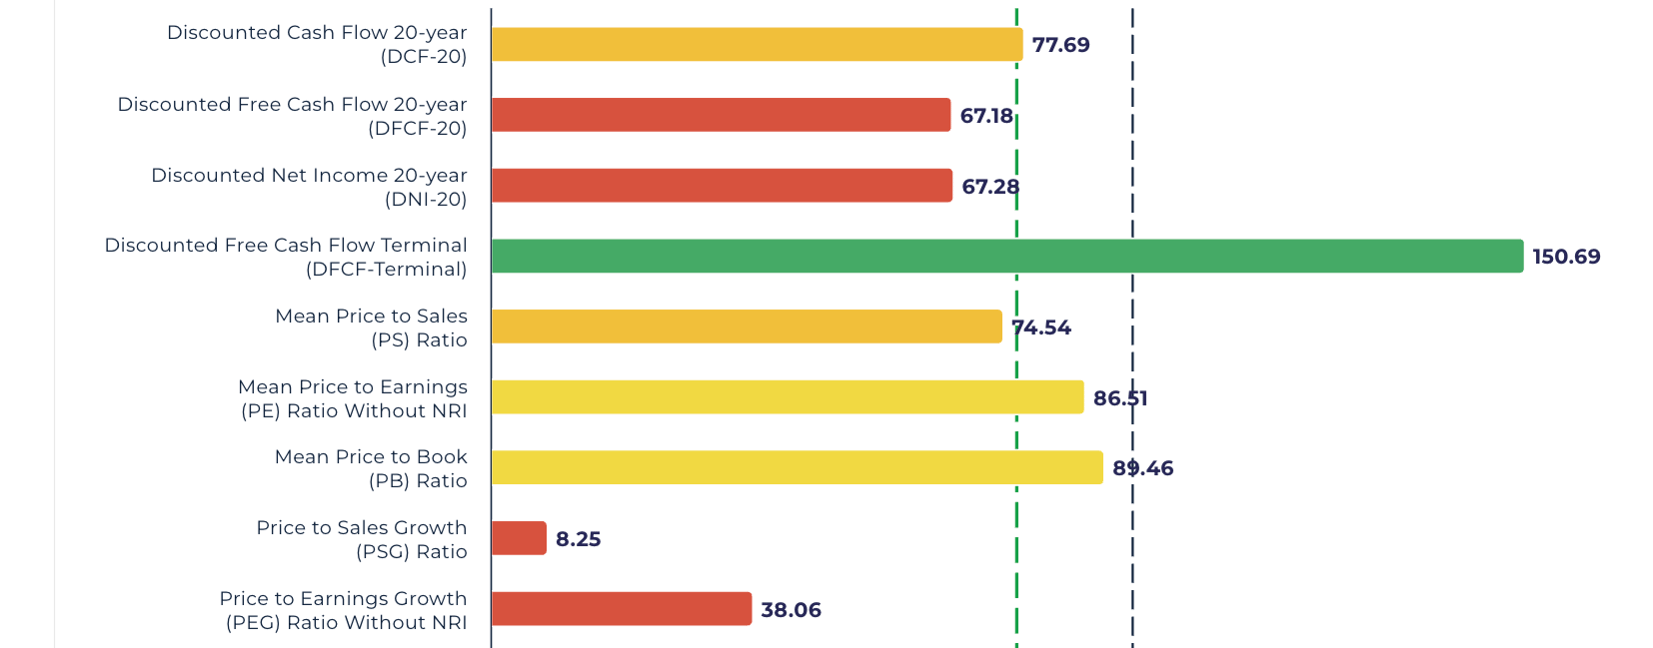
KO Valuation Chart Powered by StockOracle™
For Coca-Cola, the 20-year cash flow models cluster between $67 and $78.
Only the terminal-value model reaches $150.69, which tells you KO's valuation leans heavily on the belief that its cash flows will keep compounding for decades beyond the forecast window.
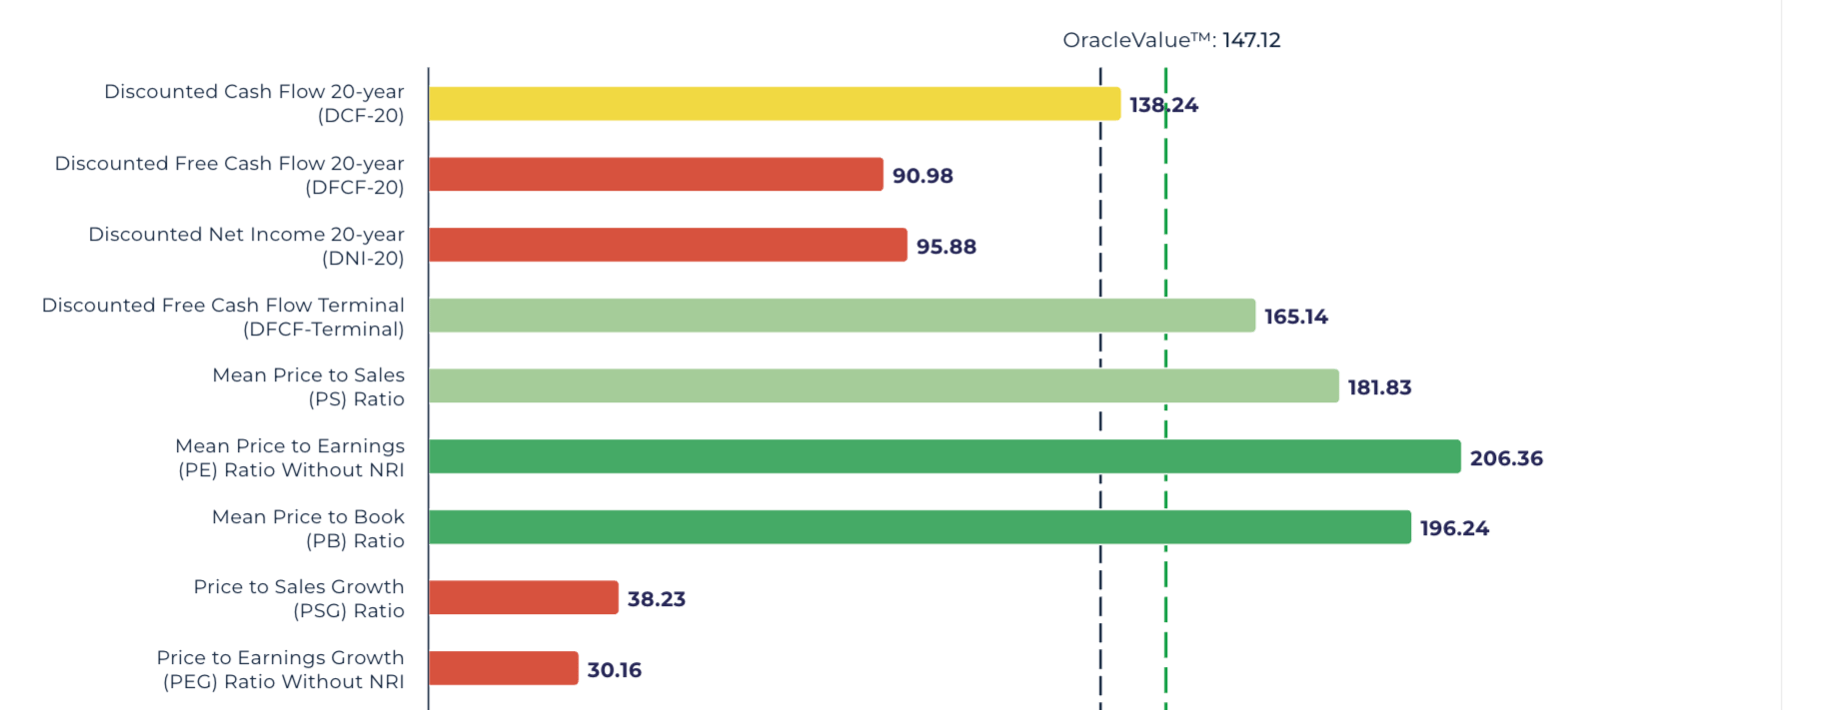
PEP Valuation Chart Powered by StockOracle™
For PepsiCo, the 20-year cash flow models span $91 to $138, while the models based on its own historical multiples land between $182 and $206. That gap suggests the market is pricing PepsiCo as if its past valuation no longer applies until North America recovers.
Revenue and Margins: Concentrate vs. Chips
KO Revenue Trend Powered by StockOracle™
PEP Revenue Trend Powered by StockOracle™
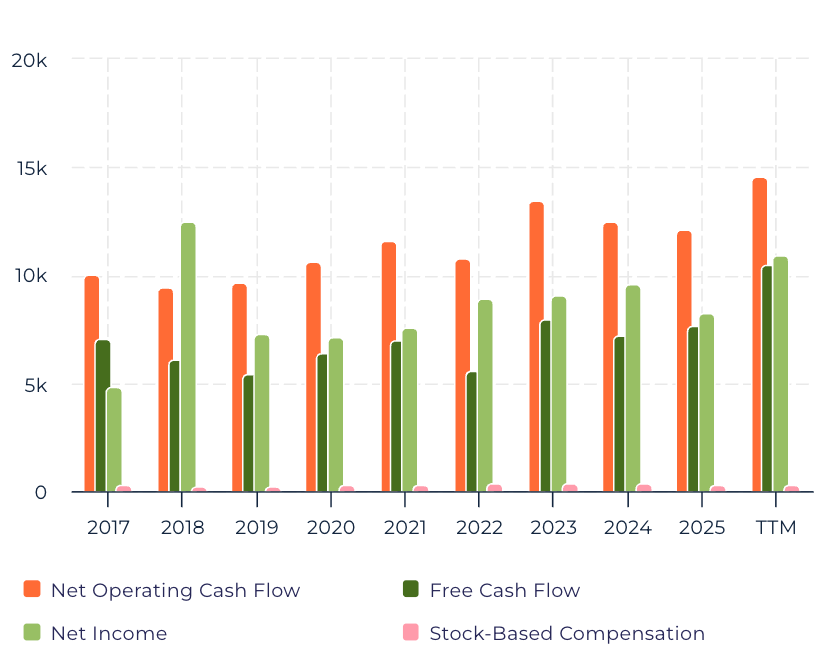
Coca-Cola's most recent quarter showed growth coming from more drinks sold, not only higher prices. In Q2 2026, net revenue rose 7% to $13.4 billion, organic revenue grew 6%, and unit case volume climbed 5%. Operating margin widened to 34.9%, and management raised its full-year outlook to about 5% organic revenue growth and 9% to 10% comparable EPS growth.
PepsiCo is growing too, but the growth is coming from overseas.
In Q3 2026, net revenue rose 5.6% to $25.27 billion and organic revenue grew 3.1%. International organic revenue jumped 8%, while both North American divisions saw organic revenue slip slightly.
The margin gap is the business model showing up in the numbers.
Coca-Cola collects something close to a toll on every bottle its partners sell.
PepsiCo pays for the factories, trucks and warehouses that move its chips and drinks, which keeps its operating margin closer to 14%.
Free Cash Flow: The Number Most Coke vs Pepsi Comparisons Get Wrong
Free cash flow is the cash left after a business pays for everything it needs to run and grow. It is the number that funds dividends and buybacks, and it is the main input in any discounted cash flow model.
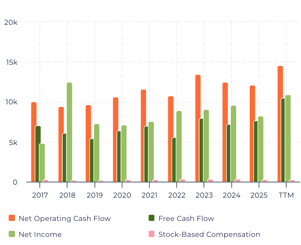
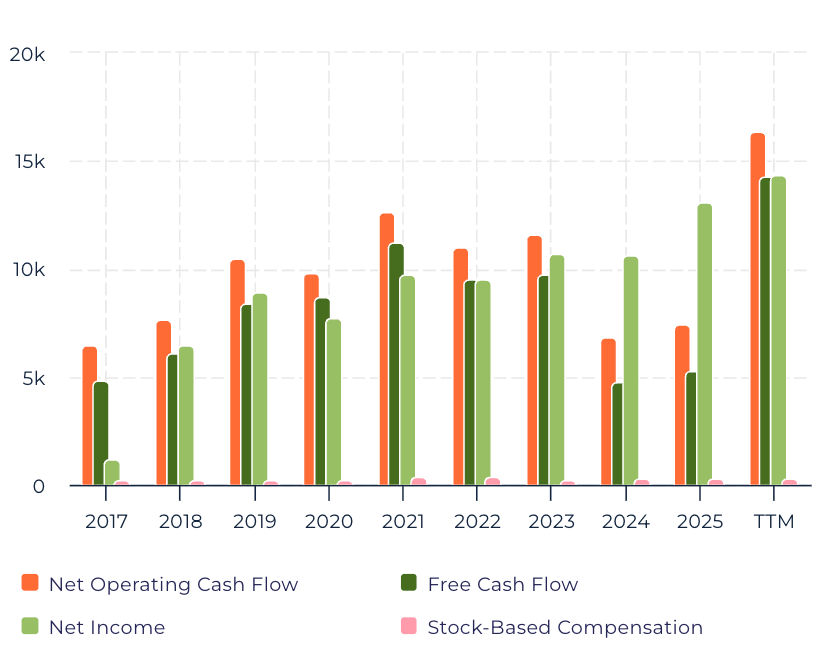
PEP Operating Cash Flow and Free Cash Flow Chart Powered by StockOracle™
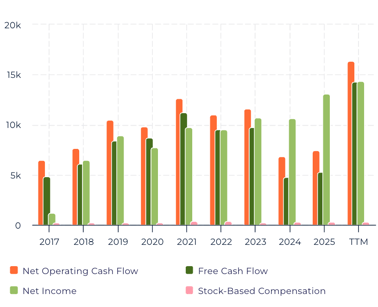
KO Operating Cash Flow and Free Cash Flow Chart Powered by StockOracle™
At first glance, PepsiCo looks like the bigger cash machine.
Coca-Cola reported 2025 free cash flow of just $5.3 billion.
PepsiCo generated about $7.7 billion, from $12.1 billion of operating cash flow less $4.4 billion of capital spending.
That comparison misses one detail. Coca-Cola's 2025 figure includes a one-off $6.1 billion contingent payment tied to its fairlife acquisition. Excluding it, free cash flow was $11.4 billion, and the company guides for about $12.4 billion in 2026.
On that adjusted basis, Coca-Cola keeps roughly 24 cents of free cash flow for every dollar of revenue. PepsiCo keeps about 8 cents.
PepsiCo Stock has gone Down?
On October 8, PepsiCo lowered its 2026 core constant currency EPS growth outlook to 1% to 2%, from the low end of 4% to 6%, even as it raised its revenue forecast.
KFC Switches to Coke: How Big Is It Really?
One week after those results, on October 15, KFC announced that it will replace Pepsi with Coca-Cola at its roughly 3,700 US restaurants. The rollout begins in January 2027, with Coca-Cola products expected in every US location by spring.
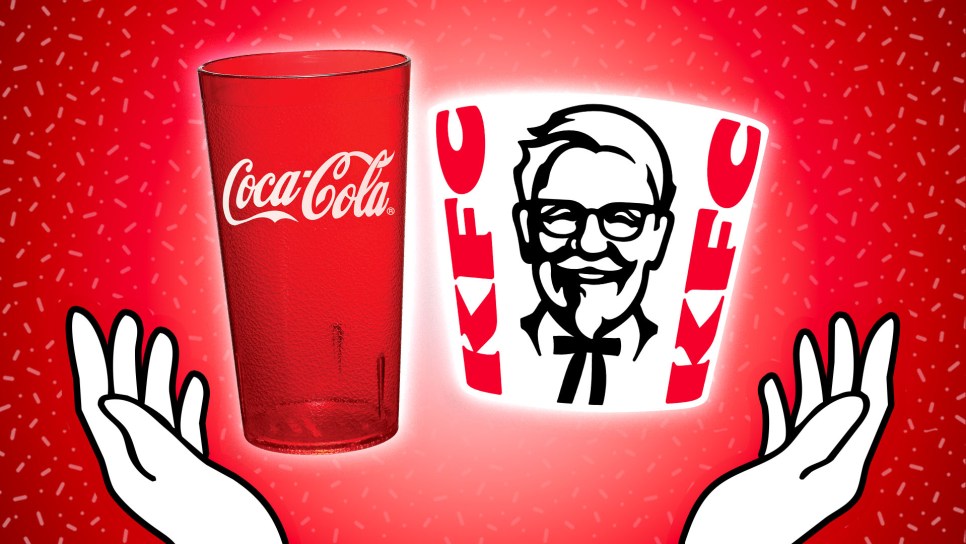
The change applies only to the US. PepsiCo remains KFC's beverage partner internationally, and Reuters reports PepsiCo recently renewed its agreements covering Taco Bell and KFC's international restaurants.
Dividends: Higher Yield vs. More Breathing Room
Both companies are Dividend Kings, with more than 50 consecutive years of dividend increases. They reward shareholders in different ways.
|
Dividend metric |
Coca-Cola (KO) |
PepsiCo (PEP) |
|
Dividend yield |
2.25% |
4.35% |
|
Annual dividend per share |
$2.12 |
$5.92 |
|
Consecutive annual increases |
60+ |
50+ (54th increase in 2026) |
|
Payout ratio (approx.) |
63% |
75% |
|
Total debt / EBITDA |
2.53x |
2.60x |
KO vs PEP Dividend Comparison Powered by StockOracle™
PepsiCo's yield is almost double Coca-Cola's, in 2026 it plans to return $8.9 billion to shareholders: $7.9 billion in dividends and $1.0 billion in buybacks.
Coca-Cola pays out a smaller share of its earnings, which leaves more room for future increases if profits keep growing.
PepsiCo also has a $10 billion buyback authorisation running through February 2030. Every share it retires means each remaining share owns a slightly larger piece of the company.
Economic Moats: What Each Company Has to Defend
Both companies are embedded in daily life in ways that are hard to dislodge:
- Restaurant fountains: multi-year supply deals with chains like KFC, McDonald's and Taco Bell
- Grocery and convenience shelves: prime placement negotiated at national scale
- Vending, stadiums and travel: exclusive pouring rights at venues and hotels
- Snack aisles (PepsiCo): Lay's, Doritos and Cheetos delivered directly to stores by PepsiCo's own network
What both moats protect is pricing power. When a brand can raise prices without losing customers, future cash flows become more predictable, and predictable cash flows are what intrinsic value models reward.

Final Thoughts on Coke vs Pepsi Stock
What supports Coca-Cola's valuation:
- Operating margins near 35%, driven by an asset-light concentrate model
- About $12.4 billion in expected 2026 free cash flow
- Volume-led growth and a raised 2026 outlook
- New foodservice wins, including KFC in the US from 2027
What supports PepsiCo's valuation:
- International organic revenue growth of 8% in Q3 2026
- An estimated 4.35% dividend yield backed by 50+ years of increases
- Cash flow models that span around $91 to $138 per share in StockOracle™
- New cost cuts and a focused push to revive its US soft drinks