KLA reported a record fiscal year on July 28, with its order backlog swelling to $12.57 billion from $7.86 billion a year earlier.
While six of the seven StockOracle™ valuation models covered here land below that price. The company that inspects everyone else's chips is now under inspection itself, so how much future growth is the market already paying for?
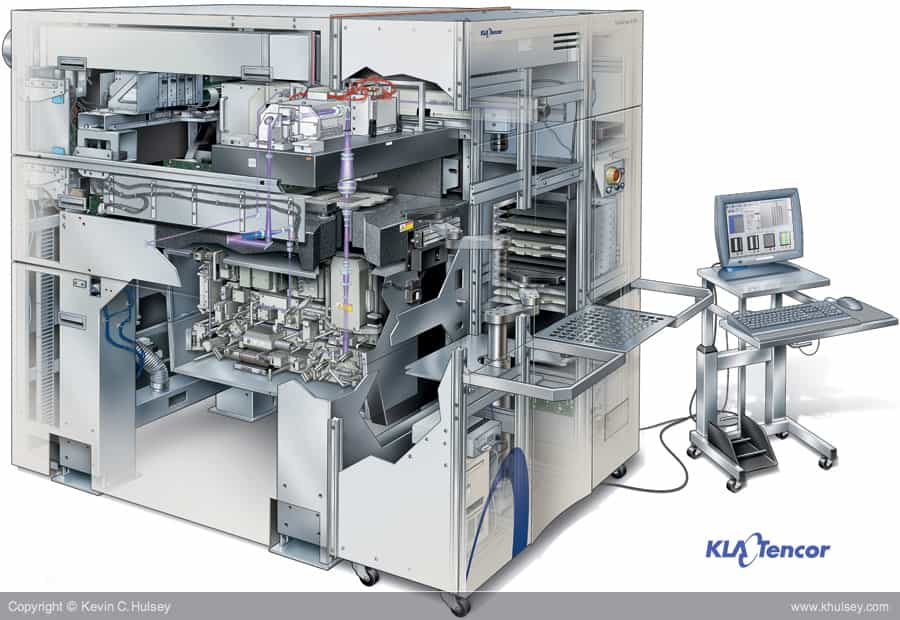
Now, before we talk about KLA Corporation (KLAC) intrinsic value, let's understand what KLAC does. KLA makes the equipment chipmakers use to find defects and measure precision during manufacturing. It doesn’t make chips, and it doesn’t make the machines that etch or deposit material onto wafers (unlike Applied Materials and Lam Research). Its job is quality control.
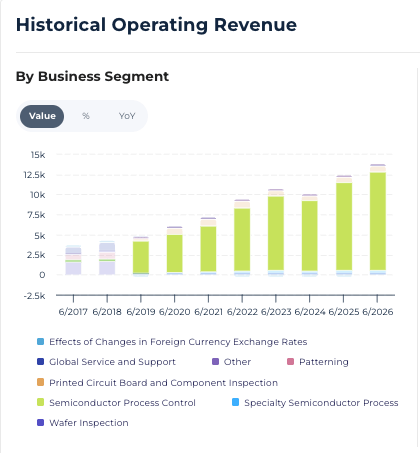
Process control is by far its biggest business. In the June quarter, the Semiconductor Process Control segment brought in $3.26 billion of the $3.66 billion total. Services are a growing recurring layer on top, with services revenue up 17% to $820 million.
What is KLA Corporation's intrinsic value?
Intrinsic value is an estimate of what a business is worth based on the cash it can generate over its life, discounted back to today. A margin of safety exists when the market price sits comfortably below that estimate.
KLAC Intrinsic Value: Six of Seven StockOracle Models Sit Below the Price
StockOracle's 20-year discounted cash flow model (DCF-20) puts KLA's fair value near $168.85 per share as of October 20, 2026. The model starts from $4,143.08 million of operating cash flow, nets $5,887.41 million of debt against $4,902.41 million of cash and short-term investments, and discounts the result at 7.43% across 1,319.63 million shares.
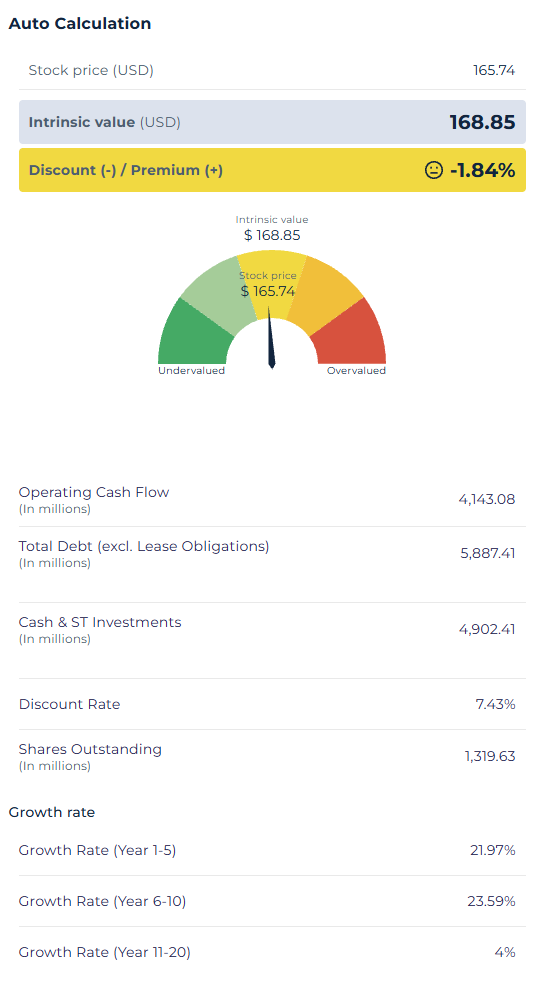
KLAC DCF-20 Calculator Assumptions Powered by StockOracle™ -- Accurate as of October 23, 2026
The other models spread out around that figure, and the spread is the story:
- DNI-20 (discounted net income): $197.00, the only model above the current share price
- DFCF-20 (discounted free cash flow): $153.46
- Mean Price-to-Book: $131.17
- Mean Price-to-Earnings: $107.93
- Mean Price-to-Sales: $96.48, built on a 12.48x current multiple
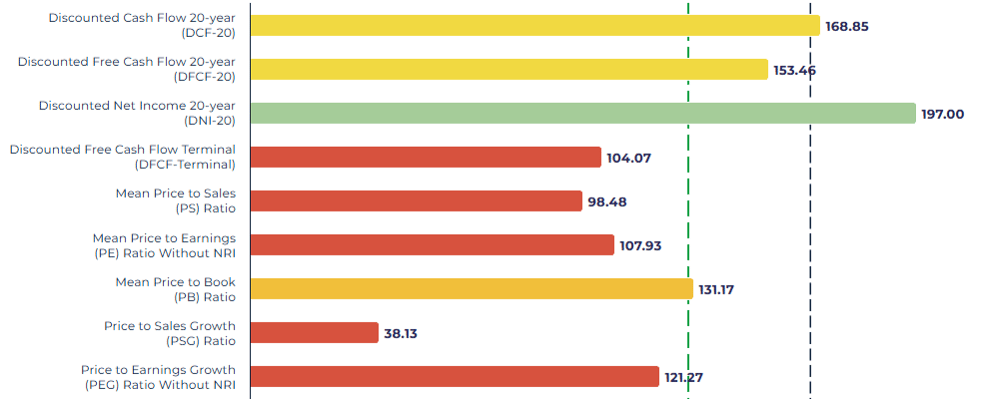
KLAC Valuation Chart Model Breakdown Powered by StockOracle™ Accurate as of October 23, 2026
Two things drive the gap. The cash-flow models only climb toward today's price when growth stays above 20% for a full decade.
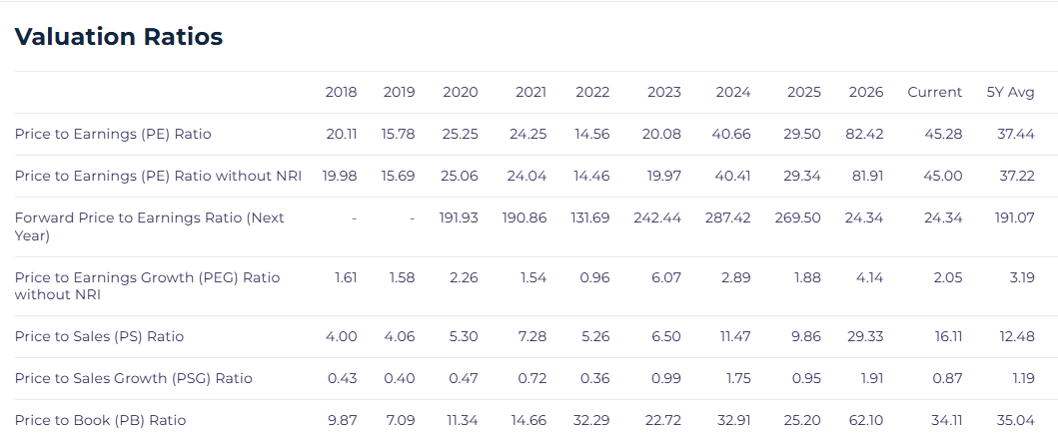
The multiple-based models assume KLA's valuation drifts back toward its own history, and today's multiples sit well above it.
The bull case says the AI buildout has permanently raised process control intensity, so the old averages no longer describe this business. The bear case says equipment demand has always moved in cycles, and a high multiple leaves little room for a slower year.
A note on data above: KLA completed a 10-for-1 stock split, with shares trading on a split-adjusted basis from June 12, 2026. All per-share figures in this article are split-adjusted.
What the DCF-20 Assumes, and What the Price Assumes
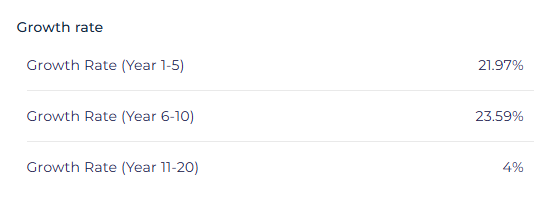
The DCF-20 assumes 21.97% annual growth in Years 1-5, then an accelerating 23.59% in Years 6-10, before settling at 4% for Years 11-20.
At 21.97%, operating cash flow doubles every 3.5 years and grows 2.70 times over five years. Together, the model assumes KLA's operating cash flow grows about 7.78 times over the decade, from $4.14 billion to roughly $32.2 billion a year.
However, the record of actual operating cash flow growth is lower: 1.50% over the past year, 4.13% a year over three years, and 13.65% a year over five. Even the 10-year pace falls short. A conservative investor building this model might consider to trim the growth rates.
Why KLAC Needs a Different Lens: It Sells the Quality Control Layer
KLA does not deposit or etch the layers on a wafer, the steps where Applied Materials and Lam Research earn most of their revenue. It sells process control: inspection and metrology systems that find defects and measure whether each layer came out as designed, plus the software and service contracts that keep those tools running.
Semiconductor Process Control delivered $12.245 billion of KLA's fiscal 2026 revenue, according to its fiscal 2026 fourth quarter results.
Think of KLA as the quality inspector on a line where each wafer carries thousands of dollars of chips. As transistors shrink, AI chips grow larger and advanced packaging stacks several dies together, a single defect destroys more value, so fabs will spend more to catch defects early.
KLA is high quality, capital light and priced at a steep multiple, yet it still rides a cyclical equipment market. For that kind of business, the sharper question is "what growth rate does today's price assume?" , and if so, “how much am i willing to pay for this growth rate?”
KLA Corporation (KLAC) Financial Performance
Revenue: Nearly Doubled Since 2021, With a Cyclical Dent
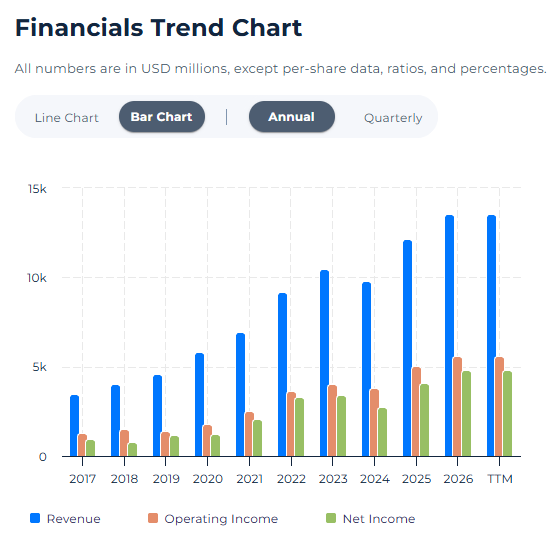
KLAC Revenue Trend Powered by StockOracle™ Accurate as of October 20, 2026
Revenue has almost doubled in five years, from $6.92 billion in 2021 to $13.57 billion in 2026. The path was not smooth: revenue fell about 6% in fiscal 2024 during the industry's last spending downturn, then recovered 24% the following year. That dip is a reminder that KLA's growth still follows the wafer fab equipment cycle, even when its share of that spending rises.
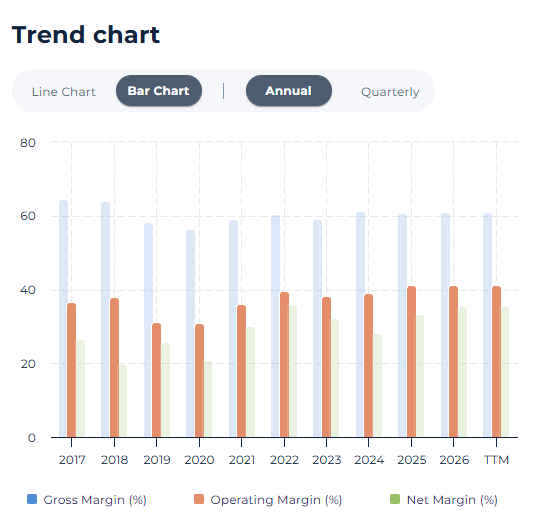
Profitability has improved faster than sales. Operating margin reached 41.35%, above both its 5-year average of 39.93% and 10-year average of 37.27%. That margin expansion is the operating leverage the growth case depends on.
KLAC Free Cash Flow: Capital Light, but Tied Up in Inventory
For a toolmaker that barely needs to expand its own factories, the gap between operating cash flow and free cash flow is small. Capital spending was just $375.95 million in fiscal 2026, under 3 cents of every revenue dollar, leaving free cash flow of $3.77 billion.
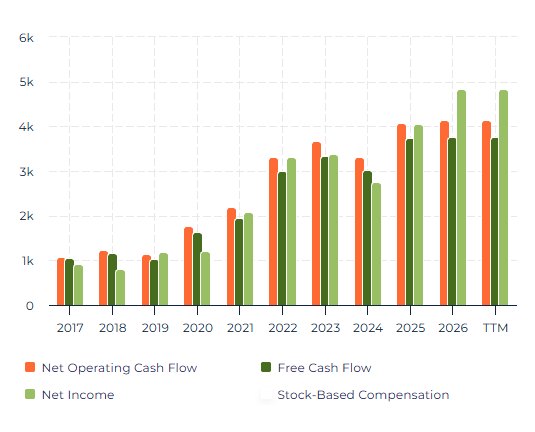
Operating Cash Flow and Free Cash Flow Chart Powered by StockOracle™ Accurate as of October 23, 2026
That works out to roughly 28 cents of free cash flow for every dollar of revenue, a 27.76% margin. It is lower than the 5-year average of 30.79%, because operating cash flow grew only 1.50% while revenue grew 11.72%.
The reason is working capital. KLA holds $3.65 billion of inventory, equal to about 236 days of cost of sales, and its cash conversion cycle runs 274 days versus a 5-year average of 267.
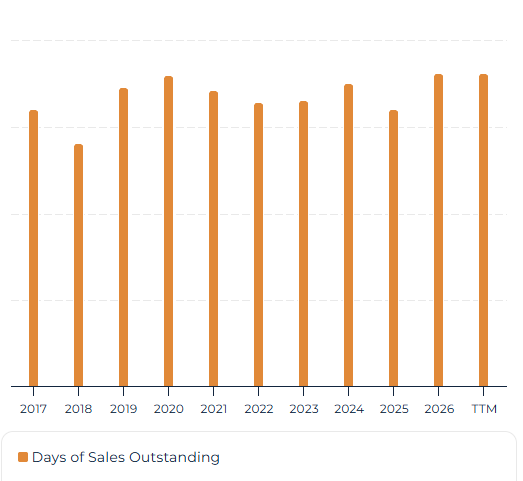
Days Sales Outstanding has also trended higher since 2018. A sign that customers are taking longer to pay even as revenue grows, adding another drag alongside the inventory buildup already discussed.
Complex inspection tools take months to build and ship, so a growing backlog absorbs cash before it releases it. That matters for valuation because the DCF-20 starts from operating cash flow: if inventory unwinds as backlog converts, the base year looks conservative; if it keeps building, cash flow keeps lagging earnings.

Returns on Capital: ROIC Tells the Clean Story of KLAC
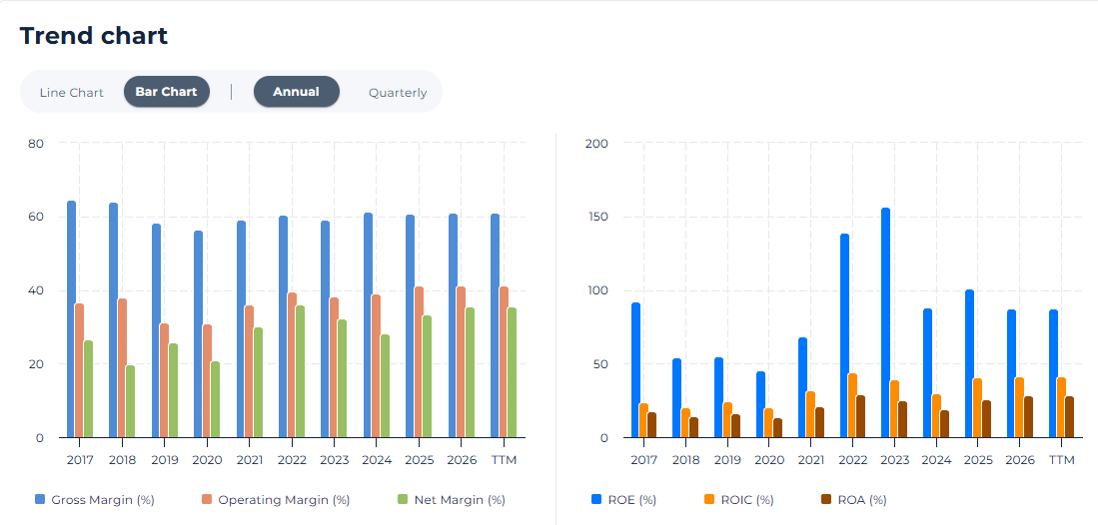
KLAC Margins and Returns Trend Powered by StockOracle™- Accurate as of October 19, 2026
Return on invested capital (ROIC) sits at 41.67%, up from a 10-year average of 31.65%. ROIC is the cleaner read here because years of buybacks have shrunk KLA's equity base, which inflates return on equity.
Earning more than 40 cents a year on each invested dollar points to pricing power. Debt sits at just 0.98 times EBITDA, so the balance sheet carries little strain.
Shareholder Returns of KLA Corporation (KLAC)
KLA paid $1.06 billion in dividends and bought back $2.29 billion of stock in fiscal 2026, about 89% of free cash flow. Diluted shares have fallen about 15% since fiscal 2021, so each remaining share now owns a larger piece of the company. The board added a $7 billion repurchase authorization in March, alongside a 21% dividend increase.
Growth Catalysts: Where the 20%-Plus Assumption Has to Come From
Backlog, Advanced Packaging, and AI Chip Complexity
- Backlog reached $12.57 billion at June 30, 2026, up about 60% from $7.86 billion a year earlier, according to KLA's fiscal 2026 annual report.
- KLA expects advanced packaging process control revenue of about $1.1 billion in calendar 2026, up more than 70%, per its Q4 FY2026 shareholder letter.
- Management raised its calendar 2026 wafer fab equipment outlook to the low $150 billion range, from "$140 billion plus."
- September quarter guidance calls for revenue of $4.0 billion, plus or minus $200 million, above the $3.66 billion June quarter.
A backlog that large turns part of next year's growth into scheduled deliveries. Beyond that window, the model's growth rates look more plausible if process control keeps taking a larger slice of each fab budget.
Services: The Recurring Base Under a Cyclical Business
- Services revenue reached $820 million in the June quarter, up 17% year over year.
- Fiscal 2026 marked KLA's 17th consecutive year of annual services revenue growth.
- Services make up roughly 23% of total revenue, per the fiscal 2026 annual report.
Every installed tool creates years of service work, and that base grows even when new orders slow. This recurring layer helps explain why operating margin held at 39.03% in fiscal 2024 even as revenue fell.
The Risk Layer: China and Memory Pricing
China accounted for about 30% of fiscal 2026 revenue, down from 33% a year earlier, and 26% in the June quarter.
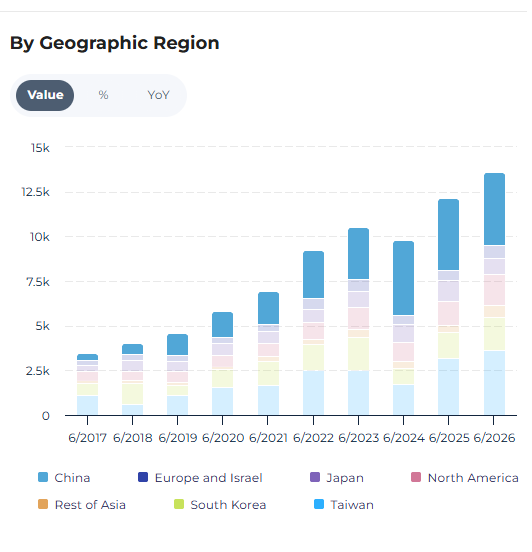
In April, the U.S. Commerce Department ordered KLA, Applied Materials and Lam Research to halt some shipments to Hua Hong, China's second-largest chipmaker. Management also flagged memory pricing as a gross margin headwind. Either factor could slow the growth path the DCF-20 depends on.
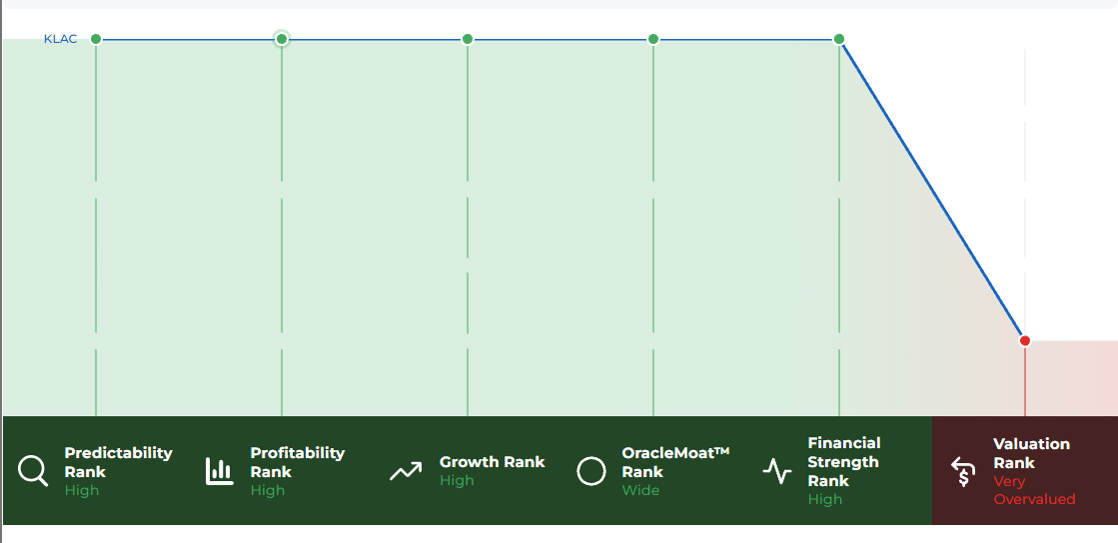
Economic Moat: Why StockOracle™ Rates KLAC a Wide Moat
StockOracle™ rates KLA a Wide Moat business. The moat comes from how deeply KLA's tools and data sit inside a fab's production flow:
- Wafer defect inspection at the leading-edge logic nodes where AI accelerators are built
- Reticle and photomask inspection, where a single mask flaw repeats across every wafer it prints
- Overlay and dimensional metrology, confirming that each layer lines up with the one beneath it
- Advanced packaging inspection for chiplets and high-bandwidth memory stacks
- Yield software and installed-base services that tie thousands of measurements into one defect picture and keep the fleet calibrated for years
Switching away from KLA mid-node is like replacing a hospital's diagnostic lab while patients are on the operating table: engineers have tuned recipes and defect libraries around KLA data, and any detection gap shows up as lost yield.
Competitors carry specific advantages, not copycat products. Applied Materials is pushing its PROVision eBeam metrology and SEMVision defect review tools, and can bundle them with its deposition and etch systems. ASML pairs YieldStar optical metrology and HMI e-beam inspection with the lithography scanners they calibrate. Hitachi High-Tech holds the top global share in CD-SEM critical dimension measurement. Lasertec sells ACTIS actinic inspection systems for EUV masks, a specialized niche that grows with EUV adoption.
KLAC has to defend each front.
Its protection however is breadth: no single rival covers wafer and mask inspection, metrology, packaging, software and service at KLA's scale, which supports its pricing power and 60%-plus gross margins.
Final Thoughts on KLA Corporation's Intrinsic Value
- StockOracle™ rates KLA a Wide Moat business, built on inspection and metrology tools that fabs rely on more as chips grow more complex.
- ROIC of 41.67% sits well above its 10-year average of 31.65%, evidence of real pricing power.
- A capital-light model turns about 28 cents of each revenue dollar into free cash flow, and about 89% of it went back to shareholders in fiscal 2026.
- A $12.57 billion backlog and roughly $1.1 billion of expected advanced packaging revenue give the near-term growth case hard support.
- The StockOracle models covered here range from $96.83 (Mean P/S) to $197.00 (DNI-20), with only DNI-20 above today's share price, and by our reverse DCF the price implies about 24% annual cash-flow growth for a decade.
- China at about 30% of revenue and memory pricing pressure are the two variables most likely to test that assumption.
The market's enthusiasm reflects a genuine shift: process control is taking a larger share of every AI-era fab. The open question is whether KLA can compound cash flow faster over the next decade than over its best one. If backlog converts and inventory releases cash, the fair-value range has room to climb; if the equipment cycle cools first, the history-based models show how far it can fall.