|
Key Points :
|
PepsiCo sells more than $90 billion of snacks and drinks a year, yet the market is now pricing it at roughly 14 times forward earnings, the lowest multiple in five years and about a third below its five-year average of around 21x .
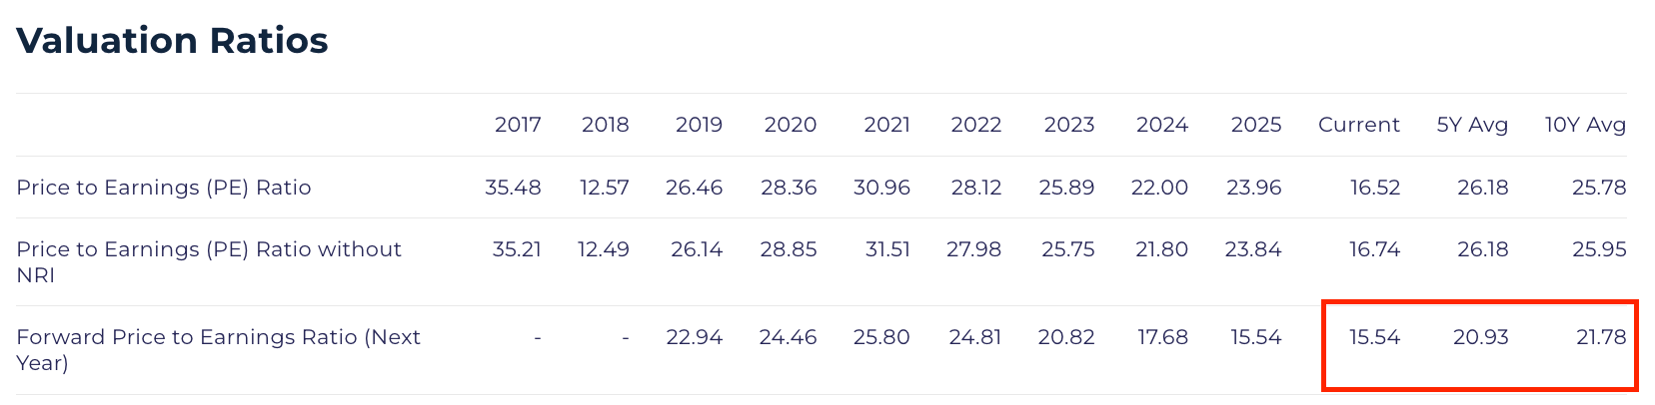
That reset came even as PepsiCo beat third-quarter revenue and earnings estimates.
When a household-name compounder gets marked down this hard, one question matters more than the headlines: what is the PEP intrinsic value, and is the market's pessimism already baked in?
What Is PepsiCo (PEP) Intrinsic Value Today?
Intrinsic value is an estimate of what a business is truly worth, based on the cash it can generate in the future, discounted back to today. Comparing that estimate with the market price helps investors judge whether they have a margin of safety, a cushion in case their assumptions turn out too rosy.
PepsiCo (PEP) intrinsic value based on its 20-year discounted cash flow model (DCF-20) on its own lands at around $138.24 per share.
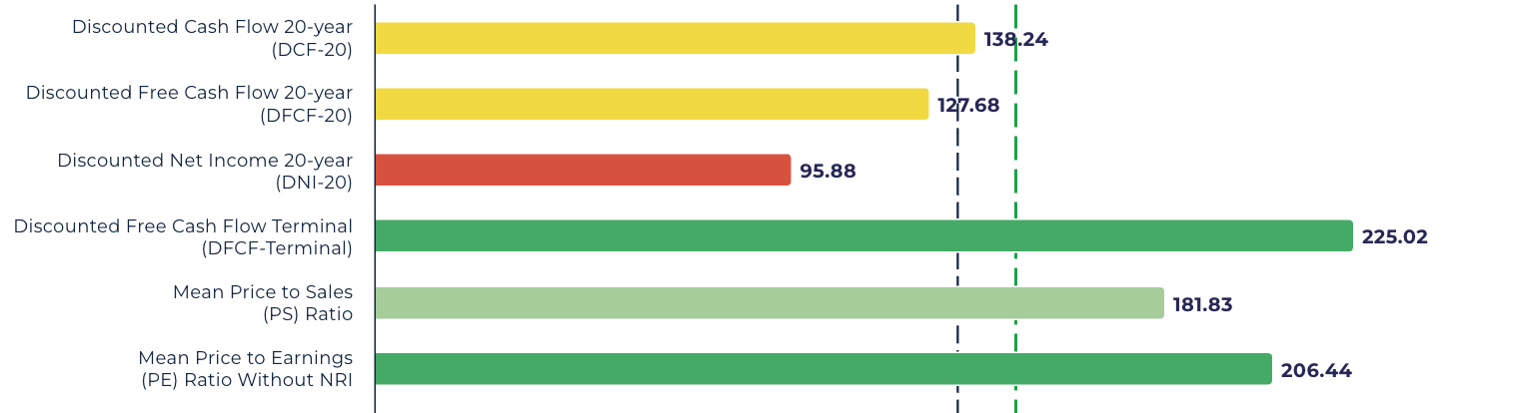
PEP Valuation Chart accurate as of 23rd October 2026 - Powered by StockOracle™
The individual methods tell a clearer story. Cash-based models built on recent free cash flow and net income sit near $91 to $96, while models anchored to PepsiCo's historical price multiples reach $182 to $206.
Think of it like asking various appraisers to value the same house: the answer depends on whether they look at rental income, recent sales nearby, or the neighborhood's past prices.
That spread is a reminder that every PEP fair value figure is only as reliable as the assumptions feeding it, which is why the rest of this article walks through those assumptions one by one.
PepsiCo Valuation: Revenue Growth
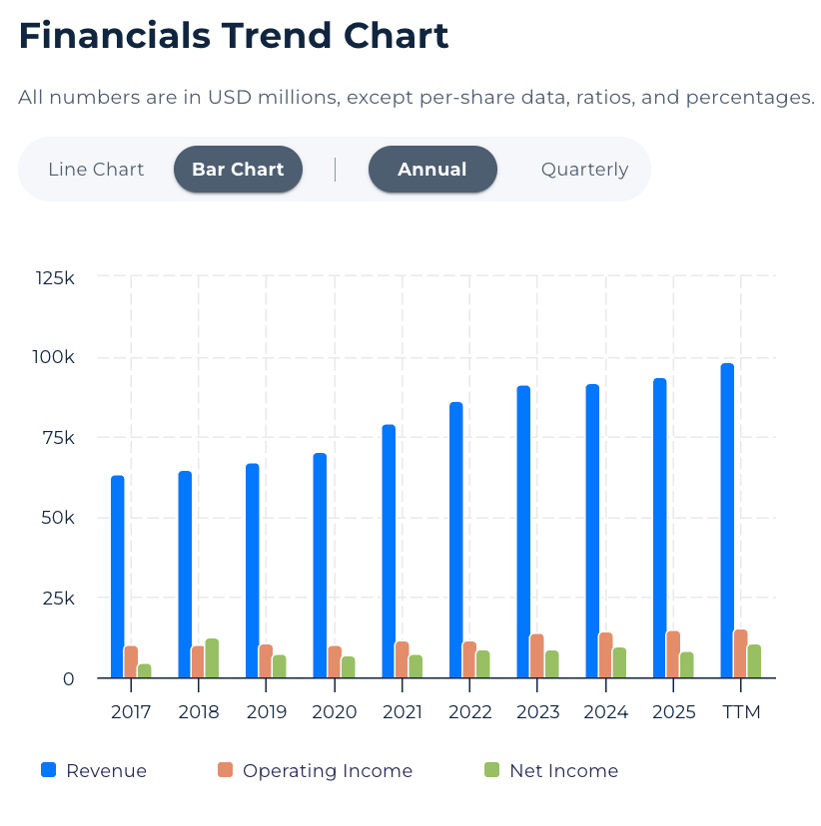
PEP Revenue Trend Powered accurate as of 23th October 2026 by StockOracle™
PepsiCo grew Q3 2026 net revenue 5.6% to $25.3 billion, with 3.1% organic growth. The growth engine has shifted overseas: LatAm Foods grew 14%, Asia Pacific Foods 10%, and Europe, Middle East and Africa 8%.
Meanwhile, PepsiCo Foods North America revenue was flat and its core operating profit fell 12%, after PepsiCo cut prices by up to 15% on brands like Lay's and Doritos to win back price-sensitive shoppers. Think of it as a shopkeeper lowering prices to fill the store again: traffic returns first, profits follow only if customers stay once prices normalise.
Free Cash Flow: The Number Behind PepsiCo Intrinsic Value
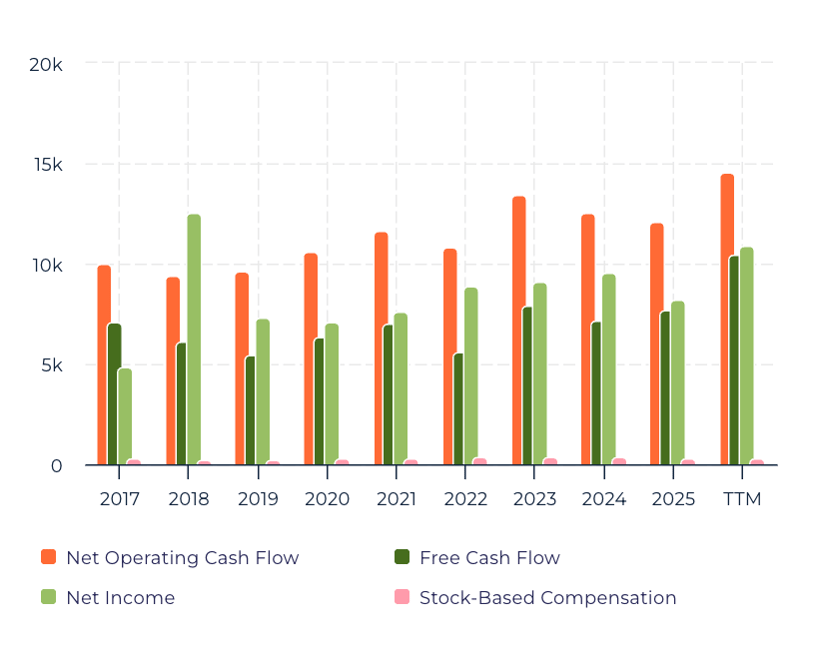
Operating Cash Flow and Free Cash Flow Chart accurate as of 23th October 2026 Powered by StockOracle™
Topline growth is the headline. Free cash flow is the receipt. It is the cash left after PepsiCo pays for everything it needs to run and grow the business.
Over the trailing twelve months, PepsiCo generated $14.6 billion in operating cash flow and $10.5 billion in free cash flow, a 10.7% FCF margin. That works out to roughly 11 cents of real cash for every dollar of revenue, up from about 8 cents in fiscal 2025, when free cash flow was $7.7 billion.
Because a DCF model is ultimately a bet on future cash, whether PepsiCo sustains closer to $10.5 billion or settles back near $7.7 billion is the single biggest swing factor in any PepsiCo intrinsic value estimate.
PEP Dividend: Yield, Track Record, and Coverage
For many investors, PepsiCo's dividend is a big part of its valuation story. In 2026, PepsiCo raised its quarterly dividend 4% to $1.48 per share, or $5.92 annualised, marking its 54th consecutive annual increase . It has also paid a quarterly cash dividend every quarter since 1965.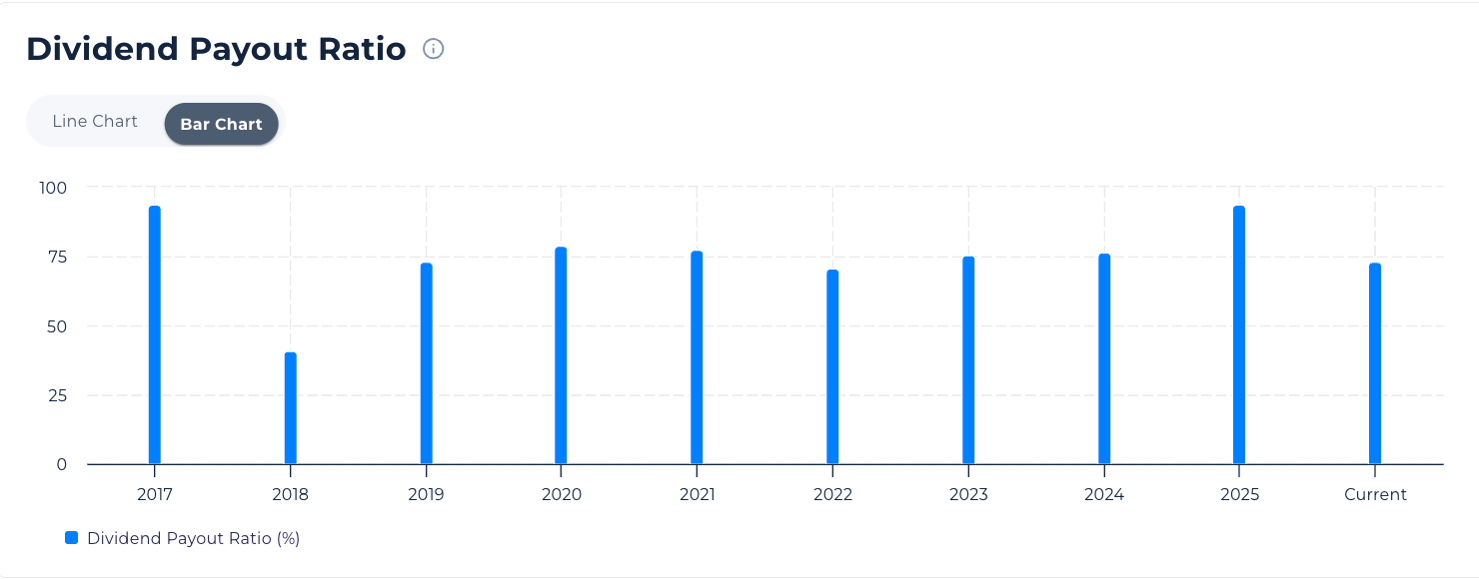
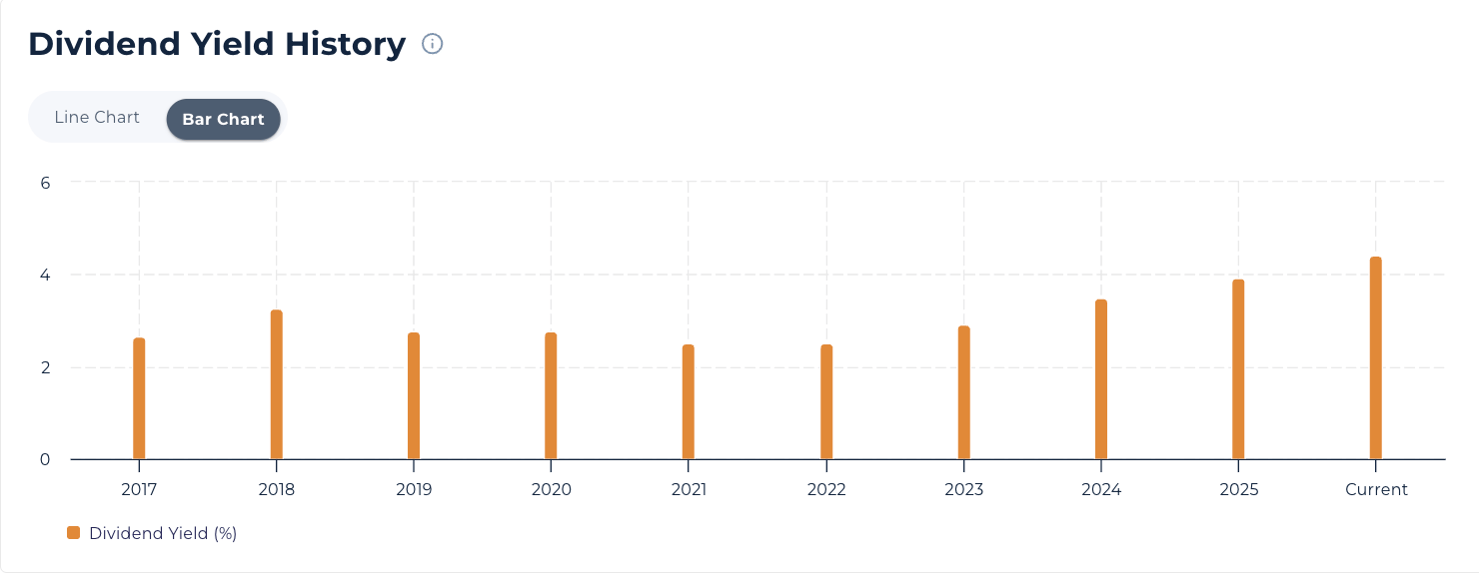
PEP Dividend Yield History and Dividend Payout Ratio Powered by StockOracle™
|
Dividend Metric |
Figure |
|
Quarterly dividend |
$1.48 |
|
Annualized dividend |
$5.92 (up from $5.69) |
|
Dividend yield |
~4.4% (based on a $133.57 share price on October 20, 2026) |
|
Consecutive annual increases |
54 years |
|
Payout ratio |
~71% of the midpoint of 2026 core EPS guidance (~$8.38) |
|
Planned 2026 dividends |
$7.9 billion |
A 54-year streak puts PepsiCo among the "Dividend Kings," companies with 50 or more straight years of increases. That streak has held through recessions, inflation spikes, and the 2020 pandemic, a record of management treating the dividend as a priority.
Is the PepsiCo Dividend Covered?
The cleanest test is to compare dividends with free cash flow, the cash actually available to pay them:
Fiscal 2025: dividends of $7.6 billion against free cash flow of $7.7 billion, close to 100% of free cash flow
Trailing twelve months: dividends of $7.9 billion against free cash flow of $10.5 billion, about 75% of free cash flow
What the Dividend Means for PEP Intrinsic Value
A high yield can reflect a durable cash machine, or a market that doubts future growth. With a payout ratio near 71% and 2026 core EPS growth guided at just 1% to 2% in constant currency, future dividend raises are likely to track earnings growth closely.
Alongside dividends, PepsiCo plans $1.0 billion in buybacks in 2026, bringing total planned shareholder returns to $8.9 billion. Buybacks mean each remaining share owns a slightly larger piece of the company.
Dividends are never guaranteed and can be reduced if earnings or cash flow weaken.
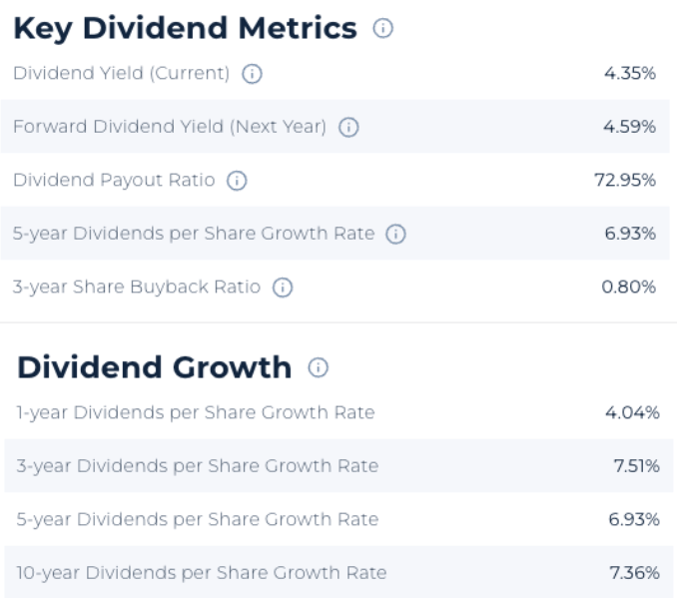
Key Dividend Metrics and Dividend Growth Powered by StockOracle™
PepsiCo (PEP) Shareholder Returns
PepsiCo expects to return $8.9 billion to shareholders in 2026: $7.9 billion in dividends and $1.0 billion in buybacks. In 2026 it also raised its dividend for the 54th consecutive year.
Buybacks mean each remaining share owns a slightly larger piece of the company. The trade-off is a high payout ratio, so dividend growth from here leans on earnings and cash flow growing alongside it.
Growth Catalysts That Shapes PEP Growth Rates
1. A North America Repair Plan
- Q3 core earnings per share of $2.34 beat the $2.30 consensus estimate
- Full-year core constant currency EPS guidance was lowered to +1% to +2%, from the low end of +4% to +6%
- Management is identifying additional structural cost reductions to fund growth investments and offset input cost inflation
- PepsiCo plans low to mid single-digit snack price increases in late 2026 or early 2027, still below pre-cut levels
The guidance cut resets expectations to a lower bar. The key signal for valuation is whether snack volumes hold once prices tick back up.
2. International Momentum
- Every international segment grew net revenue between 8% and 14% in Q3
- International core constant currency operating profit rose 9% to 19% across all four segments
- Asia Pacific Foods core operating profit climbed 20%
Growth from markets where PepsiCo already operates is typically more predictable than building new ones from scratch. If internationals keep compounding while North America stabilizes, near-term growth assumptions start to look more plausible.
PepsiCo's Economic Moat
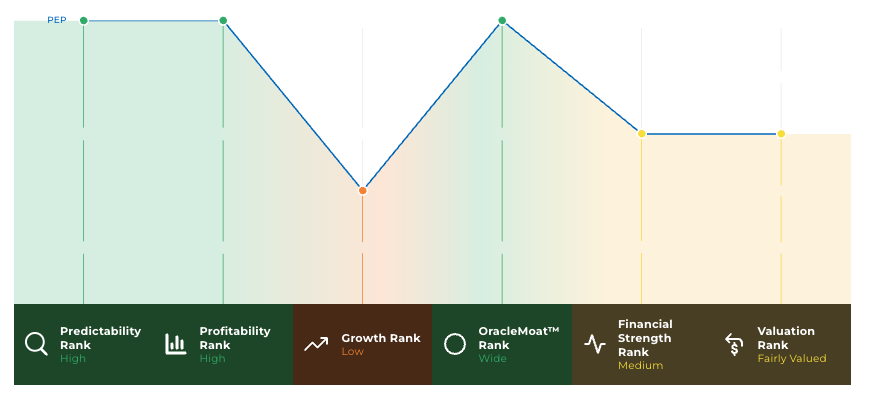
PepsiCo is embedded in everyday life across many daily occasions:
- Salty snacks (Lay's, Doritos, Cheetos, Ruffles)
- Carbonated soft drinks (Pepsi, Mountain Dew, 7UP outside the U.S.)
- Sports and hydration drinks (Gatorade)
- Breakfast (Quaker)
- Convenience store, gas station, and vending shelf space
- Foodservice and restaurant fountain contracts

Its direct-store-delivery network works like a private highway onto retail shelves across North America, letting PepsiCo restock, merchandise, and launch products faster than rivals relying on warehouses alone.
Competitors carry their own embedded advantages. Coca-Cola owns arguably the most valuable beverage brand in the world and an asset-light bottling system that delivers higher margins. Mondelez leads global snacking in cookies and chocolate. Retailer private labels hold the shelf itself and can undercut on price. PepsiCo has to defend against each of these through brand investment, distribution scale, and the ability to sell snacks and drinks together to the same retailer.
What the moat protects:
- pricing power over time
- shelf space
- decades-long retailer relationships.
DIY DCF: A Conservative PepsiCo Valuation Check
To stress-test the PEP intrinsic value, here is a deliberately conservative scenario:
|
Assumption |
Input |
|
Starting free cash flow |
$7.7B (fiscal 2025, not the higher trailing figure) |
|
FCF growth, Years 1 to 5 |
4% |
|
FCF growth, Years 6 to 10 |
3% |
|
Terminal growth |
2.5% |
|
Discount rate |
8% |
|
Net debt |
~$41B |
|
Shares outstanding |
~1.36B |
Under these inputs, the estimated intrinsic value lands at about $84 per share. Swap in the trailing $10.5B of free cash flow with every other input unchanged, and the estimate rises to about $125 per share.
That gap tells the whole story. A higher market price implies investors expect PepsiCo to hold most of its recent cash flow improvement, or grow faster than 4% once North America stabilizes. If either falls short, the conservative case becomes the more relevant anchor.

Final Thoughts on PEP Intrinsic Value
- Forward P/E near 14x, the lowest in five years
- Trailing free cash flow of $10.5B, up from $7.7B in fiscal 2025
- International segments growing 8% to 14%
- 54 consecutive years of dividend increases
- $8.9B in planned 2026 shareholder returns
- Structural cost cuts underway to rebuild North American margins
The market is clearly skeptical after the guidance cut, and North American snacks remain a real risk. Yet the underlying business still produces substantial cash and holds a durable distribution moat.