GE Vernova’s orders surged 88% organically to $24.2 billion last quarter, pushing its backlog to $176 billion, more than four years of trailing revenue booked in advance. That’s a lot of demand for a business that has only stood on its own since April 2024, when General Electric spun off its power, wind and electrification units as GE Vernova and renamed what remained GE Aerospace.
The stock still fell on the day it reported those numbers, because adjusted earnings missed Wall Street’s estimate even as Power and Electrification posted record demand.
GE Vernova trades near 26.37 times trailing earnings and close to 37.71 times forward earnings, a gap between today’s earnings and tomorrow’s expected earnings that only makes sense if the backlog keeps converting on schedule.
What is GE Vernova's intrinsic value?
Intrinsic value is an estimate of what a business is actually worth, based on the discounted cash it can realistically generate over its lifetime, not whatever price the market assigns it on a given trading day.
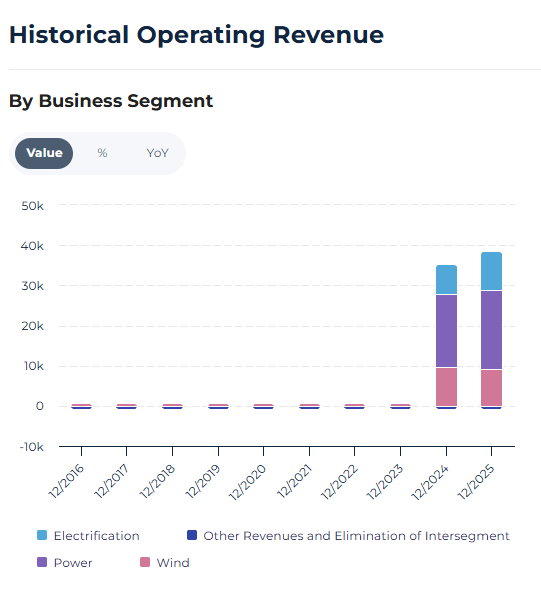
GE Vernova, spun off from General Electric in April 2024, runs three segments that behave nothing alike: Power (gas, steam, and nuclear turbines and services), Wind (onshore and offshore turbines, historically loss-making), and Electrification (grid equipment and software).
Getting to a sensible GEV intrinsic value means weighing which of those three segments is actually generating the cash a model relies on, and staying honest about how little standalone history there is to model from. GE Vernova has only two full fiscal years of results as an independent company, so multi-year averages here deserve more caution than they would at a business with a decade of reported financials behind it.
GEV Intrinsic Value: What StockOracle's Models Show
GE Vernova's consolidated free cash flow did not move in a smooth trajectory, and that is the first thing to understand before trusting any single fair-value number.
The Power segment is strongly cash-generative. The Wind segment remains a drag on consolidated results. Any GEV valuation model has to blend two segments pulling in opposite directions, not treat the business as one uniform cash machine.
Run GE Vernova through StockOracle's Mean Price-to-Sales model, the output closest to where the stock actually trades, and fair value lands near $791.48 per share, built off a price-to-sales ratio of 5.17. Of StockOracle's full valuation suite for GEV, might be the most grounded figure, since it does not lean on the thin two-year earnings history the way an earnings-based model does.
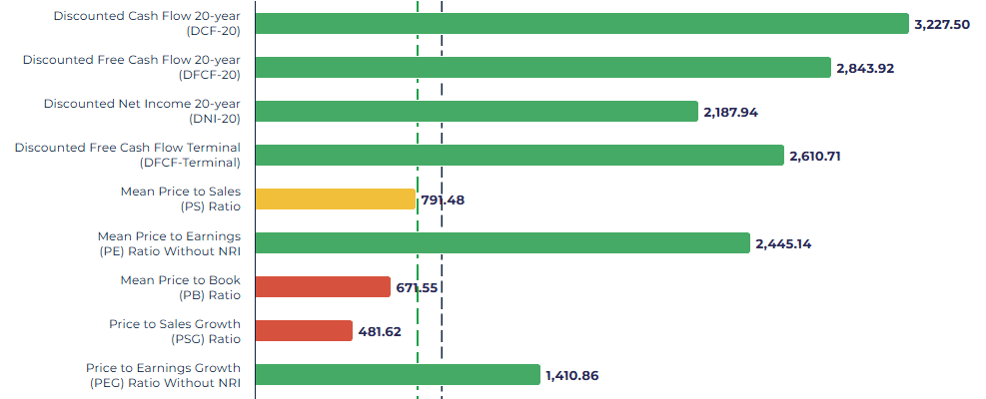
GEV Valuation Model Breakdown, Powered by StockOracle™. Accurate as of 10 October 2026.
The rest of StockOracle's models show how wide that spread gets once the calculation leans on earnings or a full cash-flow projection instead:
- DCF-20: $3,227.5, built by extrapolating GE Vernova's 26.89% near-term projected EPS growth rate across the entire 20-year model window
- DFCF-20: $2,843.92
- DNI-20: $2,187.94
- Mean P/E (no NRI): $2,445.14, on a P/E ratio of 69.15, skewed by GE Vernova's short earnings history
A spread that runs from roughly $672 to roughly $3,262. Two things explain it. First, GE Vernova has only two full fiscal years of standalone earnings to build a P/E-based model from, so both the Mean and Median P/E outputs are working off a thinner base than a company with a decade of reported history would provide.
Second, current discount rate for GE Vernova is 10.59%, but that figure has swung meaningfully since the spinoff (5.90% in fiscal 2024, 13.15% in fiscal 2025) as the market recalibrates the stock's beta as a newly independent name.
A discount rate still finding its footing adds real uncertainty to any single-point valuation output.

The DCF-20 figure deserves its own scrutiny. It is closer to a best-case scenario in which GE Vernova keeps compounding at its current backlog-driven pace for two full decades without a slowdown, a stretch even against $176 billion of booked backlog today.
Treat the DCF-20 output as an upper-bound scenario due to uncertainty in GEV’s business, not as this article's fair-value anchor.
A more grounded read leans on the Mean P/S output above, alongside projected EPS growth estimate of 18%. Order backlog as a supplementary lens. For a subscription software business, a backlog figure is usually seen as a soft signal. For a capital-goods business like GE Vernova, where lead times run years and equipment is only recognized as revenue once it is built, tested, and shipped, backlog behaves closer to contracted future revenue.
GE Vernova's book-to-bill ratio, orders divided by revenue, reached 2.18 for the quarter alone, and Electrification's book-to-bill ran near 1.7, both signs that near-term demand is outrunning what the company can currently recognise as sales.
GE Vernova (GEV) Financial Performance
Revenue Growth: Power and Electrification Doing the Heavy Lifting
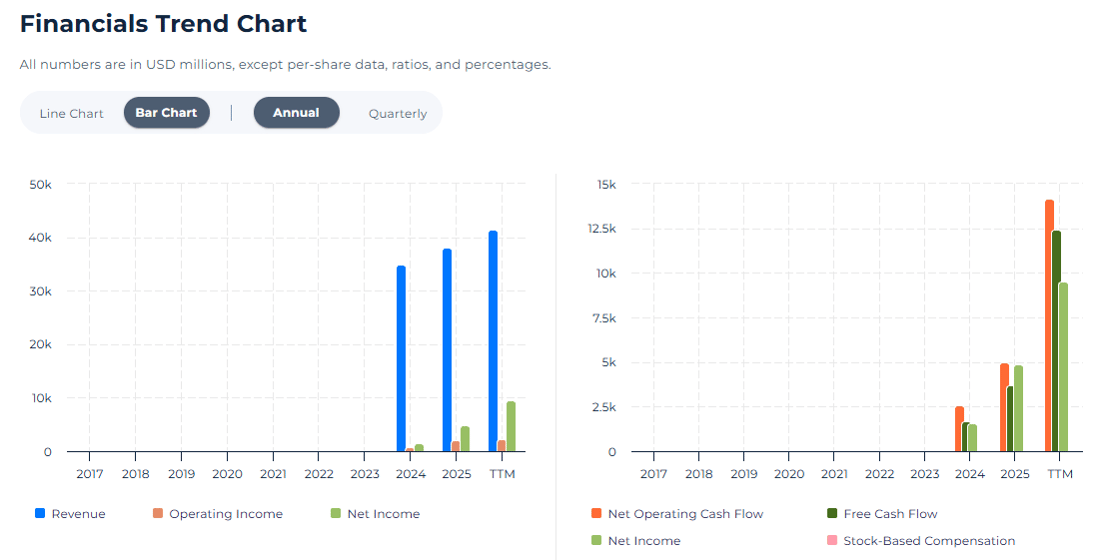
GEV Revenue Trend, Powered by StockOracle™. Accurate as of 10 September 2026.
GE Vernova's trailing twelve-month revenue reached $41,334 million, up from $38,062 million in fiscal 2025. Inside that trend, GE Vernova's second-quarter 2026 revenue grew 22% year over year, with Electrification up 68% to $3.6 billion and Power up 14% to $5.5 billion, both driven by orders converting into recognised revenue as data-center and grid-electrification demand builds.

Wind was the outlier, with revenue falling 10% to $2.0 billion, a reminder that this is a three-segment story growing at three different speeds.
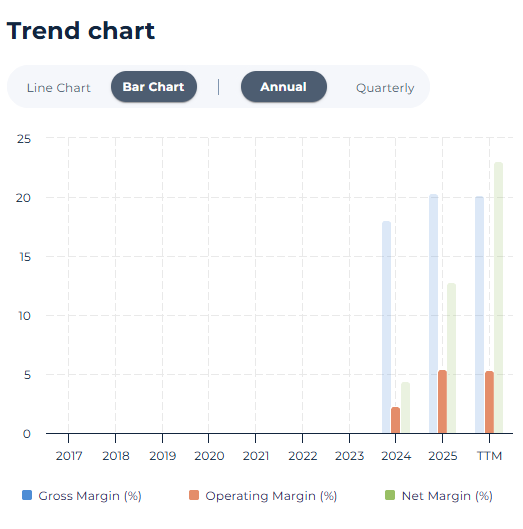
The clearer read sits in the operating margin line. Operating margin climbed from 2.25% in fiscal 2024 and held at 5.32% on a trailing twelve-month basis. That progression could be a genuine margin recovery, unrelated to the one-off items that inflate GE Vernova's net income line, and it is the real story behind the company's improving profitability, not the much larger jump visible in trailing net income.
GEV Free Cash Flow: The Segment Mix Behind the Number
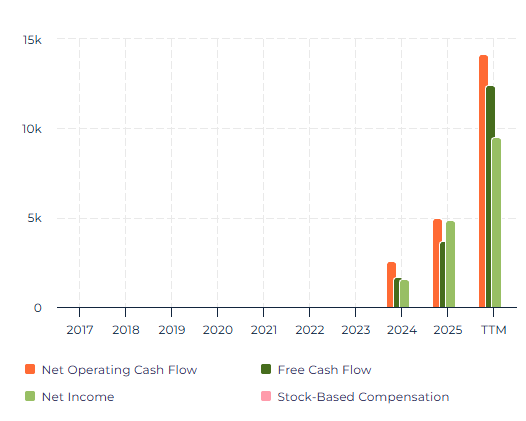
Operating Cash Flow and Free Cash Flow Chart, Powered by StockOracle™. Accurate as of 10 October 2026.
A discounted cash flow model is ultimately a bet on one idea: how much cash the business will throw off, year after year. Free cash flow, the cash left after the business funds its operations and capital spending, is what tells you whether GE Vernova's order boom is actually turning into money the company can bank, not just work it has agreed to do.
GEV free cash flow reached $5.1 billion in the second quarter alone, more than the company generated in all of fiscal 2025, and $9.9 billion for the first half of 2026. Management raised full-year 2026 free cash flow guidance to $11.5 billion to $12.5 billion, up sharply from just two quarters earlier.
Trailing FCF margin of 30.09% looks exceptional, but like net income, it is inflated by the same one-off items detailed below.
Fiscal 2025's FCF margin of 9.75% might be the cleaner read, and it still represents a real improvement off a low base for a company only two years removed from its spin-off, with a trailing FCF yield of 4.74% at today's price. Capital intensity is part of why that margin still has room to grow: trailing capital expenditure equals 77% of operating income and about 4% of revenue, the cost of expanding gas turbine production capacity toward management's 30-gigawatt 2030 target.
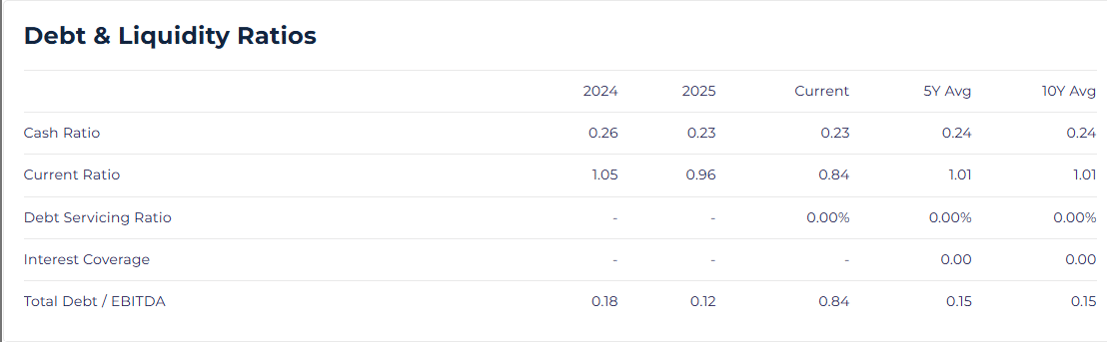
However, GE Vernova's balance sheet gives it room to keep funding that build-out, with debt at just 0.84 times EBITDA, relatively low leverage for a capital-intensive industrial name.
Shareholder Returns of GE Vernova (GEV): Early, But Growing
Management doubled the quarterly dividend to $0.50 per share and raised the buyback authorisation to $10 billion from $6 billion, with $3.3 billion already deployed as of early December 2025. This is still an early-stage capital-return program for a company barely two years past its spin-off, not the multi-decade streak of a legacy industrial, but the direction and the funding behind it both point the same way.
One more number is worth holding onto before moving to the growth story: Rule of 40 score for GE Vernova, combining revenue growth and FCF margin, sits at 18.94%, well under the 40% threshold growth investors often use as a quality bar.
Growth Catalysts
Gas Turbines Sold Out for Years, Riding the Data-Center Power Boom
- Gas turbine equipment backlog and slot reservations reached 116 gigawatts by the end of the second quarter of 2026, up 16 gigawatts in a single quarter, with management targeting at least 125 gigawatts under contract by year-end 2026.
- Production capacity is ramping from roughly 20 gigawatts in 2026 toward 24 gigawatts by 2028 and a 30-gigawatt target by 2030.
- Power segment orders climbed 134% organically to $16.7 billion in the quarter, the clearest sign yet that data-center power demand is converting into firm contracts, not just inquiries.
- Electrification orders grew 66% organically to $6.3 billion, with data-center-linked orders alone exceeding $5 billion year-to-date, more than double all of 2025.
- Management's multi-year outlook, raised in December 2025, now targets $52 billion of 2028 revenue, a 20% adjusted EBITDA margin, $22 billion-plus of cumulative 2025-2028 free cash flow, and total backlog near $200 billion by the end of 2028.
This is the evidence behind the near-term growth tier: gas turbine slots booked years in advance and a rapidly compounding Electrification backlog both support the case that Power and Electrification can keep growing faster than the overall company average, even as the much smaller, negative-margin Wind segment continues working toward breakeven.
Wind's Path to Breakeven: The Catalyst Still Unresolved
- Wind orders fell roughly 40% organically, and Wind's share of total company orders dropped from 13% in 2025 to just 5% in the second quarter of 2026.
- Management has guided third-quarter Wind revenue to decline by low double digits year over year before improving in the second half, though the company has not disclosed a specific breakeven timeline.
- Segment headwinds include weak onshore demand, higher offshore project costs, and fixed-price legacy contracts that limit near-term pricing flexibility.
Wind is now small enough, roughly 5% of orders, that it is no longer the swing factor in consolidated growth. It remains the swing factor in consolidated free cash flow until its margin turns positive, which is why the FCF and net-income figures above still carry Wind's drag rather than an already-completed turnaround.
Economic Moat: What Protects GE Vernova's Business
StockOracle rates GE Vernova No Moat. That is a meaningful data point on a stock trading at a premium multiple to its own trailing earnings, and it is worth stating plainly rather than explaining away: two years into its life as a standalone company, GE Vernova has not yet built the kind of durable, quantifiable competitive advantage that would earn it a Narrow or Wide Moat rating.
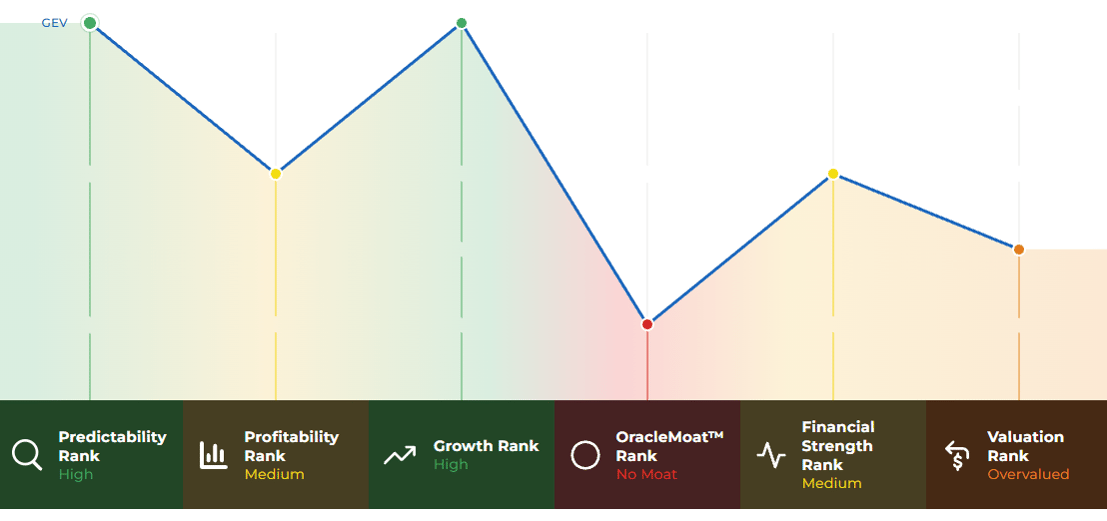
That does not mean GE Vernova has no structural strengths, only that none has yet shown up as a proven moat in OracleMoat’s assessment.
- A vast installed base of gas turbines worldwide, each one requiring decades of parts, upgrades, and service work that GE Vernova is positioned to win by default. An installed base like this can function like an annuity over time: once a utility commits to a turbine fleet, it is effectively pre-committing to years of follow-on service revenue, the same way a driver who buys a particular make of car keeps returning to that brand's dealership network for parts and service long after the original sale.
- Manufacturing and engineering scale in large-format gas turbines and grid equipment, built over more than a century of GE's power heritage, the kind of scale that takes years and billions of dollars for a challenger to replicate from scratch.
- Deep, multi-decade utility and grid-operator relationships, forged through GE's legacy power business, that make risk-averse utility customers reluctant to switch suppliers mid-project or mid-fleet.
- Breadth across generation, transmission, and electrification, letting GE Vernova sell an integrated solution (turbines, grid equipment, and software together) that a single-point competitor cannot match end to end.
Two rivals show why these strengths still have to be defended, not simply assumed. Siemens Energy carries its own integrated gas-turbine-and-grid-equipment lineup and deep relationships across European utilities, and has been closing its margin gap with GE Vernova. Mitsubishi Power holds a dominant position in the Asian gas turbine market with its high-efficiency JAC-series turbines and long-standing relationships with Asian utilities that GE Vernova does not have the same depth in.
What these advantages could eventually protect is the multi-decade service revenue behind orders already won, revenue that is the least visible line in any single quarter's backlog number.
Final Thoughts on GE Vernova's Intrinsic Value
- Total orders surged 88% organically to $24.2 billion in the second quarter of 2026, pushing backlog to $176 billion, equal to roughly 4.25 years of trailing revenue booked in advance.
- Operating margin has genuinely recovered, from 2.25% in fiscal 2024 to 5.42% in fiscal 2025 and 5.32% on a trailing basis, even as one-off tax and non-operating items inflate the trailing net income and return figures.
- Rated as No Moat, a plain, direct read on a two-year-old standalone company still working through one loss-making segment.
- Gas turbine backlog and slot reservations reached 116 gigawatts, up 16 gigawatts in a single quarter, with management targeting at least 125 gigawatts under contract by year-end 2026.
The market's skepticism about GE Vernova is not really about whether the data-center power story is real. Gas turbine slots booked years in advance say it is. The real debate is whether a stock priced well above its value, and still without a moat rating to lean on, has room left to grow into a business working through one loss-making segment and a thin two-year earnings history.
If backlog keeps converting roughly on schedule, Wind's losses continue narrowing, and the operating margin recovery holds, GE Vernova has a real case for growing into a wider range of these fair-value outputs over time.