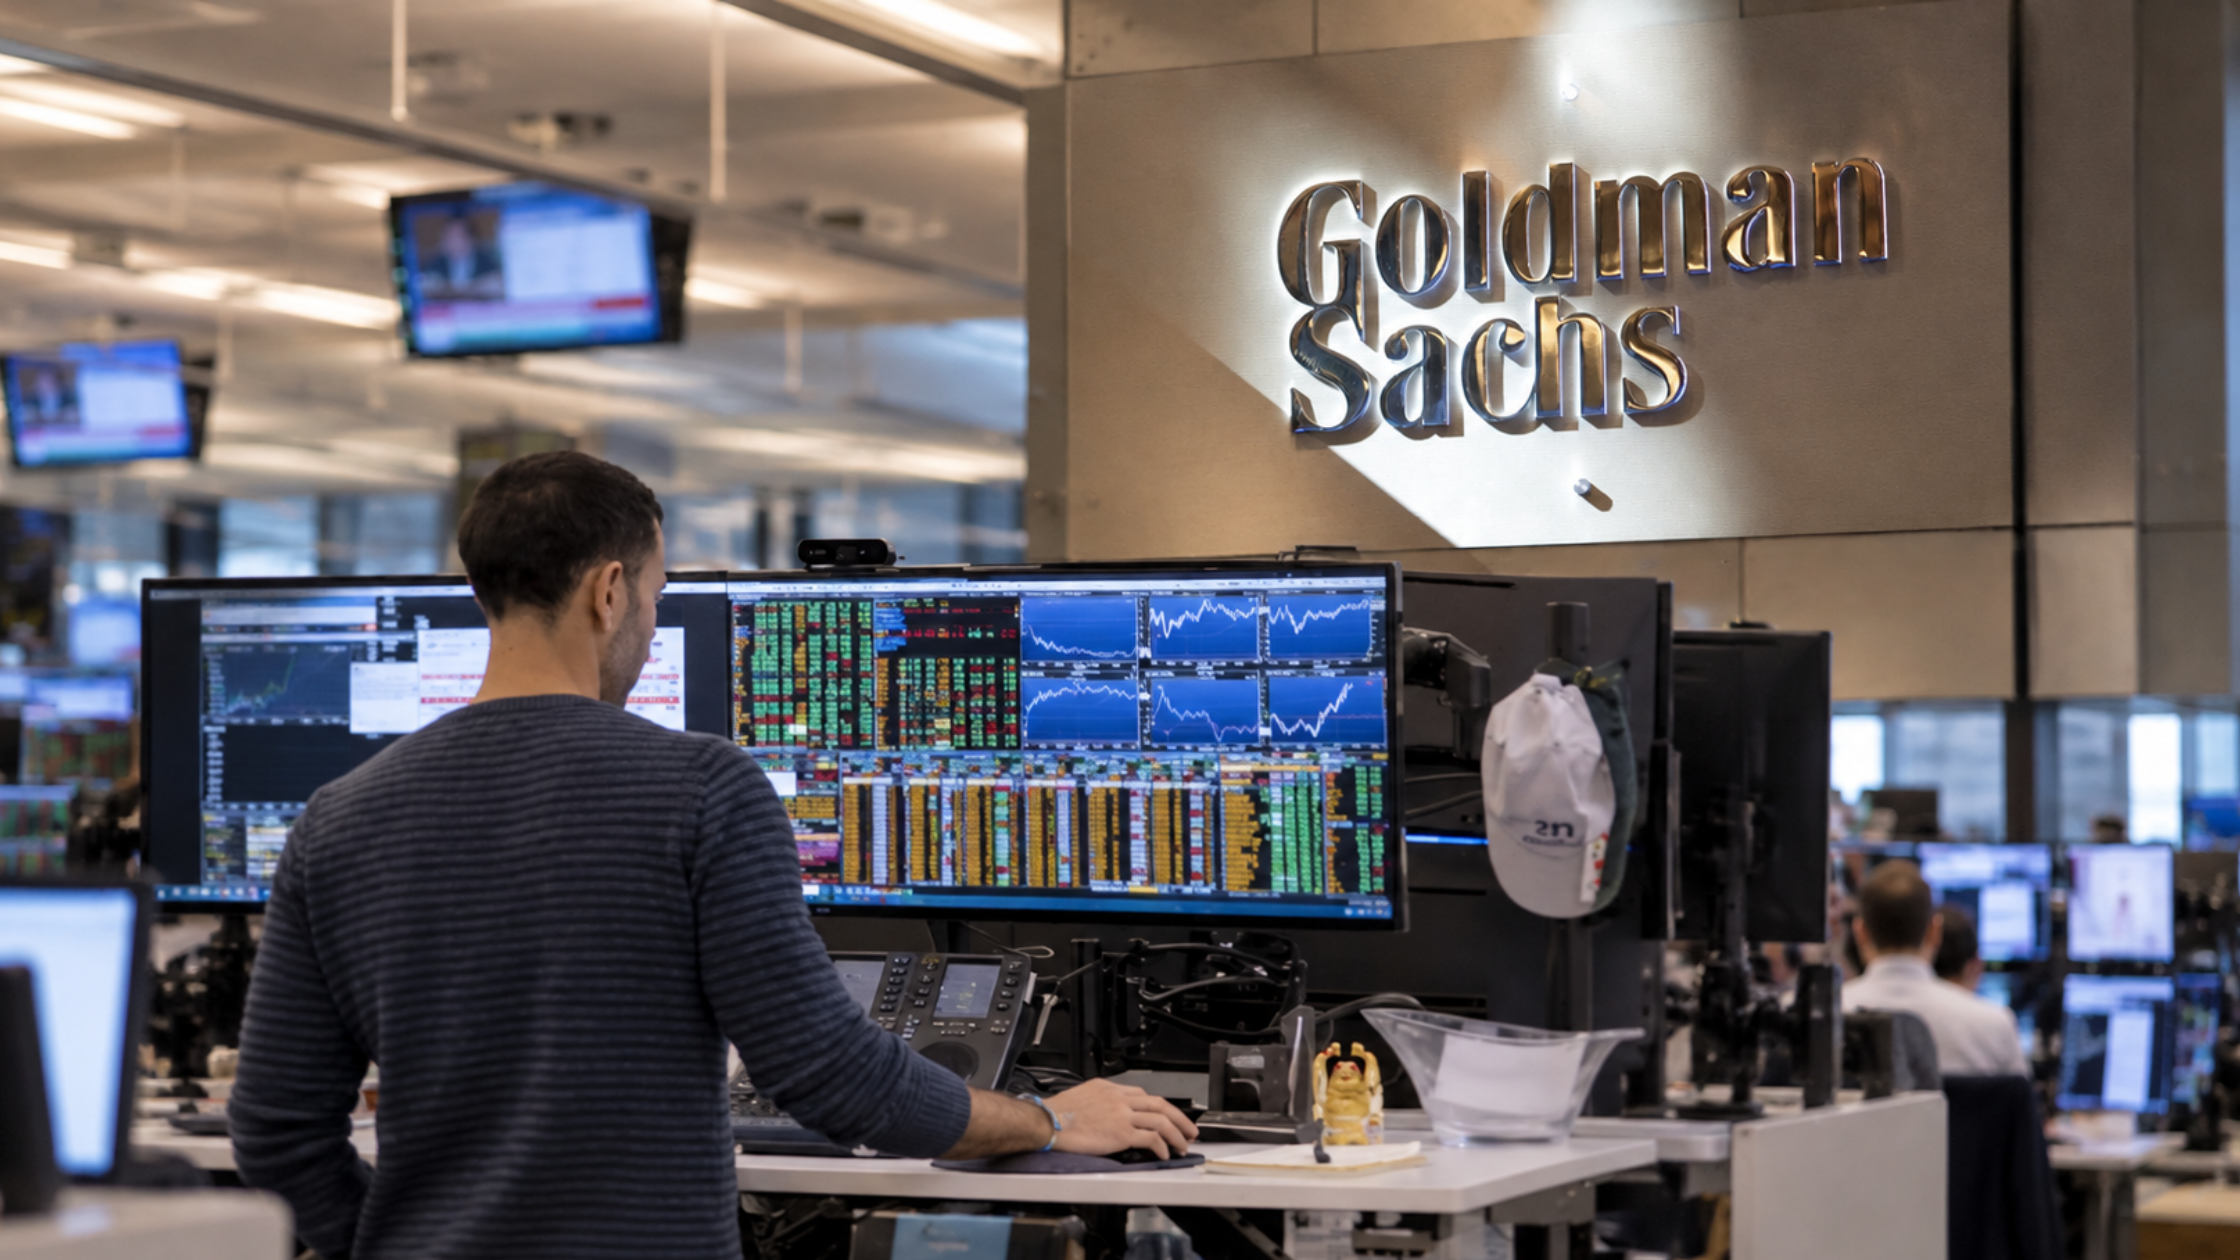
In August, shares jumped 11.3% in a single day after Merck and Moderna’s cancer vaccine, paired with Keytruda, succeeded in a late-stage trial.
Keytruda, Merck’s flagship cancer immunotherapy, helps the immune system recognise and attack tumours. A late-stage (Phase 3) trial is the final, large-scale round of testing before a drug can be submitted for regulatory approval.
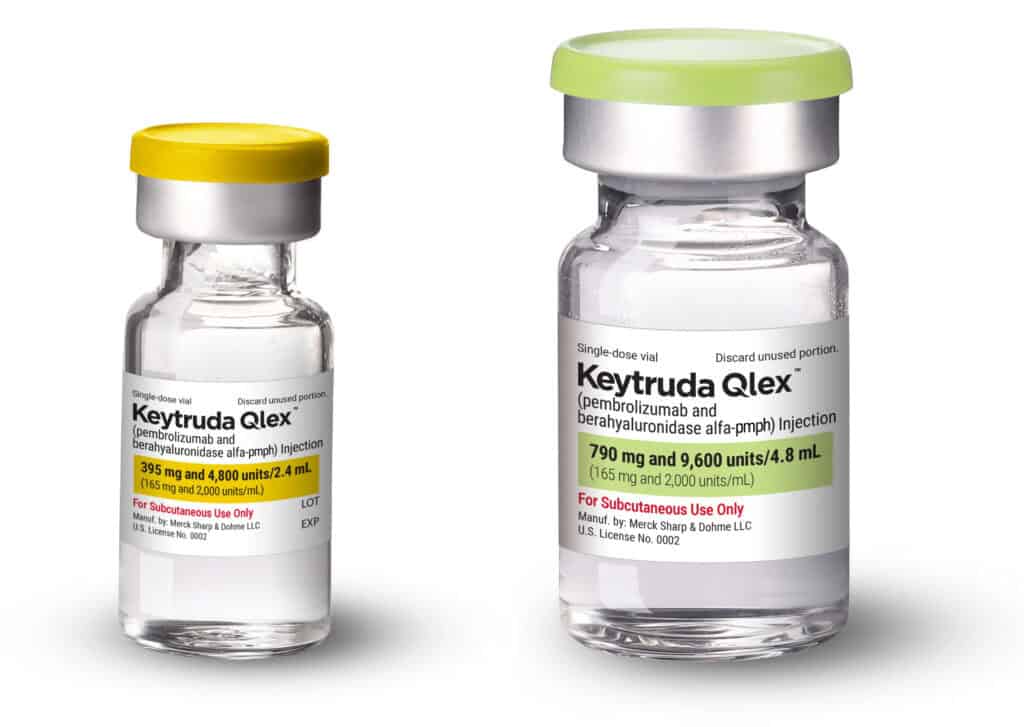
source : https://www.cancerresearch.org/blog/keytruda-qlex
With the market now pricing in a life after Keytruda, Merck & Co. (MRK) intrinsic value question becomes: how much of that future is already built into the share price?
With FDA decisions and a closely watched cancer-vaccine data readout landing, the next few months should tell investors whether Merck's MRK intrinsic value case is backed by more than a hopeful reframing of a real problem.
What is Merck's (MRK) intrinsic value?
Intrinsic value is an estimate of what a business is realistically worth based on the cash it can generate over its lifetime, not whatever a single quarter's headline, or a set of GAAP earnings numbers temporarily distorted by a one-time charge, happens to suggest.
For Merck, where one drug accounts for roughly half of revenue and that drug's patent clock is already running, working out which numbers reflect the real business and which reflect one-time noise is most of the job.
Merck's Fair Value: What StockOracle's DCF Model Says, Once the Noise Is Stripped Out
StockOracle's 20-year discounted cash flow model, DCF-20, values Merck off its operating cash flow, and puts fair value around $133.43 per share.
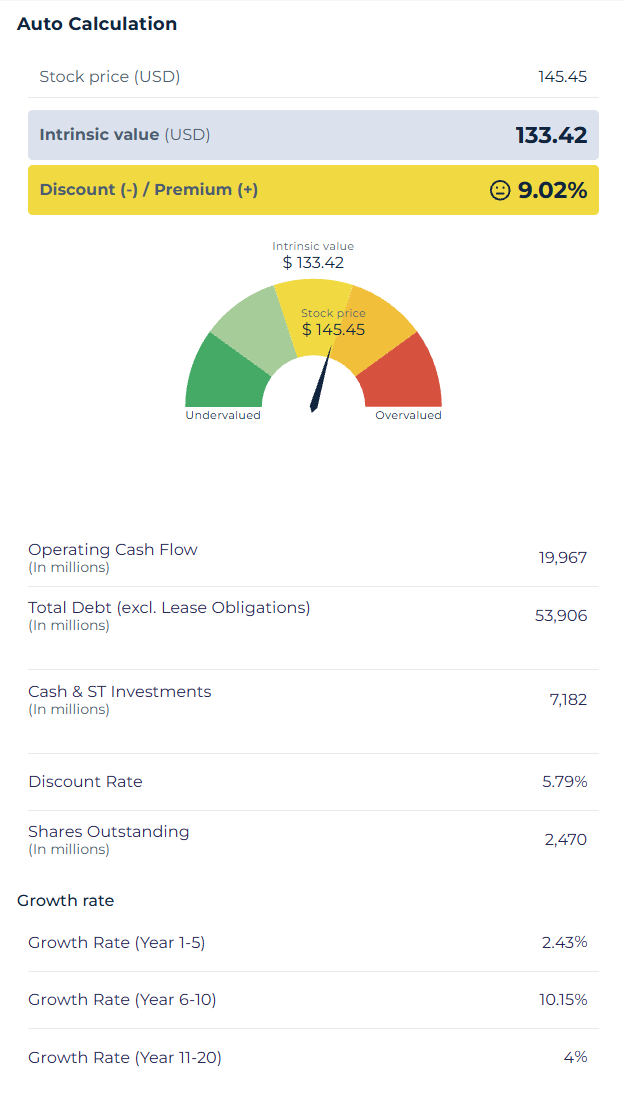
The growth assumptions line up closely with the Keytruda story. Growth is a modest 2.43% a year for Years 1–5, as Keytruda’s patent expiry weighs on sales, then accelerates to 10.15% for Years 6–10 as newer launches take on more of the load.
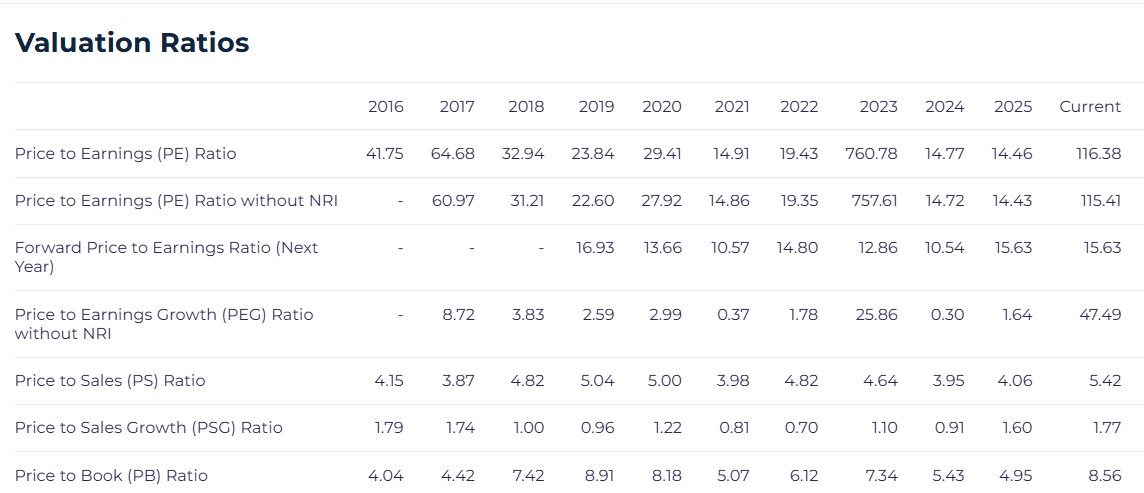
P/E sits at around 116x and the stock trades at around 5.4x trailing sales, both figures that reflect the R&D charge's effect on the denominator. Forward P/E, based on analysts' expectation that the charge doesn't repeat, sits at a far more ordinary 15.55.
That same distortion rules out two other models in StockOracle's suite as primary references here.
The rest of StockOracle's model suite, for reference:
- Discounted Free Cash Flow (DFCF-20): $101.18 — a more conservative discounted-free-cash-flow read, still cash-flow-based
- Mean P/S value: $116.14 (4.33x trailing sales)
- Mean P/B value: $101.22 (5.96x book value)
Merck currently trades above that entire cluster of usable model outputs. Rather than compressing that gap into a single premium figure, it's worth asking what the market is pricing in that these models aren't.
The bull case is that FY2025's normalised earnings power, $18,254 million in net income against a five-year average ROE north of 30%, is the more representative picture of Merck's earnings capacity than the trailing twelve months, combined with confidence in a pipeline management valued at over $70 billion.
The bear case is the single-drug concentration. Heavy reliance on Keytruda (~46 % of revenue) exposes Merck to structural risk. Any competitive threats, regulatory setbacks, or loss of exclusivity could disproportionately impact long‑term financial performance and valuation.
Merck (MRK) Financial Performance
Revenue Growth: Broad, But Still Leaning on One Drug
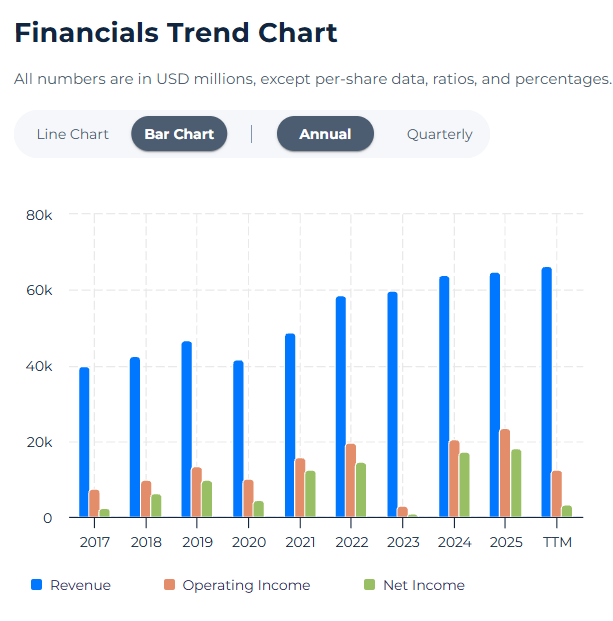
Merck's trailing revenue sits at $66,287 million as detailed in Merck's own Q2 2026 earnings release. Keytruda did nearly all of that work: full-year 2025 sales rose 7% to $31.7 billion, while newer launches like Winrevair are still too small to offset a slowing core franchise on their own. That pattern, one drug still doing most of the work while the rest of the portfolio ramps underneath it, is the concentration risk this entire bear case is built around.
MRK Free Cash Flow: The Cleaner Number Right Now
A patent has an expiration date. Free cash flow is what actually funds everything Merck does while that clock runs down, which is why it matters more here than a reported earnings line does.
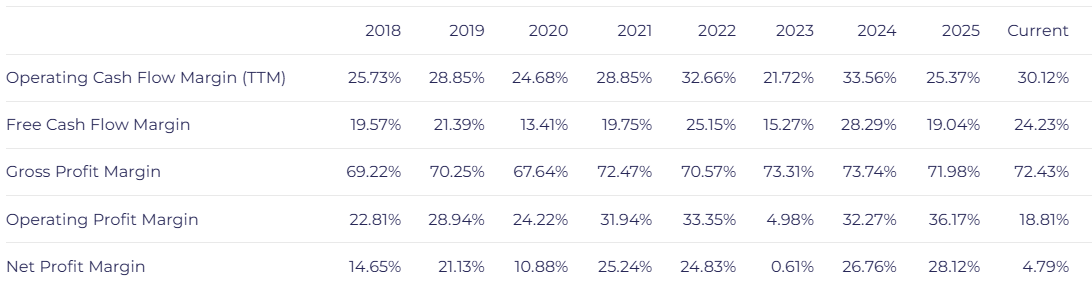
MRK's free cash flow margin runs at around 24% on a trailing basis, above its own five-year average. Meaning cash conversion has actually improved even as the R&D charge crushed GAAP net income.
On the current $147.53 share price, that cash generation translates into roughly a 4.38% FCF yield.
Basically about 4.4 cents of real cash for every dollar an investor pays for the stock. That cash funds the dividend and buybacks, and it explains why the business can keep rewarding shareholders while one-off deal charges make reported earnings look weaker than the underlying operations.
Returns on Capital: A Number That Needs the Five-Year Chart to Make Sense
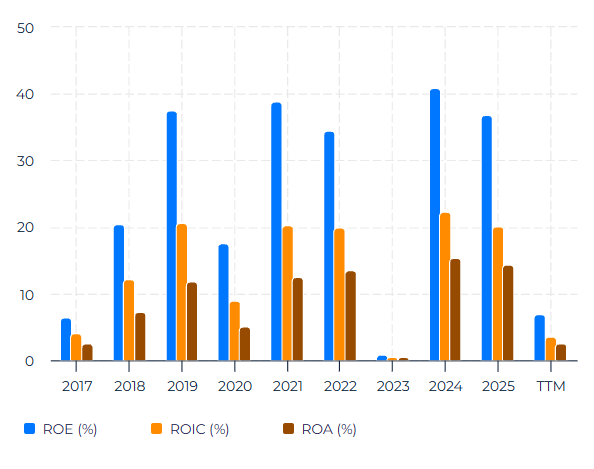
Return on equity and return on invested capital both look low on a trailing basis, at 6.98% and 3.61% respectively. Both ratios use net income as their numerator, and trailing net income is the same $3,173 million figure crushed by this year's R&D charge.
StockOracle's five-year averages tells another story: ROE has averaged 30.39% and ROIC 16.59% over that window, figures far more representative of how Merck has actually deployed capital in a normal year, and FY2025's $18,254 million in net income sits much closer to that five-year pattern.
Balance Sheet: Is There Enough Room to Absorb the Trough?
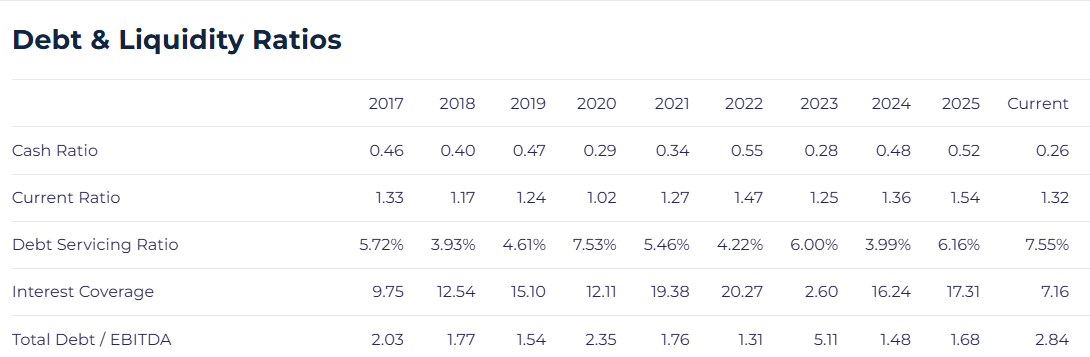
Current debt sits at around 2.84 times EBITDA with interest coverage of 7.16 times.
Simply put Merck owes about three years’ worth of its operating profit, and that profit covers its yearly interest payments about seven times over, a comfortable cushion for a company its size. As depicted in the Financial Strength segment of its OracleIQ
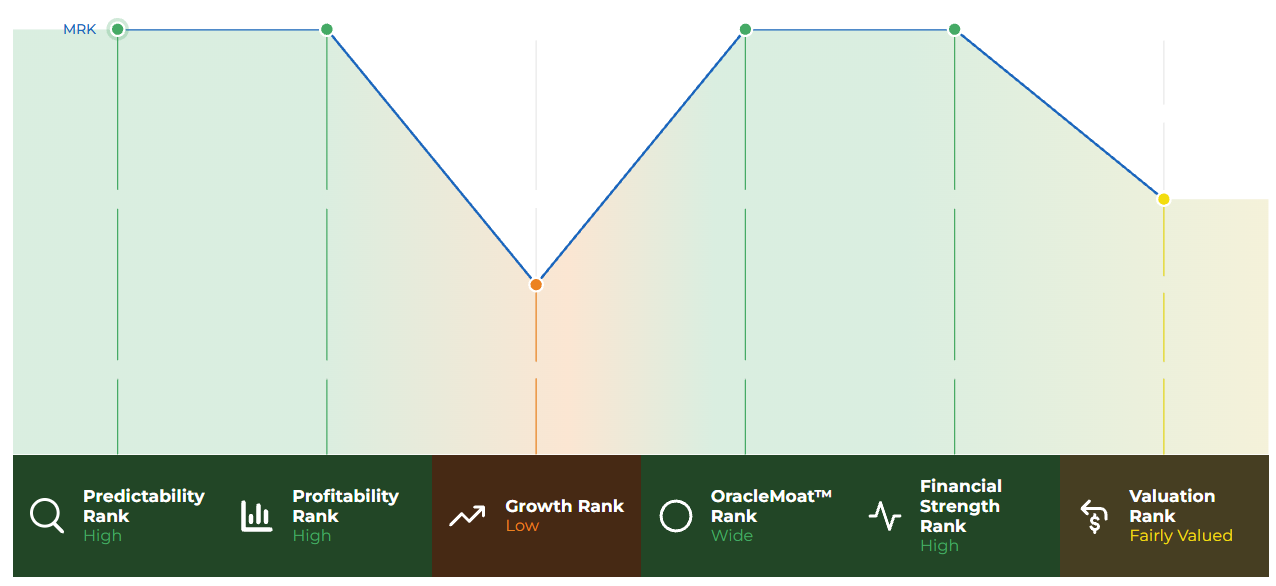
That increase in debt/EBITDA ratio mostly reflects the EBITDA compression rather than new borrowing. Even at the lower coverage ratio, Merck isn't carrying a balance sheet that looks stressed heading into the years when Keytruda's pricing power is expected to narrow.
Shareholder Returns: The Payout Ratio Is Another Distortion Victim
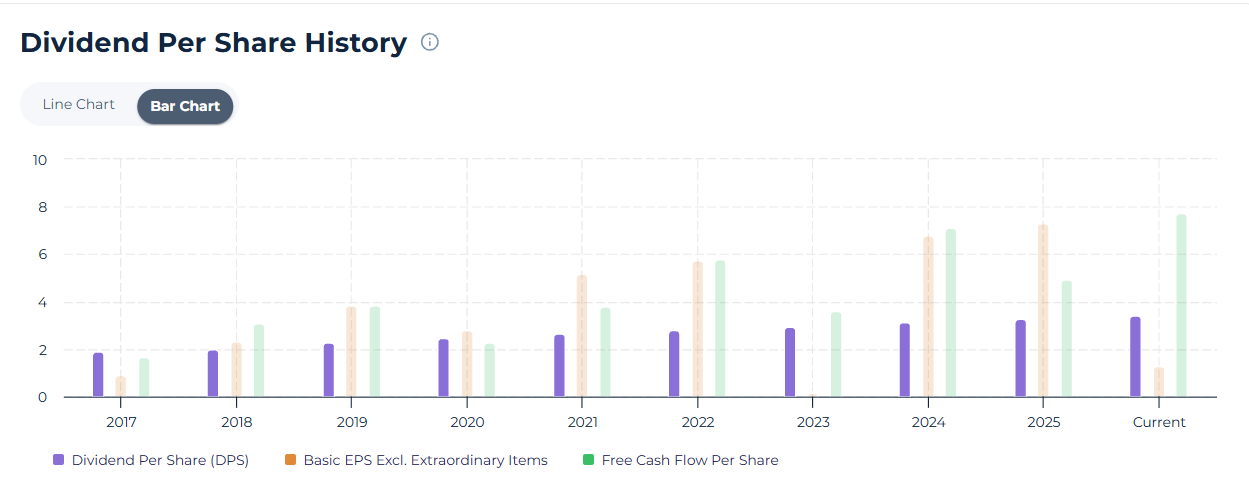
Merck's dividend has risen for 15 consecutive years, currently yielding 2.26% on a trailing $3.36 per share, backed by an open-ended $10 billion buyback authorisation the board approved in 2025.
Growth Catalysts of Merck & Co. (MRK)
- Keytruda Qlex (subcutaneous): approved by the FDA in September 2025, cuts a roughly 30-minute infusion down to a 1-to-2-minute injection, and already contributed $463 million in Q2 2026 sales, just two quarters after launch.
- Winrevair (sotatercept): pulmonary arterial hypertension therapy, Q2 2026 sales of $588 million, up 75% year-over-year, one of Merck's fastest-scaling non-oncology launches.
- Near-term catalyst cluster: FDA decisions on Winrevair, Welireg, and ifinatamab deruxtecan are all expected between September and October 2026, compressing several binary events into a single quarter.
- Merck-Moderna cancer vaccine (intismeran autogene): data expected at the ESMO conference in late October 2026, one of the most closely watched oncology readouts of the year.
- Merck Animal Health: Q2 2026 revenue of $1.775 billion, up 5%, split between livestock ($1.04 billion) and companion animal ($734 million) products, a business with its own growth cycle entirely separate from human pharmaceuticals.
Why it matters for valuation: DCF-20's $130.43 output assumes Merck's cash generation holds up through the patent-cliff transition. Catalysts like these are the evidence that has to keep showing up in the numbers for that assumption to stay credible, not proof in the abstract.
Economic Moat: A Wide Moat With an Expiration Date on One Pillar
StockOracle rates Merck a Wide Moat business. Patent protection on the Keytruda franchise, including the newer Qlex subcutaneous formulation, shields pricing power into the 2030s in the best case, but it is, by definition, a temporary advantage rather than a permanent one.
Oncologist prescribing relationships and more than a decade of accumulated clinical trial data across dozens of tumor types are stickier: shifting a patient population to a rival checkpoint inhibitor requires new trial evidence, not just a lower price. Regulatory and manufacturing scale, the ability to run global trials and secure approvals across dozens of markets at once, is a genuine barrier a smaller biotech competitor can't easily replicate. Merck Animal Health gives the company a fourth, diversified leg that doesn't share a single patent expiration date with the human-health business at all.
Building a More Aggressive MRK Fair-Value Read Yourself
The base case assumes 2.43% annual growth for Years 1–5. That’s a cautious starting point, and it effectively assumes Keytruda’s patent expiry weighs heavily on sales before newer products can fill the gap.
Some investors may see it differently. Merck’s pipeline has made real progress this year. Its mRNA cancer vaccine with Moderna succeeded in a late-stage trial, the Terns acquisition added a leukemia drug management has called a multibillion-dollar opportunity, and a dedicated cancer business is being built to support new launches. If those launches arrive sooner, near-term growth could run faster than the base case assumes.
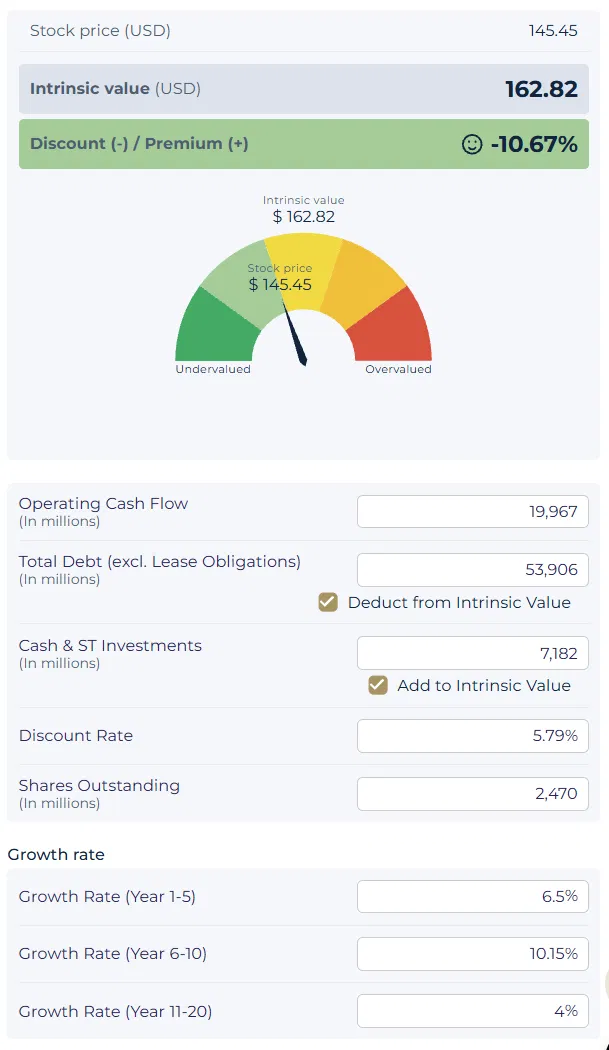
To test that view, we raise the Year 1–5 growth rate to 6.5% and keep every other input unchanged. The estimated intrinsic value rises to $162.82 per share, closer to its market price right now.
Keep in mind that every growth rate in this model is an estimate, not a forecast of what Merck will actually deliver. Small changes in assumptions can move the result significantly, as this scenario shows. Investors should do their own research, test a range of inputs, and use their own judgement about which outcome they find most reasonable.

Final Thoughts on Merck's Intrinsic Value
Merck's patent-cliff pessimism isn't manufactured. Keytruda still represents roughly half of company revenue. But the trailing twelve months are also the noisiest possible window to judge that risk from, given the R&D charge sitting inside nearly every GAAP ratio.
The pipeline behind the cliff, Winrevair, Animal Health, the subcutaneous franchise, and a run of FDA decisions and a major oncology data readout landing before the end of October 2026, gives investors a near-term, checkable test of whether the recovery case behind DCF-20’s valuation. If those catalysts land as management expects, that figure has room to look conservative in hindsight; if they slip, the contraction years matter more than any single quarter's headline suggests.