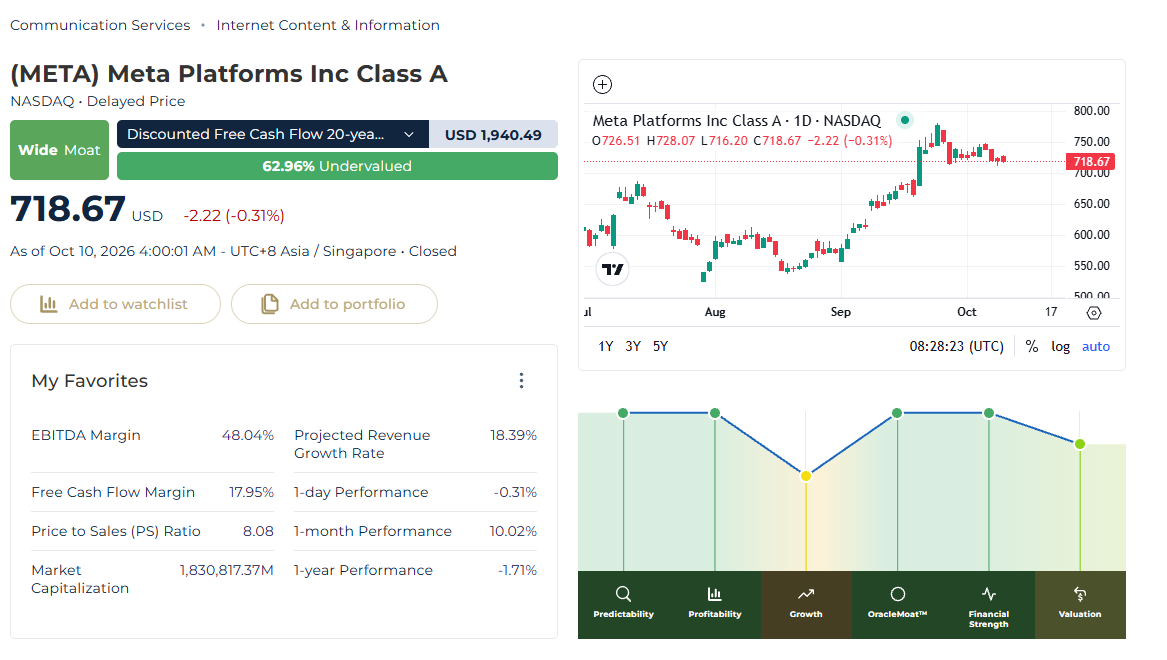
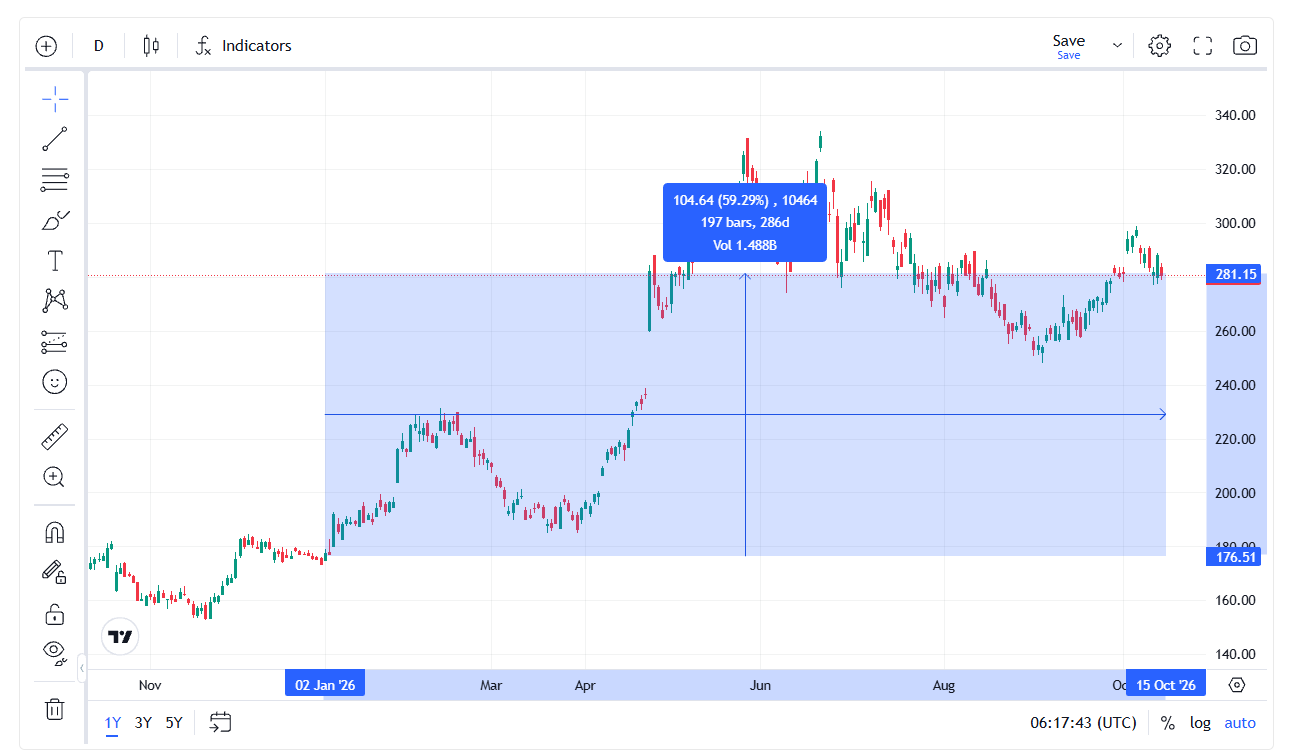
When the semiconductor rally took off, most of the attention went to AI chipmakers. Texas Instruments was rarely part of that story. Yet the stock has quietly climbed about 60% YTD, carried by the same wave that lifted the sector.
That makes TXN an unusual case. Its business is analog and embedded chips, the unglamorous parts that go into cars, factories and household electronics, not data-centre accelerators. So the question is whether this rally reflects a real turn in TXN's cash-generating power, or a company being priced like its higher-growth peers.
That’s what we’re here to work out.
Texas Instruments's trailing free cash flow margin closed at 27.53%, already ahead of its own five-year average, evidence that the post-buildout recovery investors have been waiting on might have arrived.
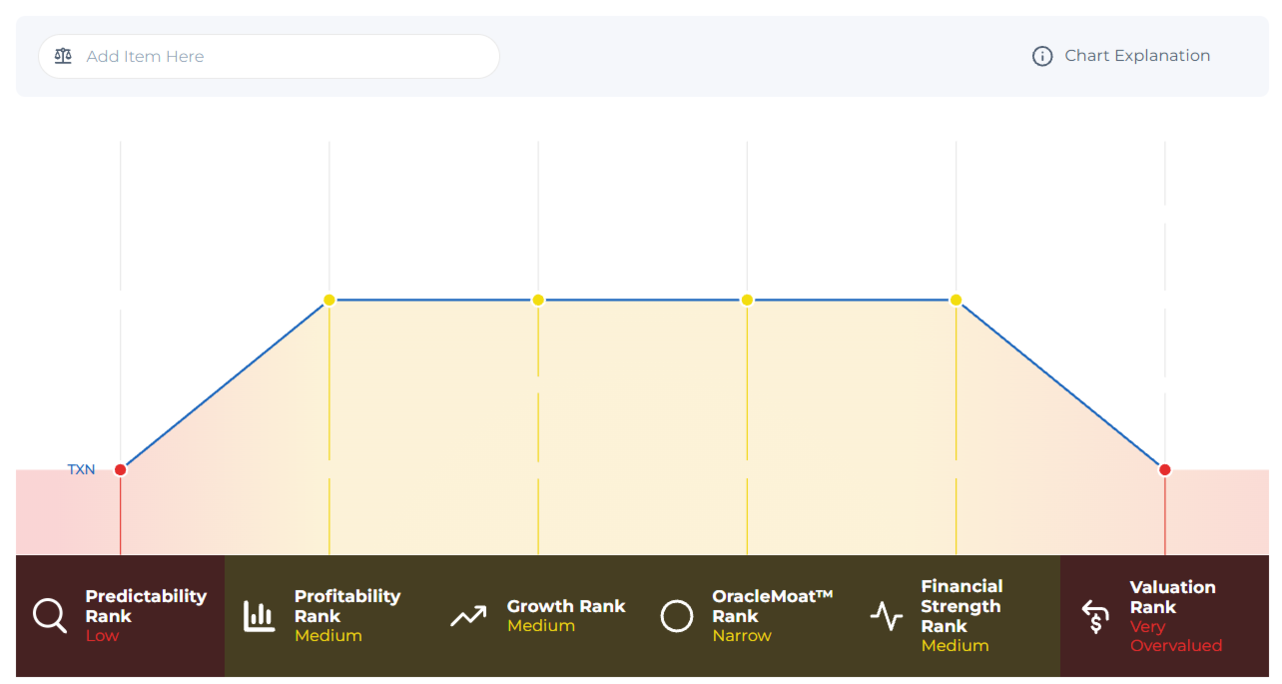
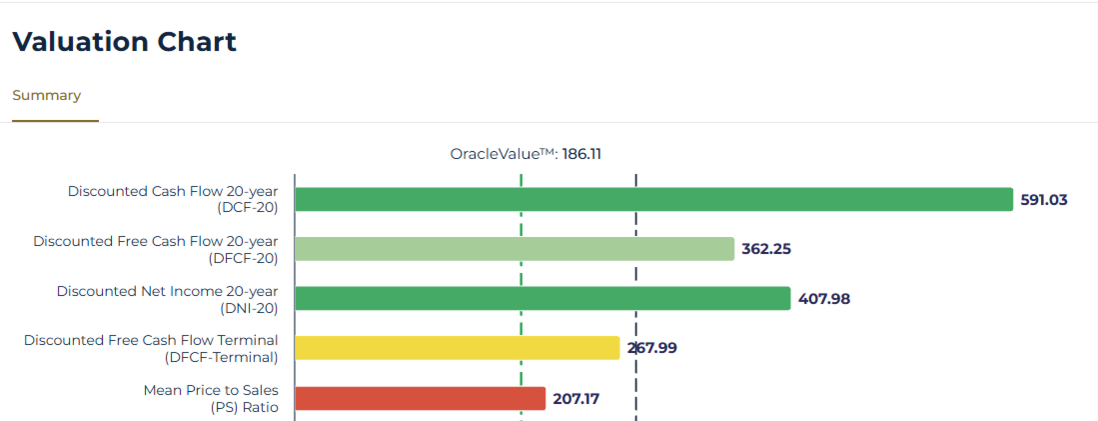
StockOracle™ rates the stock a Narrow Moat business, and the range of valuation models are spread out right now, from the mid-$160s to well north of $500 a share.
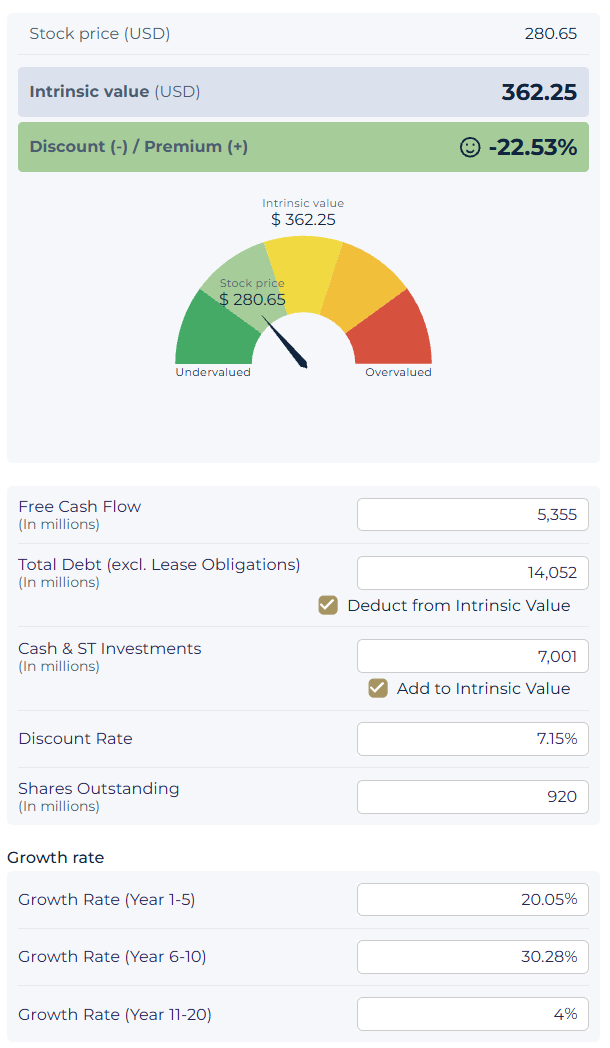
That spread tells something interesting: Texas Instruments's intrinsic value depends on how many more years of 20%-plus growth the market is willing to pay for at $280 a share.
What is Texas Instruments's intrinsic value?
Intrinsic value is an estimate of what a business is actually worth based on the cash and earnings it can realistically generate over time, not whatever the market happens to pay for the stock on a given day.
For a company mid-recovery from a heavy capex cycle like Texas Instruments, that distinction matters because the growth rate feeding most valuation models right now is unusually high, and how far that rate gets extrapolated changes the answer dramatically.
Texas Instruments's Intrinsic Value: A Wide Spread, and Why
StockOracle™ runs TXN through several distinct valuation models and right now those models disagree by a wide margin:
- DCF-20 (20-year discounted cash flow): $591.11
- DFCF-20 (20-year discounted free cash flow): $362.30
- Mean P/S: $206.12 (9.75x sales)
- Mean P/E, ex non-recurring items: $184.93 (27.96x earnings)
- Median P/E, ex non-recurring items: $167.22 (25.28x earnings)
A spread from $167 to $591 is not noise. It is telling investors exactly which assumption is doing the work. The three cash-flow-based models at the top of that range (DCF-20, DNI-20, DFCF-20) all extrapolate off StockOracle's projected 3-5 year EPS growth assumption of 20.05%, applied over each model's full 20-year window, at a moment when the underlying operating cash flow base is itself elevated relative to a still capex-depressed free cash flow figure.
What the market is pricing in Texas Instruments Intrinsic Value
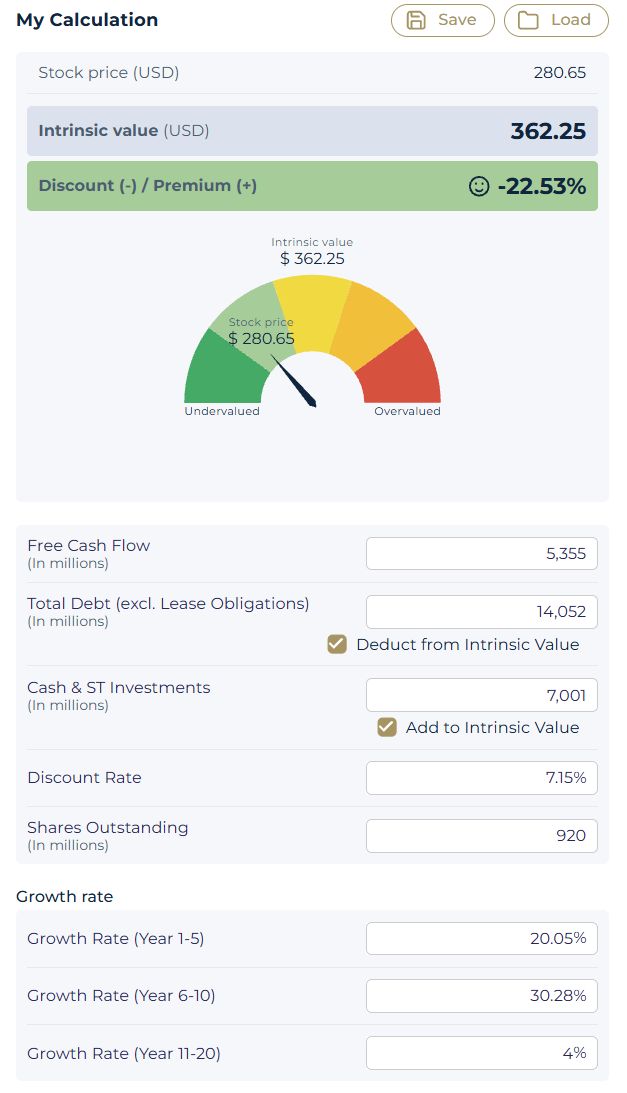
The $362 figure in the calculator rests on a stronger assumption: growth accelerating to 30.28% in years 6 to 10. That only holds if TXN cash generation steps up sharply once its current fab-building cycle winds down.
Working the model backwards from the current price, the market is implying roughly 21% annual FCF growth for 10 years, then 4% after that.
In other words, the price already assumes TI sustains the 20% growth rate. The market isn’t sceptical, but it isn’t paying for acceleration either. The question for investors is whether free cash flow can keep compounding at 20%+ for a full decade. The upside depends almost entirely on what happens in years 6 to 10.
Texas Instruments (TXN) Financial Performance
Revenue Growth: A Broad-Based Recovery, Not a Single Product Cycle
TXN Revenue Trend — Powered by StockOracle™
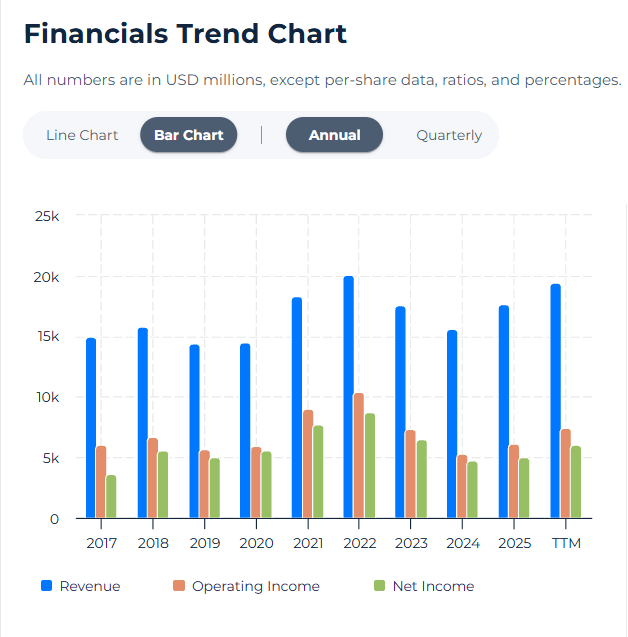
Texas Instruments's revenue reached $5.46 billion in the quarter ended June 2026, up 23% year-over-year, with the company's second-quarter 2026 results showing growth spread across end markets: industrial revenue grew roughly 30% year-over-year, automotive grew in the mid-teens, and data center revenue roughly doubled.
That breadth matters because industrial and automotive are TXN's largest, stickiest markets, and their recovery is what is pulling trailing twelve-month revenue to $19.45 billion, up from $17.68 billion.
TXN also scores 59.26% on the Rule of 40 measure, which combines revenue growth with free cash flow margin. And it sits comfortably above the 40% threshold typically used to flag an efficiently growing business.
Free Cash Flow and the Capex Cycle: The Section That Actually Decides TXN's Fair Value
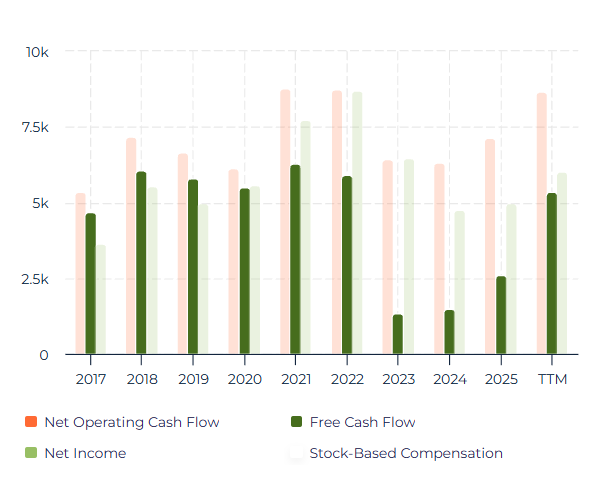
Topline growth is the headline. Free cash flow is the receipt, and for Texas Instruments right now, that receipt seems to finally be starting to show what the recovery has been promising. Free cash flow margin reached 27.53%, which is not just a recovery off the 2023-2024 lows of 7.70% and 9.58%, it is already running ahead of TXN own five-year average of 19.18%, a sign the capex-cycle drag is easing rather than just stabilising.
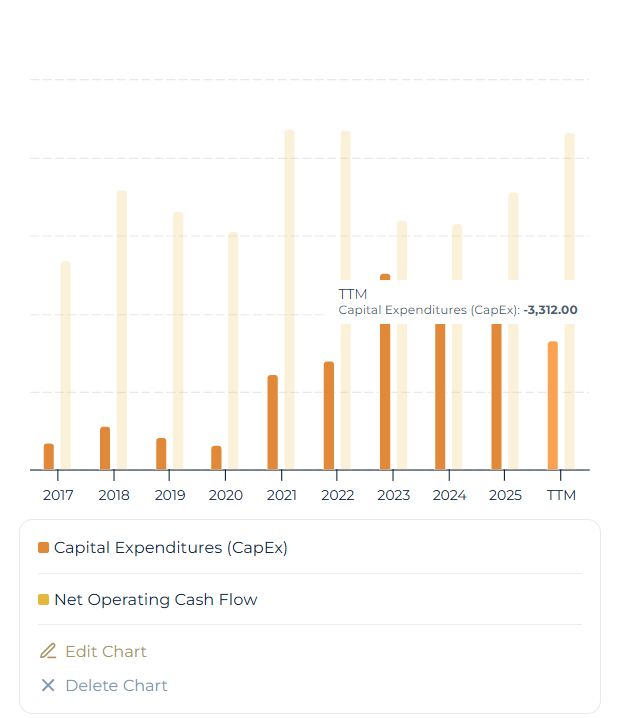
Capital expenditures are still consuming 17% of revenue, and capex ran at 0.38 times operating cash flow, which is why FCF yield on the current share price reads a still-modest 2.25%.
Management's own 2026 capex guidance, cut to $2 billion to $3 billion for the full year from fiscal 2025's $4.55 billion. It could be the clearest evidence the spending is starting to taper rather than compound. That normalisation path is exactly what pulls the cash-flow-based models up from where trailing, unadjusted free cash flow alone would put them.
Margins and Returns on Capital: Recovering, But Still Below Trend
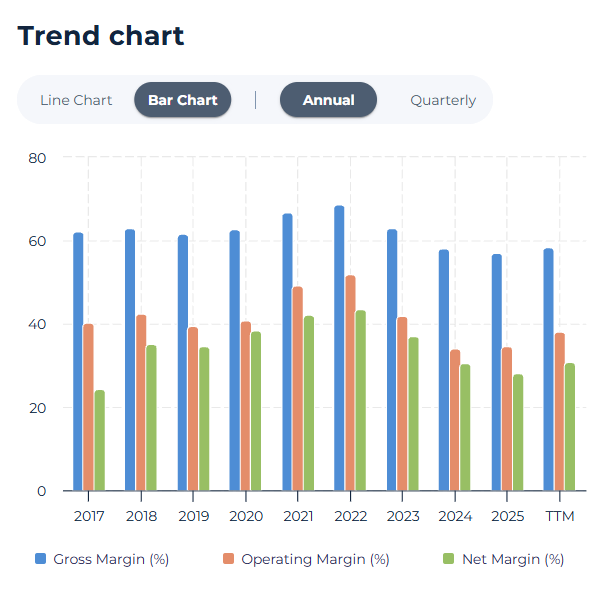
Gross margin sits at 58.33%, modestly above its own five-year average of 57.02%, evidence that TXN's underlying pricing power on the products themselves has held up well through the cycle.
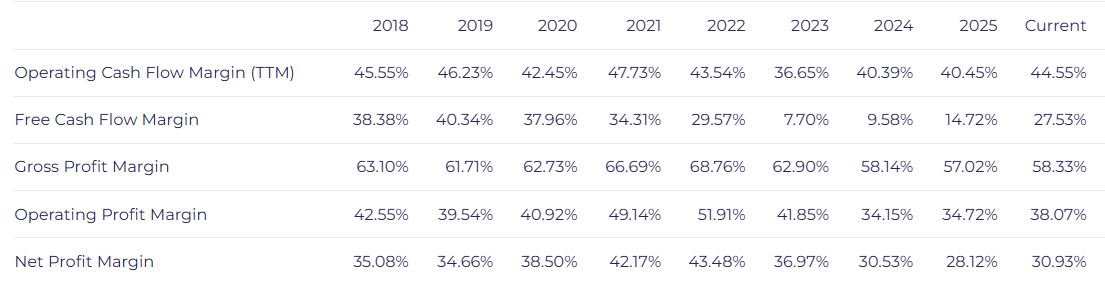
Operating margin (38.07%) and net margin (30.93%) both still sit below their 10-year averages of 41.09% and 34.05%, which means the drag is coming from below the gross-margin line, most likely the elevated depreciation and operating costs of a fab buildout that has not yet reached full utilisation, not from the products losing pricing power.
Return on equity reads 34.97% and return on invested capital reads 19.61%, both still running well below their 10-year averages of 47.49% and 30.67%.
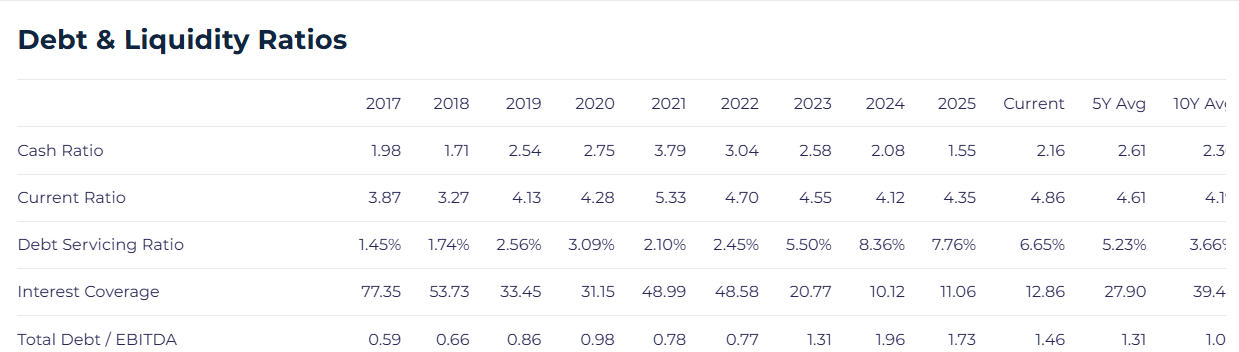
The balance sheet gives that bet some room to play out. Debt sits at 1.46 times EBITDA with interest covered 12.86 times over, a conservative capital structure that has absorbed several years of peak capex spending without strain.
Shareholder Returns: A Long Track Record, Tested by the Buildout
Texas Instruments has raised its dividend for 22 consecutive years, and the stock currently yields 2.19% on trailing dividends per share of $5.62. The payout ratio sits at 85.50% of trailing net income, elevated because free cash flow is still working through the same capex-cycle compression described above, leaving less room for further dividend growth until that base normalises.
Economic Moat: What Protects Texas Instruments's Pricing Power
StockOracle™ rates Texas Instruments a Narrow Moat business.
In-house 300mm manufacturing gives TXN a structural cost advantage over fabless rivals that depend on outside foundries for capacity and pricing. Long product life cycles, often a decade or more for an industrial or automotive part, lock in design wins for years after a customer first qualifies a chip. A broad analog catalog spanning power management, signal chain, and connectivity lets TI cross-sell into accounts that would otherwise need multiple suppliers.
But each rival brings its own edge: Analog Devices competes hardest at the high-performance end of the signal chain, with strength in precision data conversion inherited partly through its Linear Technology and Maxim acquisitions; ON Semiconductor has built a specific edge in silicon carbide power semiconductors for electric vehicle powertrains; STMicroelectronics carries strong automotive relationships across European manufacturers alongside its own silicon carbide and microcontroller lines.
Re-qualifying an analog chip inside an industrial control system or an automotive platform is a lot like re-certifying a part in an airplane: expensive, slow, and not something an engineer does without a compelling reason. That switching cost is what protects TXN pricing power and a narrow moat suggests that its real, but not insurmountable for a well-capitalised competitor willing to fight for a specific segment.

Final Thoughts on Texas Instruments's Intrinsic Value
- Free cash flow margin reached 27.53% on a trailing twelve-month basis, now above TXN own five-year average of 19.18%, evidence the capex-cycle recovery is real and already ahead of trend.
- Returns on capital remain below their 10-year trend (ROE 34.97% versus a 47.49% average, ROIC 19.61% versus a 30.67% average), consistent with a capital base still catching up to its own earnings power.
- StockOracle rates TXN a Narrow Moat business, and gross margin at 58.33% (above its five-year average) suggests product-level pricing power is intact even while operating and net margin remain below trend.
- The dividend payout ratio of 85.50% of trailing net income is elevated relative to a still-recovering free cash flow base, leaving limited room for further dividend growth until capex normalizes further.
- Management's guided step-down in 2026 capex, if it holds, is the single clearest signal that could pull the higher end of the model spread closer to being credible rather than aggressive.
Texas Instruments's near-term free cash flow and dividend coverage are still tight relative to where they will likely settle once the buildout finishes, a direct consequence of a capex program that has put 300mm wafer capacity in the ground rather than cash in the bank. The long-term case rests on that capacity converting into a durable cost advantage and further margin recovery, which the free cash flow and gross margin trends above suggest is already underway, just not yet enough to make the market's forward multiple and StockOracle's cash-flow models agree on a single number. If capex keeps stepping down on schedule and growth holds anywhere close to its current pace, the intrinsic value case for Texas Instruments should keep strengthening as reported cash flow catches up to what the higher end of the model spread already assumes.