By Piranha Profits Team
Last updated on March 27, 2026
When the Mag 7 Report Earnings, Markets Pay Attention
The Magnificent 7 Nvidia (NVDA), Alphabet (GOOGL), Amazon (AMZN), Microsoft (MSFT), Apple (AAPL), Meta Platforms (META), and Tesla (TSLA) collectively account for roughly one-third of the S&P 500's total market value. When these seven companies report earnings, their results set the tone for the broader market.
With the most recent earnings season now behind us and the next wave of Mag 7 earnings dates approaching in late April and May 2026, we wanted to take a look at what happened, what changed, and what StockOracle™ data tells us about where these businesses stand today.
Mag 7 Most Recent Earnings Results
The latest round of Magnificent 7 earnings played out across late January and February 2026. Here is a quick summary what each company reported and what the market made of it:
Meta Platforms (META) reported on 28th January 2026 (Q4 2025). Meta reported revenue of $59.89 billion (+24% Year on Year) and EPS of $8.88, comfortably beating the $8.23 consensus estimate. Daily active users across its family of apps reached 3.58 billion. Meta also announced $115–$135 billion in CAPEX for 2026 nearly doubled 2025. Signalling the scale of its AI infrastructure ambitions.
Microsoft (MSFT), reported on 28th January 2026 (Q2 FY2026). Microsoft posted revenue of $81.27 billion and non-GAAP EPS of $4.14, both ahead of consensus. Operating income grew 21%. Despite the beat, the stock fell as the promise of OpenAI revenue has yet to gain enough traction. Azure cloud growth decelerated slightly from 40% to 39%.
Check out MSFT Post Earnings StockOracle™ Analysis
Tesla (TSLA) also reported on 28th January 2026 (Q4 2025). Tesla's non-GAAP EPS of $0.50 beat the $0.40 estimate by 25%, but the headline numbers told a more challenging story. Quarterly revenue came in at $24.90 billion, down 3% Year on Year. Tesla's first annual revenue decline on record. The automotive segment fell 11% to $17.7 billion, and net income dropped 61% to $840 million.
Apple (AAPL), reported shortly after on 29th January 2026 (Q1 FY2026). Apple posted EPS of $2.84 (+19% Year on Year) on revenue of $143.8 billion (+16% Year on Year). iPhone revenue surged 23% to $85.27 billion, and a standout recovery in China drove 38% growth to $25.53 billion. Services revenue reached $26.34 billion (+14%). Mac sales declined 7% and wearables slipped 2%, with management reporting that demand outpaced supply in these areas.
Check out AAPL Post Earnings StockOracle™ Analysis
Alphabet (GOOGL), reported on 4th February 2026 (Q4 2025). Alphabet beat on both lines with EPS of $2.82 versus the $2.63 estimate and revenue of $113.83 billion versus $111.43 billion expected. Net income rose 30% Year on Year to $34.46 billion. Google Cloud contributed $17.66 billion. YouTube advertising revenue came in at $11.38 billion, missing the $11.84 billion expectation.
Check out our January 2026 GOOG StockOracle™ Analysis
Nvidia (NVDA) reported on 25th February 2026 (Q4 FY2026). Nvidia delivered another incredible quarter with revenue of $68.1 billion, up 73% Year on Year and 20% quarter on quarter. Data Center revenue alone reached $62 billion (+75% Year on Year). Non-GAAP EPS came in at $1.62, beating estimates. Gross margins held firm at 75%. Guidance of $78 billion (±2%) for Q1 FY2027 exceeded expectations, and management indicated that its next-generation Vera Rubin AI chips were tracking six months ahead of schedule.
Check out our January 2026 Nvidia StockOracle™ Analysis
Any past performance mentioned is not indicative of future results.

When Is the Next Mag 7 Earnings Date?
Looking ahead, the next wave of Magnificent 7 earnings dates clusters in late April and early May 2026:
|
Company |
Ticker |
Estimated Next Earnings Date |
Reporting Quarter |
|
Amazon |
AMZN |
23rd April 2026 |
Q1 2026 |
|
Alphabet |
GOOGL |
28th April 2026 |
Q1 2026 |
|
Microsoft |
MSFT |
28th April 2026 |
Q3 FY2026 |
|
Tesla |
TSLA |
28th April 2026 |
Q1 2026 |
|
Meta Platforms |
META |
29th April 2026 |
Q1 2026 |
|
Apple |
AAPL |
7th May 2026 |
Q2 FY2026 |
|
Nvidia |
NVDA |
20th May 2026 |
Q1 FY2027 |
The window from 23rd April to 20th May 2026 will once again concentrate the most influential earnings reports into a tight three-and-a-half week stretch. This time, the stakes are arguably higher. Markets are entering this earnings cycle against a backdrop of renewed inflation concerns, persistent oil price volatility, and uncertainty around interest rate trajectories. These macro pressures raise questions about whether the resilience of mega-cap tech can continue uninterrupted.
In an environment where expectations remain elevated, even slight disappointments or cautious forward guidance could have an outsized impact on broader market sentiment.
Magnificent 7 Stocks of 2026 in the Lens of StockOracle™

Powered by StockOracle™ accurate as of 25th March 2026.
Viewing the Magnificent 7 through the StockOracle™ lens reveals meaningful differences beneath the shared "mega-cap tech" label. While all seven companies command trillion-dollar-plus market capitalisations and dominant positions in their respective markets, their financial trajectories, growth profiles, and valuations are far from uniform.
OracleValue™ is StockOracle™'s proprietary fair-value estimate of a stock.
Which Mag 7 Stock has the least optimism priced in? Price-to-OracleValue™ Ranking
As of 25th March 2026, here is how the Magnificent 7 rank relative to their OracleValue™:
|
Rank |
Company |
Ticker |
Price-to-OracleValue™ |
|
|
1 |
Microsoft |
MSFT |
0.70 |
Below OracleValue™ |
|
2 |
Meta Platforms |
META |
0.73 |
Below OracleValue™ |
|
3 |
Nvidia |
NVDA |
0.84 |
Below OracleValue™ |
|
4 |
Amazon |
AMZN |
0.89 |
Below OracleValue™ |
|
5 |
Alphabet |
GOOGL |
0.99 |
Near OracleValue™ |
|
6 |
Apple |
AAPL |
1.19 |
Above OracleValue™ |
|
7 |
Tesla |
TSLA |
1.66 |
Well Above OracleValue™ |
OracleValue™ is an estimate and should not be taken as a recommendation or a signal to buy or sell stocks.
Mag 7 EPS Growth Rates
Earnings per share growth is a signal of business momentum. Across the Magnificent 7, the spread in EPS growth rates tells a story of diverging trajectories:

Powered by StockOracle™ accurate as of 26th March 2026
1-Year EPS Growth, What's Working Right Now?
Nvidia at 66.75% is in a category of its own. This kind of growth at this scale tells you the AI infrastructure cycle could still be in its early stages, and the premium valuation has a foundation as long as it holds.
Alphabet (34.30%), Amazon (29.88%), and Microsoft (28.73%) form a strong tier, signalling that AI monetisation, cloud, and ad recovery are translating into real bottom-line results. Apple at 25.65% might reflect an iPhone cycle recovery, but investors should ask whether it's an one-off or will it be sustainable.
Meta at -1.80% looks slightly alarming and calls for deeper scrutiny in its revenue model. Tesla at -47.21% might signal a red flag.
This could be a structural margin compression, and for a stock still trading at a growth multiple that high, demands the question: what exactly is the market paying a premium for?
3-Year and 5-Year EPS Growth The Compounders vs One-Hit Wonders
Over 3 years, Nvidia's 204.08% confirms a multi-year structural shift, not a temporary spike. Meta (39.86%) and Alphabet (33.35%) also show durable compounding. Microsoft (12.24%) and Apple (6.89%) are steady but slower. Tesla at -33.28% tells you earnings have been deteriorating, not improving.
The 5-year view reveals something important. Tesla shows 38.32%, capturing its explosive 2020–2023 phase, but the 1-year and 3-year rates reveal that compounding might have broken down. This is exactly why multi-timeframe analysis matters. Meanwhile, Alphabet (29.82%), Amazon (27.96%), Microsoft (18.80%), Meta (18.41%), and Apple (17.91%) all cluster between 18–30%. This convergence suggests that at a massive scale.
If the magnificent 7 can sustain at rates of 18 - 30% in the long run which is excellent growth rates, it could then justify the price premium right now.
Any past performance mentioned is not indicative of future results.
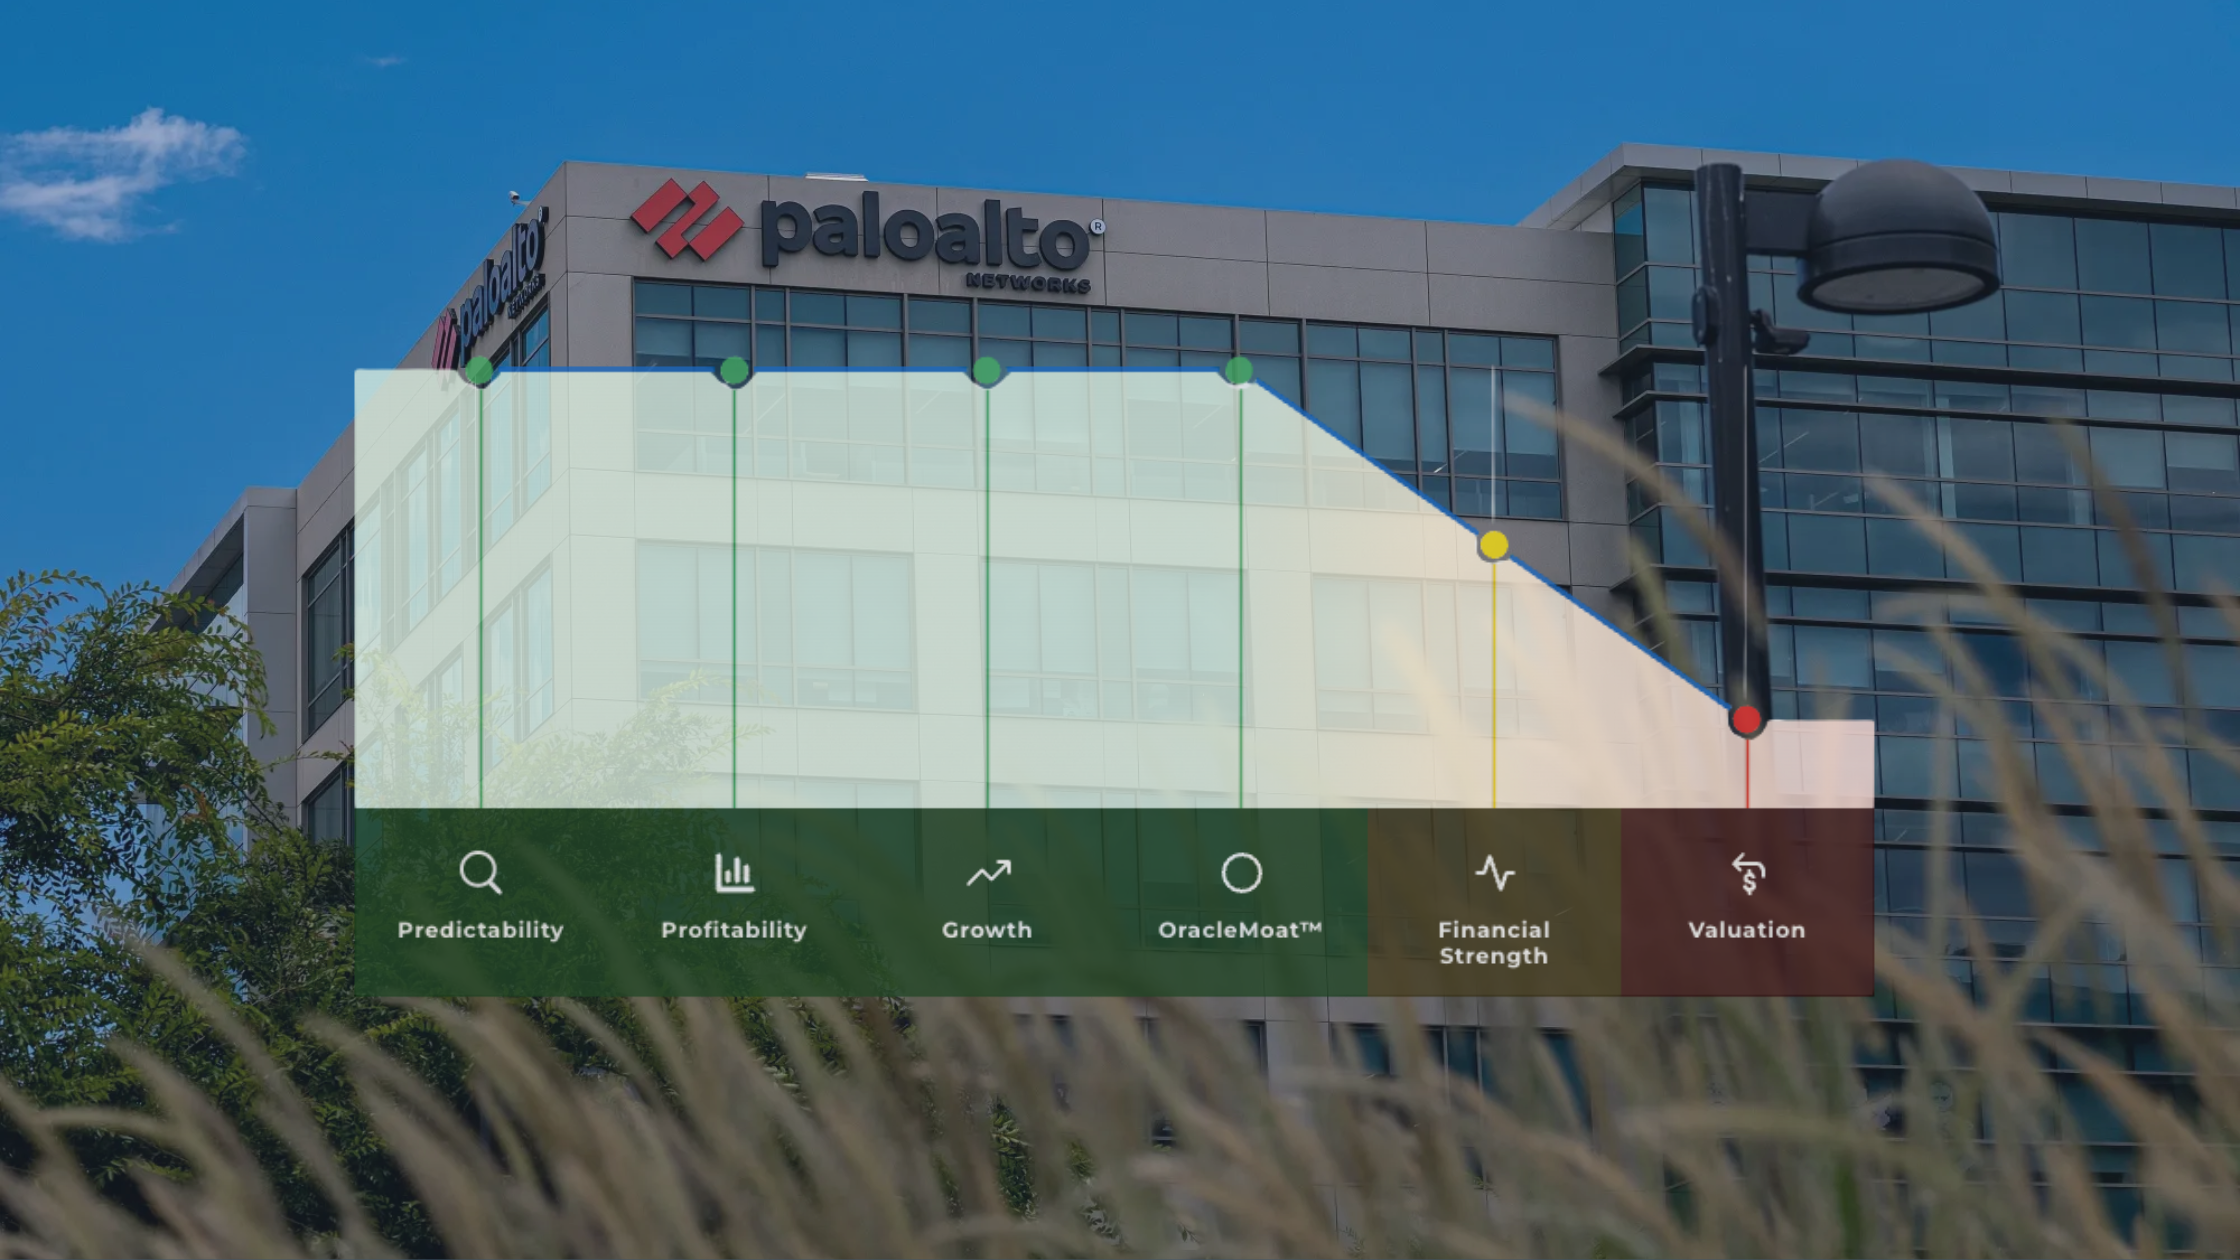
What Are the Current Magnificent 7 Stocks' OracleIQ™?

7 Stocks OracleIQ™ Comparison - Powered by StockOracle™ - 25th March 2026
OracleIQ™ is a visual health check. Instead of digging through financial statements, OracleIQ™ condenses the most important data into one clear, at-a-glance view.
Viewed through OracleIQ™, the Magnificent 7 continues to share strong foundations, with Predictability, Profitability, OracleMoat™, and Financial Strength largely in the green across the group. The main differences continue to emerge in Growth and Valuation, where varying growth outlooks and pricing expectations create meaningful gaps in overall OracleIQ™ scores.
Find out your favorite stocks' OracleIQ™ for Free
Has Anything Changed in OracleIQ™ Since January 2026?
Comparing the current OracleIQ™ profiles to our previous Magnificent 7 analysis from 13th January 2026, the overarching story remains consistent: the Magnificent 7 shares a common foundation of high Predictability, Profitability, OracleMoat™, and Financial Strength.
The most meaningful shifts since January have occurred in Valuation. Microsoft and Meta have both seen their Price-to-OracleValue™ ratios move further below 1.0, potentially reflecting market overreaction to near-term headwinds rather than fundamental deterioration.
Macro shifts since January 2026, including changes in oil expectations, supply chain dynamics, and inflation, have led to a re-evaluation of all stocks. These factors are significant because they influence interest rates and consumer confidence/spending.
Growth and Valuation remain the two dimensions where the Mag 7 shows the most differentiation — and this is exactly where the upcoming April–May earnings cycle will provide the next round of data points.

This analysis is shared for educational purposes to illustrate how markets and valuation models react to new information. It is not intended as financial advice or a recommendation on any investment.