By Piranha Profits Team
Last updated on August 14, 2026
Oracle's order backlog hit $638 billion last quarter, up 363% year-over-year while its free cash flow for the same fiscal year came in negative.
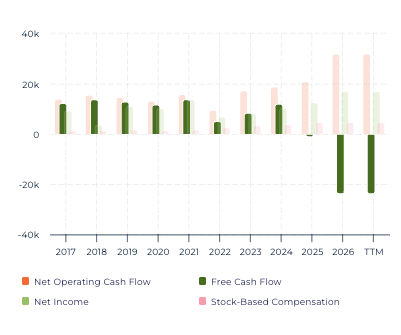
The stock is up nearly 9% in the past month alone, and StockOracle™ tags it with a Narrow Moat rating. A backlog that size and a cash flow statement that is red is exactly why the usual discounted cash flow playbook breaks down. And that’s why this article leans on a different valuation lens instead.
What Does Oracle Actually Do?
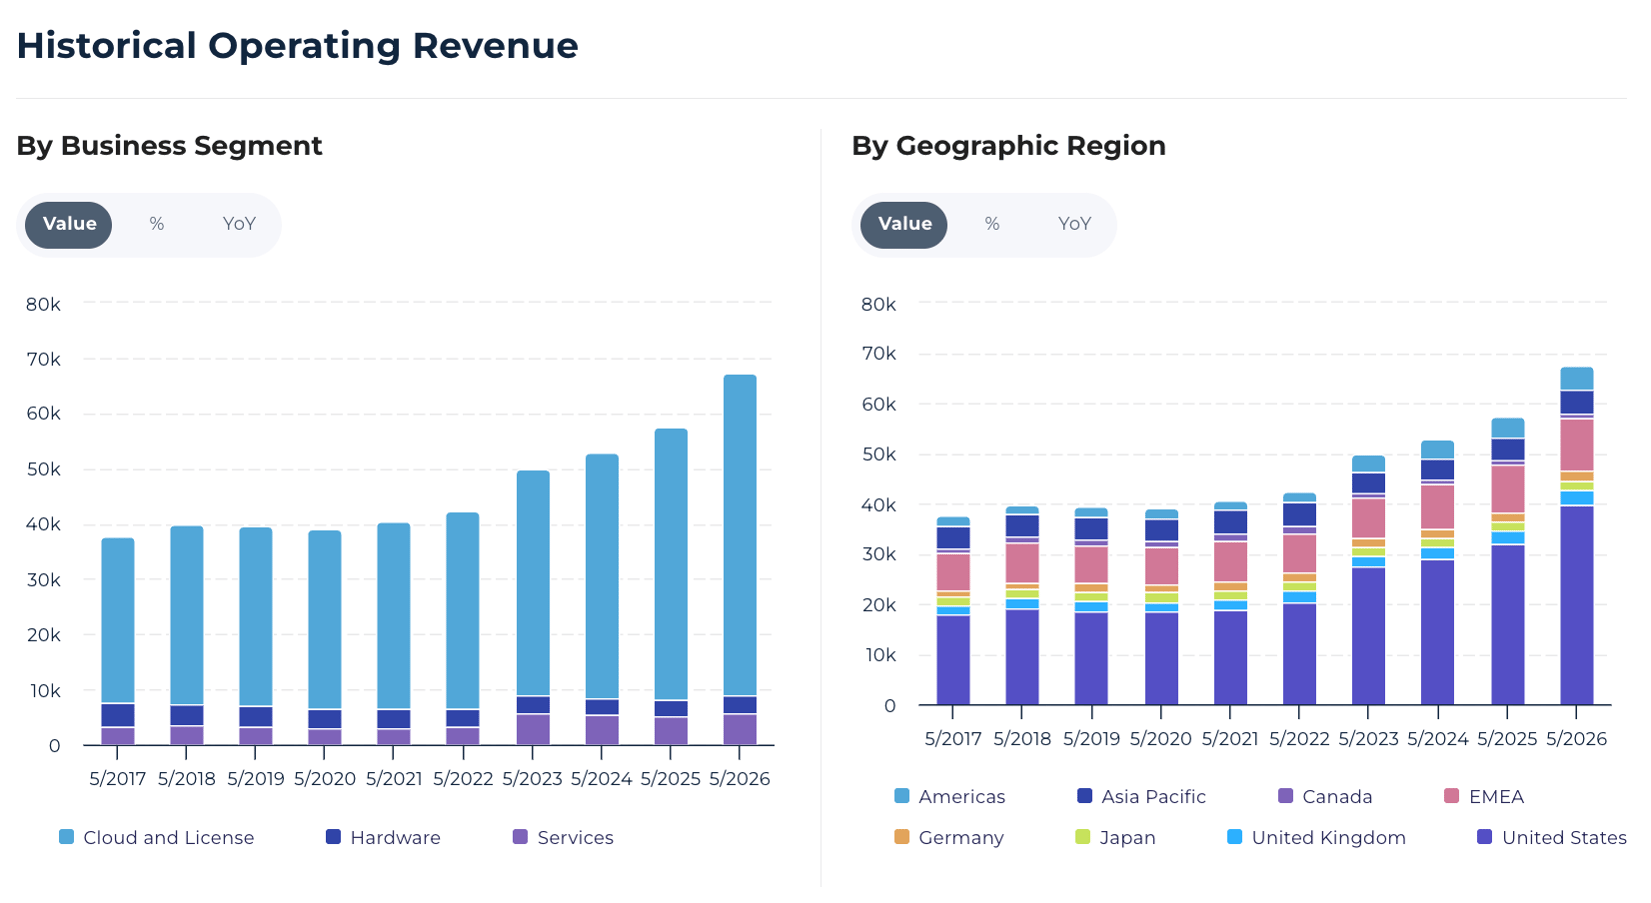
Oracle built its name on the enterprise database. The software that banks, airlines, and governments have relied on for decades to store and run their core operations.
That business (bundled today under "Cloud and License") is still the company's largest segment.
What's changed is the second act: Oracle has spent the last few years turning its data centers into rented AI computing power through Oracle Cloud Infrastructure (OCI), competing for the same AI training and inference workloads as AWS, Microsoft Azure, and Google Cloud. It also still sells enterprise applications (Fusion, NetSuite) and, to a shrinking degree, on-premise hardware.
What Is Oracle's Intrinsic Value?
Intrinsic value is an estimate of what a business is actually worth based on the economics it can realistically generate. Not whatever price the market happens to put on it today. For a company mid-transition like Oracle, the "right" way to estimate that number depends heavily on which lens you use, and that's the question this article works through.
Why the Price-to-Sales-Growth (PSG) Ratio Could be the Better Lens Here
StockOracle™ 's Price to Sales Growth (PSG) calculator ties a company's price-to-sales multiple to how fast its sales are actually growing. The sales-based cousin of the classic PEG ratio.
Run Oracle's own numbers through it and the calculator puts fair value near $141.99 a share, modestly below where the stock last traded. That gap isn't a verdict on its own. It's a direct function of the inputs feeding the model, and every one of them is something you can open up and test with StockOracle™.
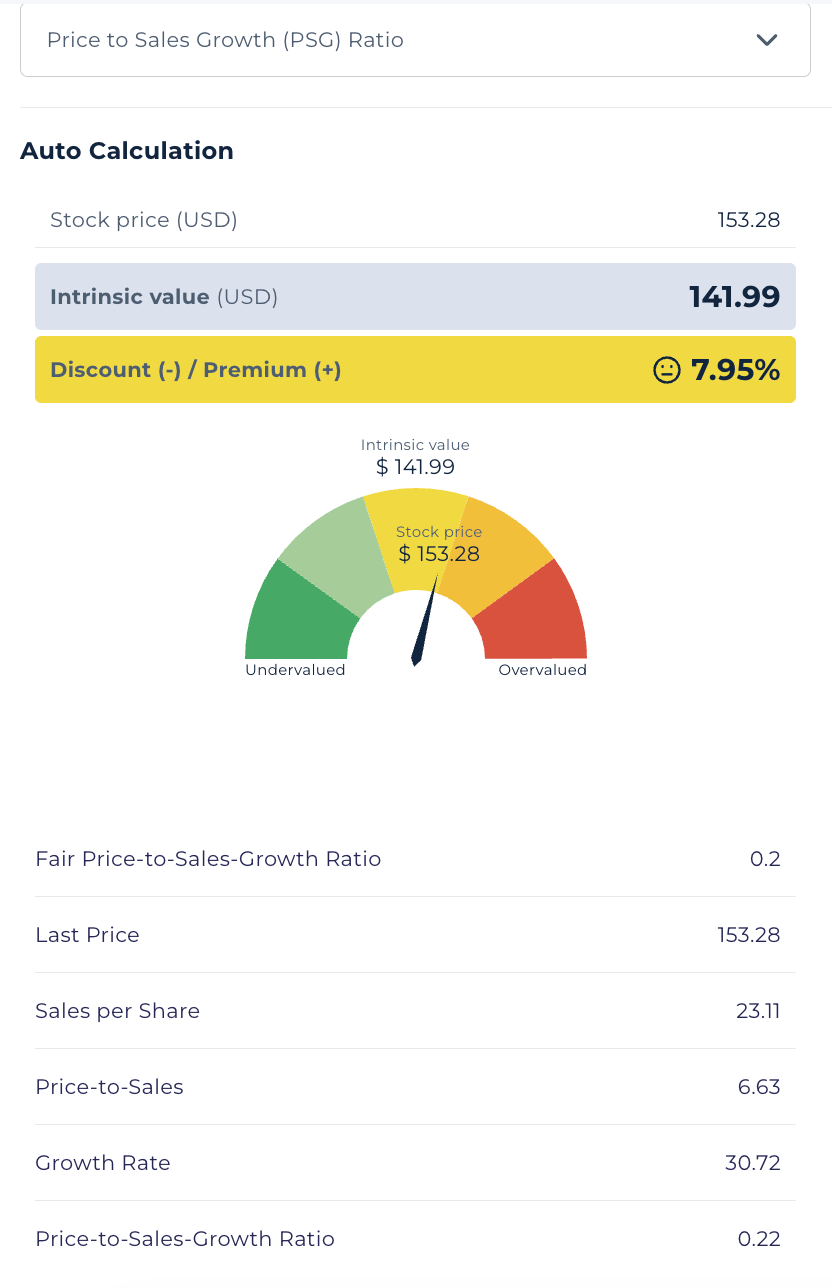
Oracle (ORCL) PSG Calculator — Powered by StockOracle™ · Accurate as of 13 August 2026
Here's what's actually inside that number:
- Sales per share ($23.11) : Basically Oracle's trailing revenue divided by shares outstanding. It's pulled straight from the financials.
- Price-to-sales (6.63x) : the current stock price divided by that sales-per-share figure. This moves automatically as the stock price moves.
- Growth rate (30.72%) : the variable. This is the assumed sales growth rate the model uses, and it's editable. Notably, it runs above the 25.71% projected 3–5 year EPS growth rate, a gap worth sitting with rather than accepting at face value.
- Fair Price-to-Sales-Growth ratio (0.2) — the benchmark that is also editable, and it's the assumption doing the most philosophical heavy lifting: it's a judgment call about how much the market should pay per point of growth, not a fact pulled from Oracle's financials.
Divide the actual price-to-sales (6.63) by the growth rate (30.72) and the model gets a PSG ratio of 0.22. Just a shade above the 0.2 benchmark, which is what produces the modest "overvalued" read using the PSG calculator.
The variable most worth stress-testing is just the growth rate. A 30.72% assumption compounded every year means Oracle's sales base would need to roughly double every 2.6 years, or grow almost 3.8-fold over five years to hold up. A pretty demanding pace for a company already generating tens of billions in annual revenue.
Dial that growth assumption down toward Oracle's own recent guidance, or nudge the "fair" PSG benchmark up to reflect a business with a genuine AI infrastructure moat, and the fair-value output moves in either direction. That's the real value of running it yourself rather than taking one snapshot as the gospel truth.
Why a Discounted Cash Flow Model Doesn't Work for Oracle Right Now
A DCF or DFCF model works by projecting a company's future free cash flow and discounting those projections back to today's dollars. It typically starts from the business's current free cash flow base.
Oracle's free cash flow yield (TTM) sits at -5.59%, meaning the business is burning cash on a trailing basis, not generating it.
In short, Oracle's free cash flow can't serve as a valid starting point for a cash-flow model right now, which is exactly why the Price-to-Sales-Growth ratio that is anchored to revenue instead could be the steadier lens for this business at this stage.
When a company needs a different valuation model than the standard DCF, it's usually a sign the business is mid-reinvestment or going through a structural shift.
Debt and Liquidity: Funding the Build-Out
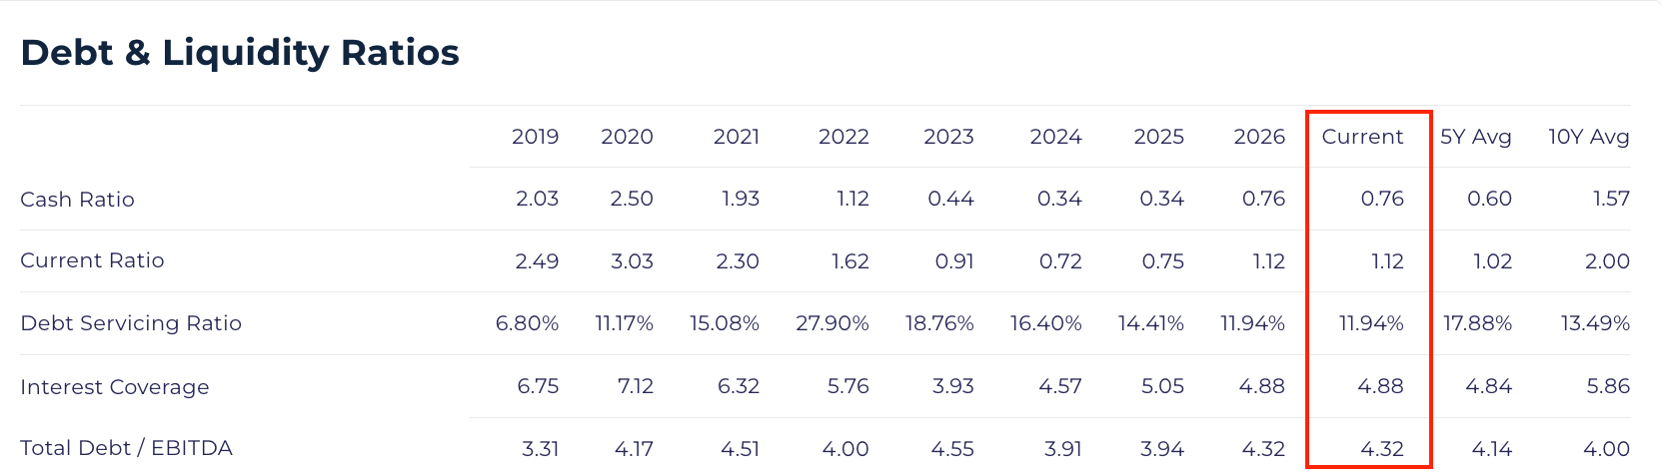
ORCL Debt & Liquidity Ratios — Powered by StockOracle™ · Accurate as of 13 August 2026
Oracle's balance sheet tells the same capex story from a different angle. Total debt-to-EBITDA sits at 4.32x, modestly above both the 5-year and 10-year average.
In simple terms, that means it would take Oracle roughly four years of EBITDA just to pay off its existing debt, assuming none of that EBITDA goes toward anything else. To some investors, a ratio that high on its own is a flag: it can read as a business that's a little over optimistic, and a hint that the growth rates baked into models like the PSG calculator above may be running a touch higher relative to how much debt is backing them. Oracle has leaned harder on debt over the past year specifically to fund the AI infrastructure build-out, with external reporting pointing to more than $40 billion in additional debt and equity financing planned for the year ahead. That's a real trade-off, the same borrowing funding the growth assumptions behind the PSG model above is also the reason the balance sheet looks tighter.
Oracle’s Moat and Growth Catalysts
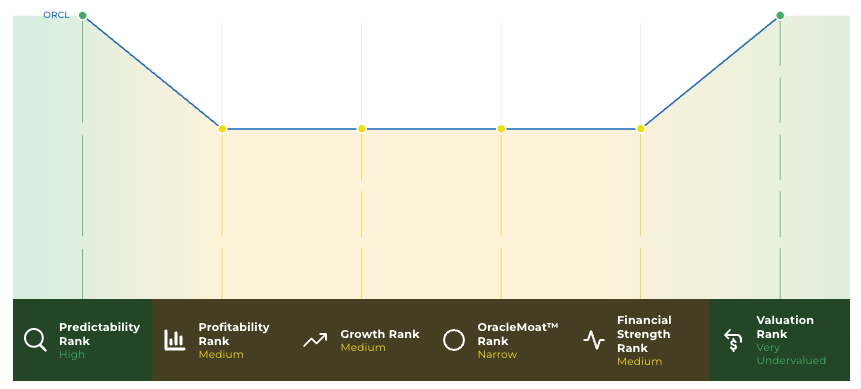
ORCL OracleIQ™ — Powered by StockOracle™ · Accurate as of 13 August 2026
StockOracle™ rates Oracle a Narrow Moat business. The case for it: Oracle's database has been embedded in enterprise back offices for decades, which makes ripping it out expensive and risky. Real switching costs, not just brand loyalty.
On the AI infrastructure side, Oracle's specific edge clearly isn't scale (AWS, Azure, and Google Cloud all run larger overall cloud footprints); it's specialized high-performance networking that has made OCI attractive for large AI training clusters specifically, and a partnership structure Oracle Database@Azure that turned Microsoft into a distribution channel rather than a pure rival.
The growth case rests almost entirely on converting that $638 billion order backlog into actual delivered revenue over the coming years. The risk case is the mirror image: if AI demand cools or GPU supply gets constrained before that backlog converts, Oracle is left holding expensive, underutilized data centers funded by a lot of new debt.
Test the Assumptions Yourself
The PSG calculator above isn't a black box. The growth rate and the "fair" PSG benchmark are both fields you can change and rerun. If 30.72% feels too aggressive, try Oracle's trailing revenue growth instead. If a 0.2 "fair" benchmark feels too conservative for a company with genuine AI infrastructure demand behind it, nudge it up and see where the fair value lands. Run your own scenario through StockOracle's free calculator.
Final Thoughts on Oracle's Intrinsic Value
- Revenue and cloud bookings are both accelerating sharply, with a $638 billion backlog as of the most recent quarter.
- Free cash flow is negative on a trailing basis because capital expenditure on AI data centers is currently outrunning operating cash flow.
- The PSG calculator's current inputs point to a modestly overvalued read, but the growth-rate and fair-ratio assumptions behind that number are both adjustable and worth testing independently.
- Debt-to-EBITDA and liquidity ratios have both drifted above their historical norms as Oracle leans on new borrowing to fund the build-out.. Worth watching as that financing continues.
- The moat case rests on genuine switching costs in its database business and a specialized networking edge in AI training, not on outright cloud market-share scale.
This analysis is shared for educational purposes only and is not intended as financial advice or a recommendation to buy, sell, or hold any security. The PSG-ratio figures above are a model output built on stated, adjustable assumptions — not a fixed or guaranteed valuation — and should not be treated as a standalone signal. Past performance, including any figures referenced above, is historical and is not indicative of future results. Piranha Profits and StockOracle™ are financial education providers and are not licensed financial advisors; all figures, especially third-party earnings and financing data, should be independently verified before publication.
Related
Boeing and Airbus both want to build more single-aisle jets faster, and both are waiting on the ...

For most of its 24-year life, the company was private. The figures floating around came from leaks, ...

A business that still earns a 22.8% return on invested capital, carries no interest-bearing debt, ...