By Piranha Profits Team
Last updated on September 28, 2026
Wells Fargo & company’s (WFC) total assets have been stuck between $1.90 trillion and $1.97 trillion from 2017 through 2024.
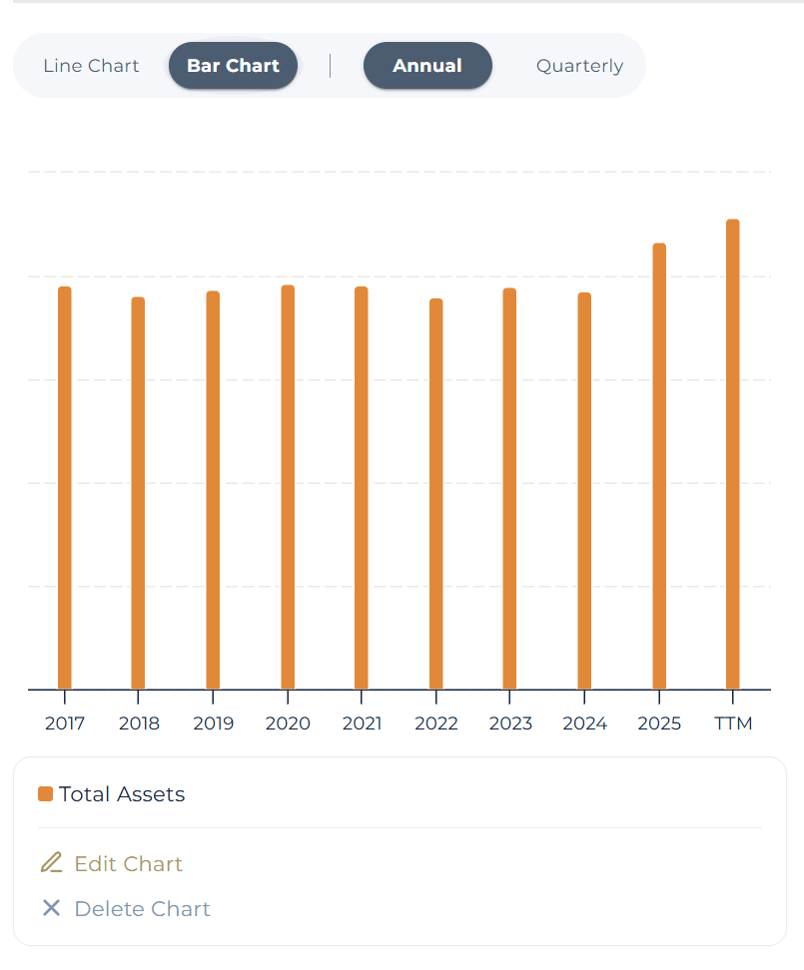
Fifteen months after that cap came off, the bank is growing again: average loans rose 12% in the second quarter and return on tangible common equity hit 17.7%, with management's own target, yet the stock is down around 0.22% over the past year. So is the market still pricing the old, capped Wells Fargo, or has it already paid in full for the new one?
What is Wells Fargo's intrinsic value?
Intrinsic value is an estimate of what a business is worth based on the earnings it can sustain over time, not the price the market happens to quote on a given day. For WFC intrinsic value, that estimate depends less on cash flow and more on one question: how much profit can Wells Fargo earn on each dollar of shareholder equity now that it is free to grow?
Wells Fargo is one of the largest US banks, with about $1.47 trillion in average deposits and $1.03 trillion in average loans in the second quarter of 2026.
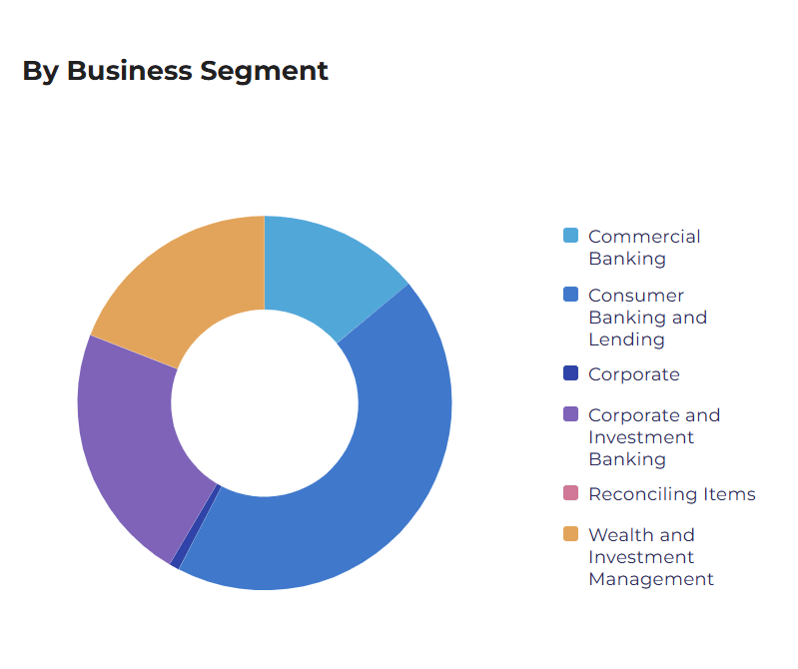
It runs four segments: Consumer Banking and Lending, Commercial Banking, Corporate and Investment Banking, and Wealth and Investment Management, according to its second-quarter 2026 earnings release.
Wells Fargo & Company (WFC) Fair Value: Why Cash Flow Models Stall for a Bank
A DCF20 model might not produce a usable answer. StockOracle's 20-year discounted cash flow (DCF-20) and discounted free cash flow (DFCF-20) models return no value for Wells Fargo, a figure that says more about the model than the bank.
The reason is mechanical. A bank's "debt" is mostly the funding it lends out, so the cash flow model sees $459.1 billion of total debt against trailing operating cash flow of just $6.9 billion. WFC free cash flow was negative $14.5 billion in FY2025, not because the bank lost money, but because deposit, loan and securities flows run through the same line.
The models that do fit a bank are built on earnings and book value, and they split into two clear clusters:
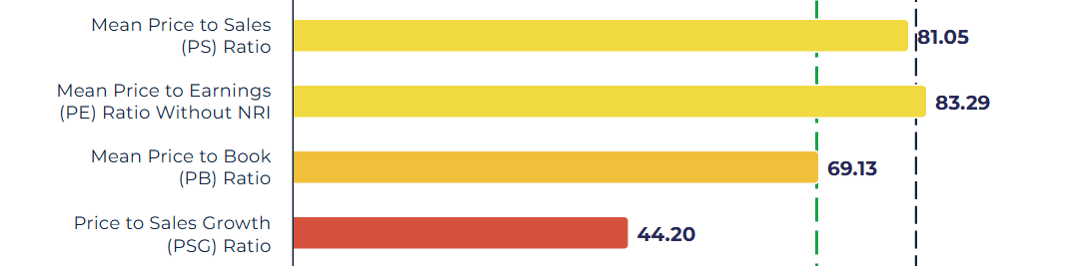
- Earnings-based: Mean P/E $83.29, Median P/S $83.37, Mean P/S $81.05
- Book-based: Mean P/B $69.13 (at a 1.53x multiple)
The earnings cluster sits close to where the stock trades today. And the book-based cluster sits well below it. That gap is the entire WFC fair value debate: the earnings models accept today's profitability, while the book models assume Wells Fargo deserves the book multiple it carried during its scandal and asset-cap years.
The Special Lens For Banks: Price-to-Book Against Return on Equity
Book value is a bank's capital cushion, and return on equity (ROE) measures how hard that cushion works. A bank earning 13% on equity deserves a higher multiple of book than one earning 9%, so price-to-book only means something beside ROE.
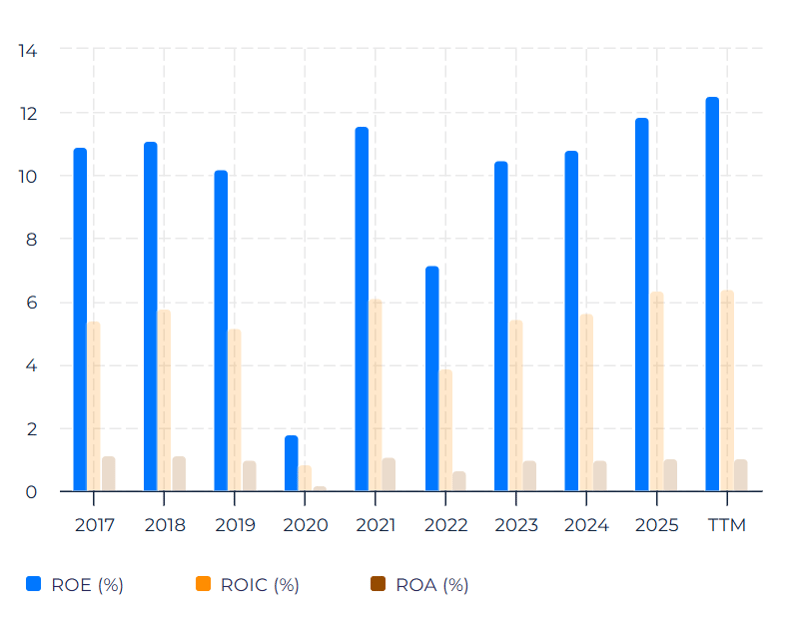
Both sides of that pairing have moved up. Wells Fargo trades at 1.53 times book versus a five-year average of 1.27x and a ten-year average of 1.29x. ROE has climbed to around 12.52% versus a five-year average of 10.37% and a ten-year average of 9.71%.
The multiple has actually cooled this year even as returns improved. P/B stood at 1.75x at the end of FY2025, and trailing P/E has eased from 14.90 to 12.57 as earnings grew into the price.
Price-to-Tangible-Book: The Stricter Test
Tangible book value strips out goodwill and other intangibles, leaving the hard capital that would absorb losses in a downturn. For a bank still rebuilding trust with regulators, it could be the more conservative anchor.
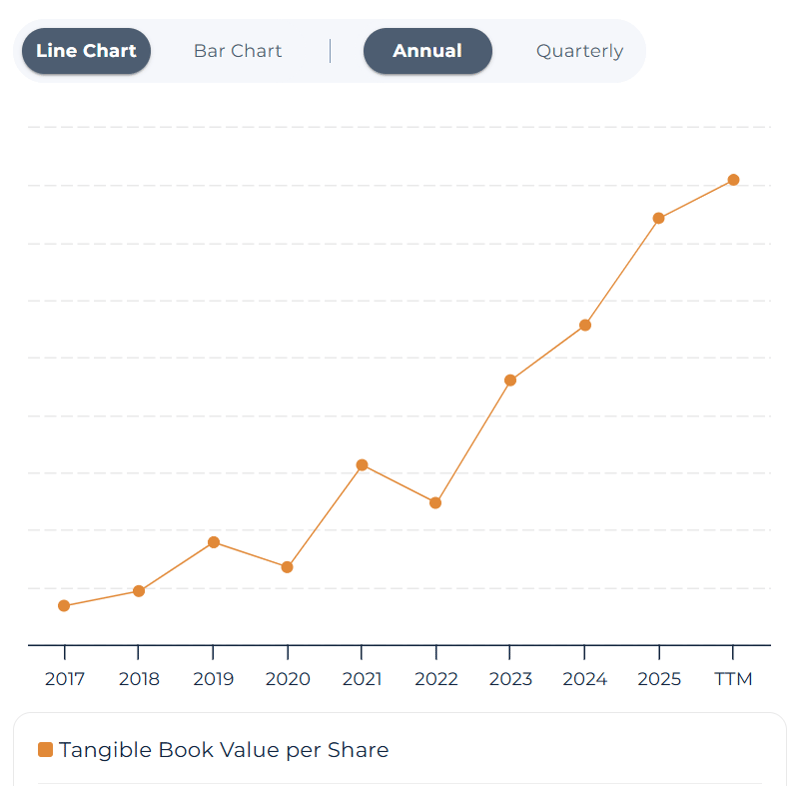
Wells Fargo's FY2025 tangible book value at $44.85 per share, up from $36.26 in FY2021. Meaning the net worth backing each share, after stripping out goodwill and intangibles, grew roughly 24% over that period, which matters because it's a cleaner gauge of a bank's underlying capital strength and a common yardstick for whether the stock trades cheap or rich relative to its real equity base.
Wells Fargo (WFC) Financial Performance
The Asset Cap Is Gone, and the Balance Sheet Shows It
The Fed imposed the cap in February 2018, citing "pervasive and persistent misconduct" after the fake-accounts scandal, and terminated it on June 3, 2025. Total assets reached $2,166.8 billion at FY2025 year-end, the first year-end meaningfully above the capped range, and $2.23 trillion by the end of the second quarter of 2026.
Loans are leading the way. Net loans grew 8.2% in FY2025 to $972.4 billion, and at September's Barclays conference CFO Mike Santomassimo said 2026 loan growth will likely beat the mid-single-digit pace originally guided. It is a runner who spent seven years training in a weighted vest, now racing without it.
Net Interest Income: A Bigger Balance Sheet, a Thinner Margin
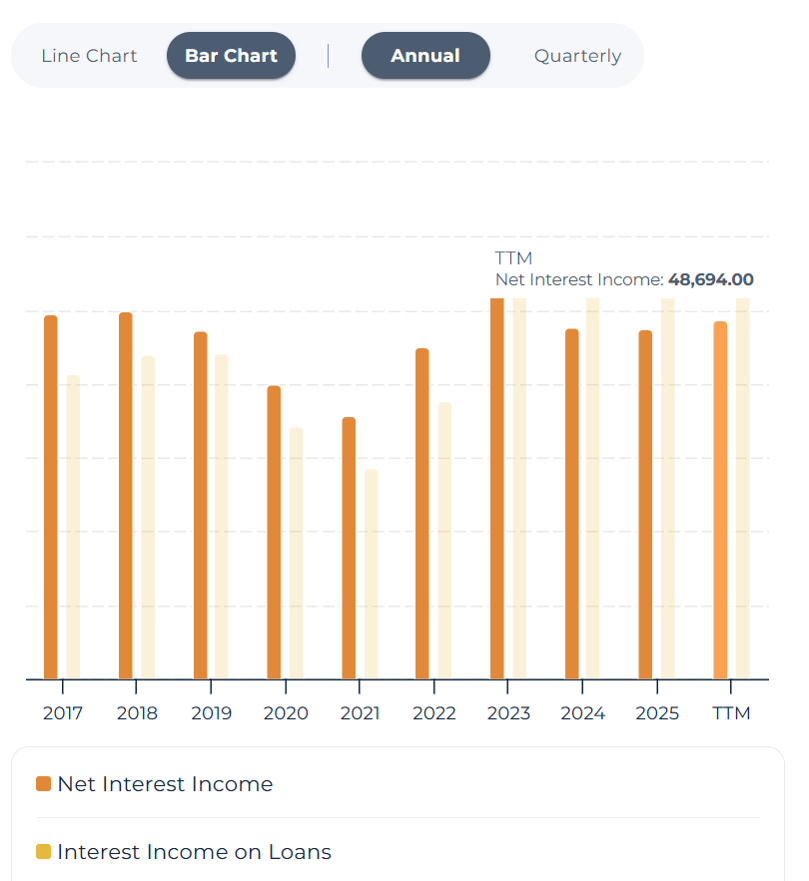
Net interest income has plateaued. It peaked at $52.4 billion in FY2023, easing to $47.5 billion in FY2025 and recovering to around $48.7 billion on a trailing basis. Management still guides to about $50 billion for 2026, per the second-quarter earnings call.
Growth is coming from volume, not spread. Net interest margin fell to 2.43% in the second quarter from 2.68% a year earlier, as newer lending and markets balances earn thinner spreads.
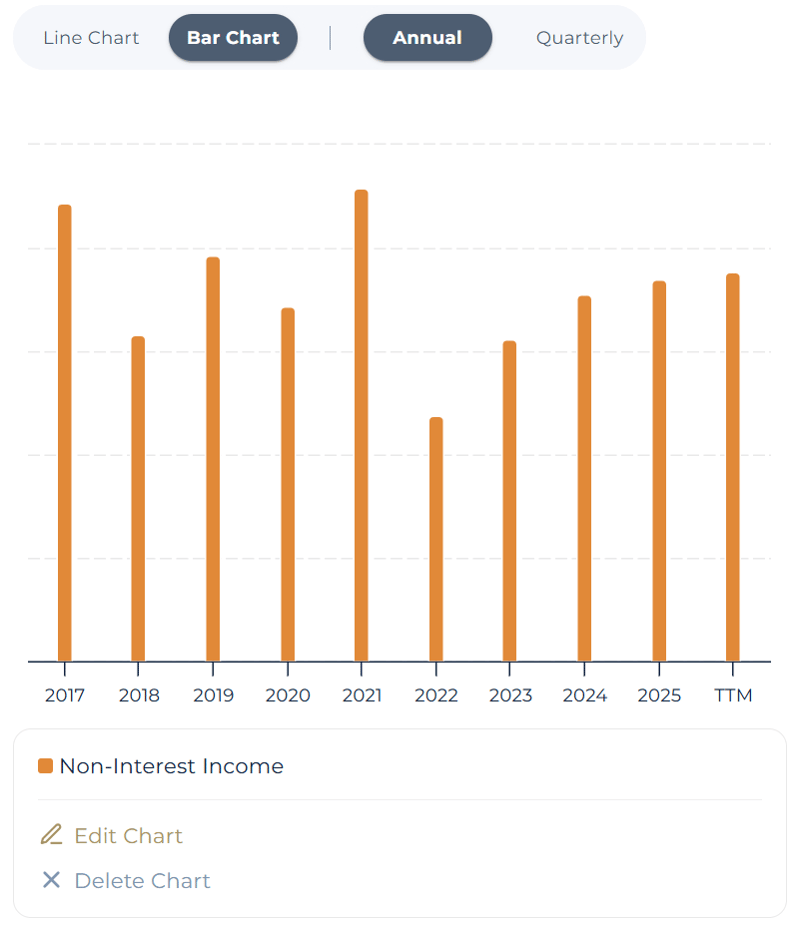
Fee income is carrying more of the load: non-interest income rose from $31.1 billion in FY2023 to $37.7 billion on a trailing basis, lifting total revenue to $82.6 billion.

Expense Discipline of Wells Fargo : Revenue Up, Costs Flat
Wells Fargo is growing revenue without growing its cost base. Trailing revenue is up 5.8% from FY2023, while non-interest expense slipped 1.2% to $54.5 billion over the same stretch.
That operating leverage is why trailing net income of $22.6 billion is up 18% from FY2023, faster than revenue growth.
Management's 2026 expense guide is about $55.7 billion.
Returns and Shareholder Payouts: Paying Out More Than It Earns
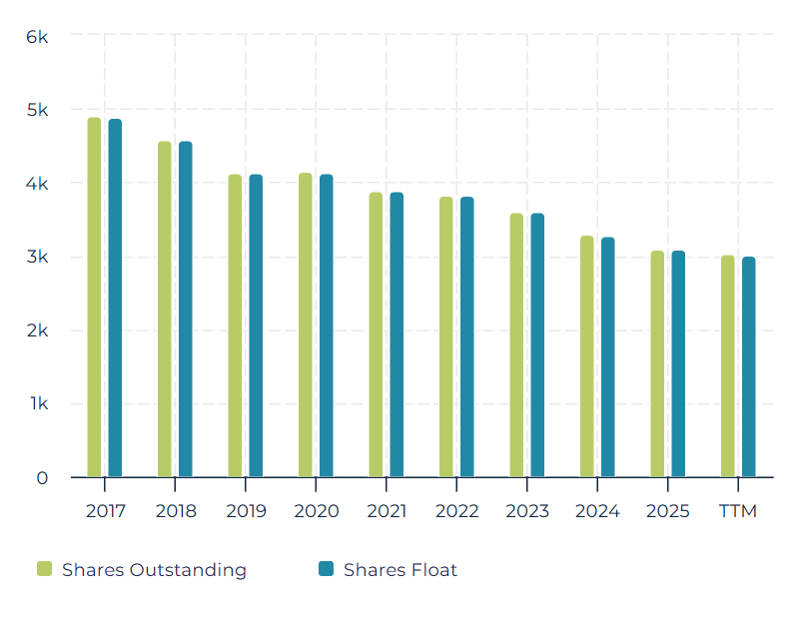
Buybacks are doing as much for per-share results as the business is. Diluted shares fell from 4,096 million in FY2021 to 3,075 million on a trailing basis, about 25% fewer. That is why trailing EPS of $6.88 is up 42% from FY2023 while net income rose 18%. Simply put, each remaining share now owns a noticeably larger piece of the bank.
The pace is running ahead of profits. Trailing buybacks of $21.5 billion plus dividends of $6.6 billion total about $28.1 billion.
Growth Catalysts
- Loan growth above plan: Average loans rose 12% year over year in the second quarter, and management now expects full-year growth above its original guide
- Corporate and Investment Banking: Segment revenue rose 16% and net income 34% in the second quarter, a business Wells Fargo is building out after years of constraint
- Capital rules: US regulators re-proposed the Basel III endgame capital rules in March 2026 in a form aimed at easing requirements, which could free capital for lending or buybacks if finalized
- Operating Effectiveness : In Q1 2026, Wells Fargo reduced headcount by 7%, achieving positive operating leverage as revenue rose 6 % while non‑interest expense increased only 3 %. The efficiency ratio improved, and the bank returned $5.4 billion to shareholders.
Economic Moat: StockOracle™ Rates Wells Fargo a Narrow Moat
StockOracle™ rates Wells Fargo a Narrow Moat. Its edge is a vast, low-cost US deposit base and deep middle-market commercial relationships, a real advantage but one shared by several rivals of similar or greater scale.
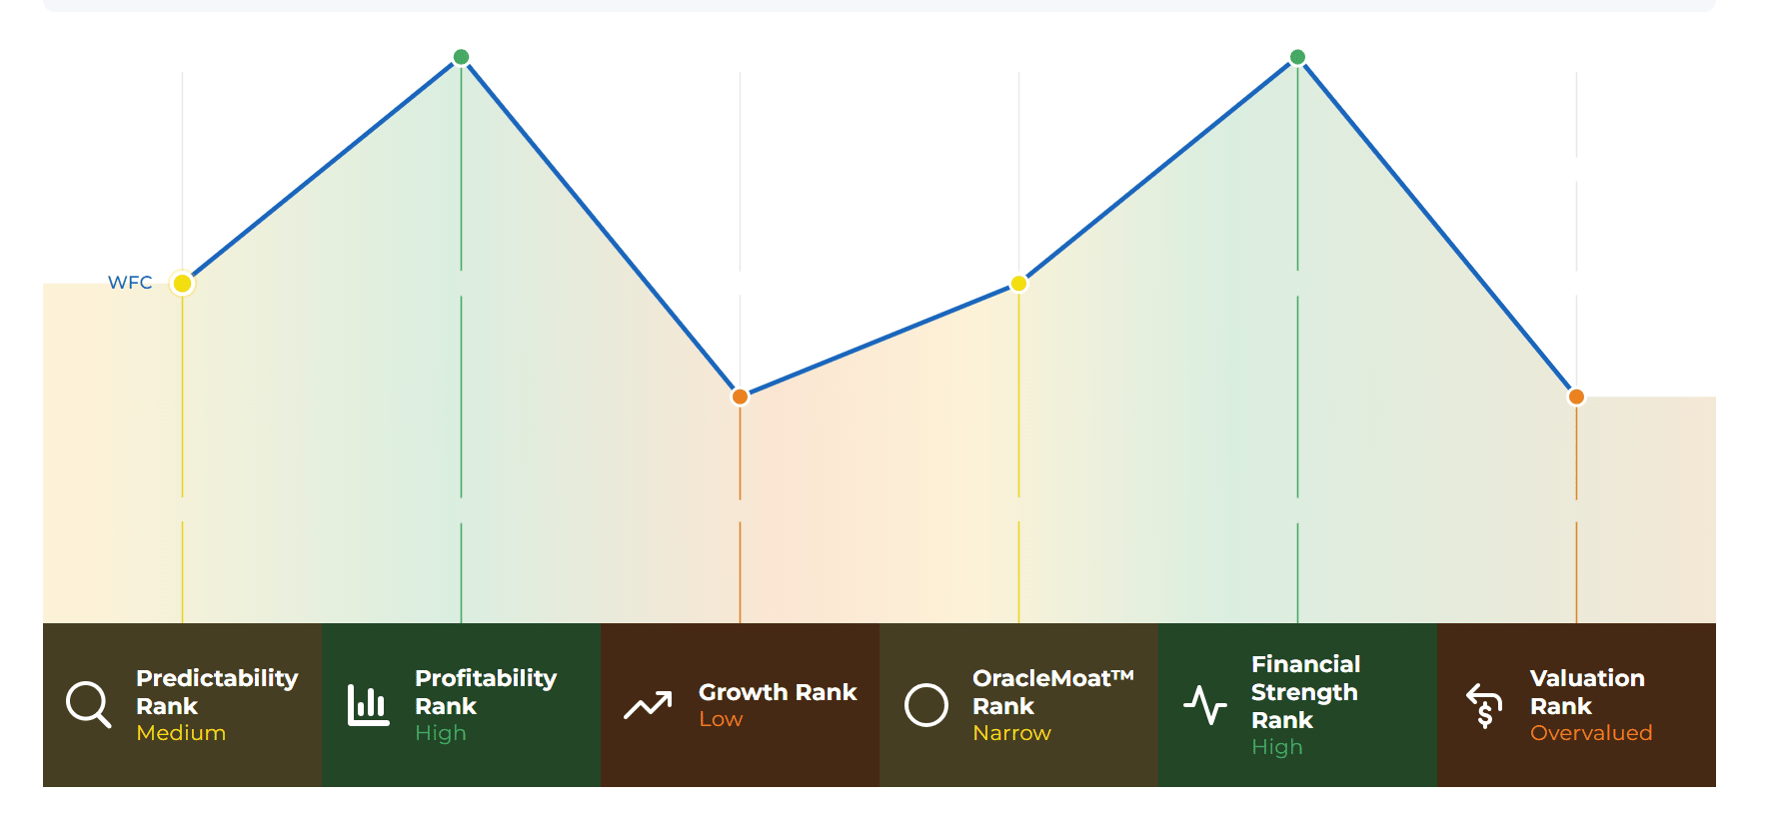
Wells Fargo has to defend against competitors whose advantages are specific and embedded, not easy to copy:
- JPMorgan Chase runs the largest deposit franchise in the country, with $2.6 trillion in total deposits, an 11.1% US retail deposit share in 2025, 94 million customers and more than 5,000 branches, per its 2026 company update
- Bank of America leans on digital engagement to win operating accounts, with 50 million active digital users, 24.6 million active users of its Erica assistant and about 70% of consumer sales digitally enabled in the second quarter.
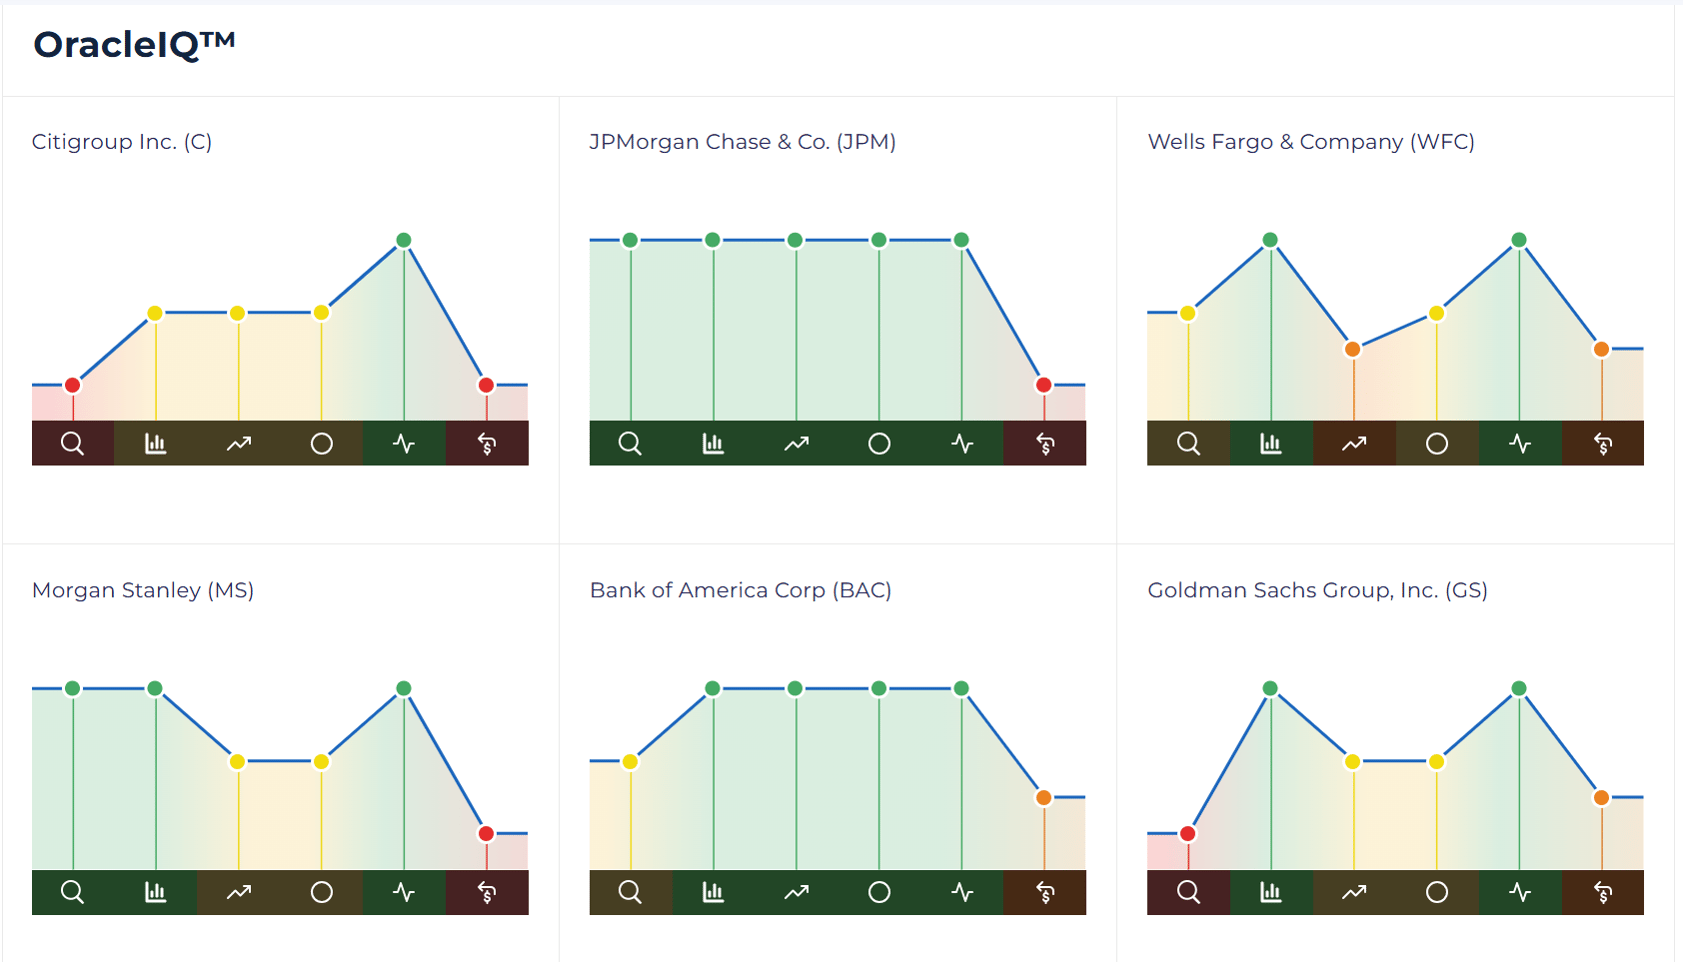
Those rivals explain the Narrow rather than Wide rating. What the moat protects is funding cost: sticky, low-rate deposits keep Wells Fargo's cost of money below smaller lenders’.
Final Thoughts on Wells Fargo's Intrinsic Value
- The Fed's asset cap ended on June 3, 2025, and total assets have since broken out of the $1.90 trillion to $1.97 trillion range they held from 2017 to 2024
- Book-based models ($66.57 to $69.13) sit lower because they anchor to a 1.22x to 1.27x book multiple from the scandal and asset-cap era
- ROE of 12.52% (13.13% on common) runs well above the ten-year average of 9.71%, and second-quarter ROTCE reached the 17% to 18% target
- Flat expenses and falling provisions are lifting earnings as loans expand
The recovery at Wells Fargo is visible. What the market has not yet settled is whether the higher returns are the new baseline or a strong stretch after years of constraint. If ROTCE holds near its target through a full credit cycle, the earnings-based models describe the bank better than its old book multiple does. If margins keep compressing and credit costs rise, the book-based models become much harder to dismiss, and the WFC stock valuation has less support than the recent earnings suggest.