Chevron has just recorded its highest quarterly profit in six years at $12.1 billion, helped by an Iran-Israel-driven surge that pushed Brent crude. By mid-August, Brent had cooled to $91.
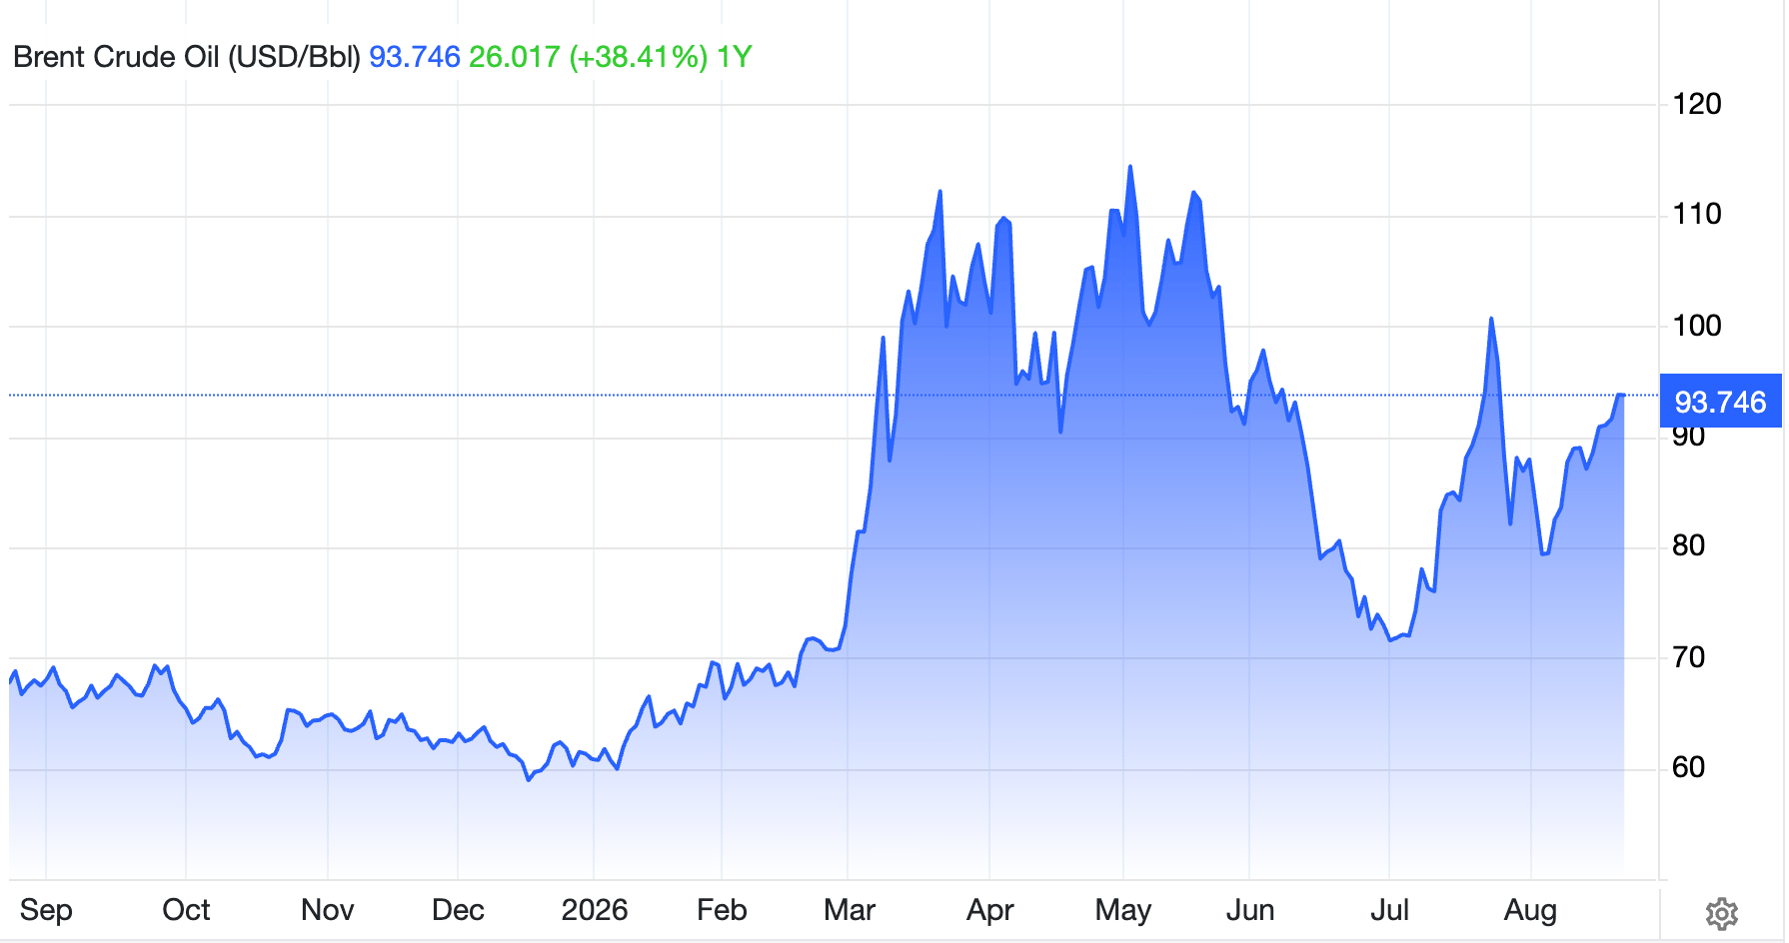
Accurate as of 21st August 2026
Chevron achieved $1.5 billion in annual run-rate Hess synergies ahead of schedule, while Permian production crossed 1 million barrels per day. The valuation question is whether investors are looking at a temporary oil-price windfall or a structurally stronger production base.
What Does Chevron Actually Do?
Chevron is an integrated oil major. Its upstream business explores for and produces crude oil and natural gas, including in the Permian Basin, Kazakhstan's Tengiz field and Guyana through the Hess acquisition. Its downstream operations refine and market fuels and chemicals.
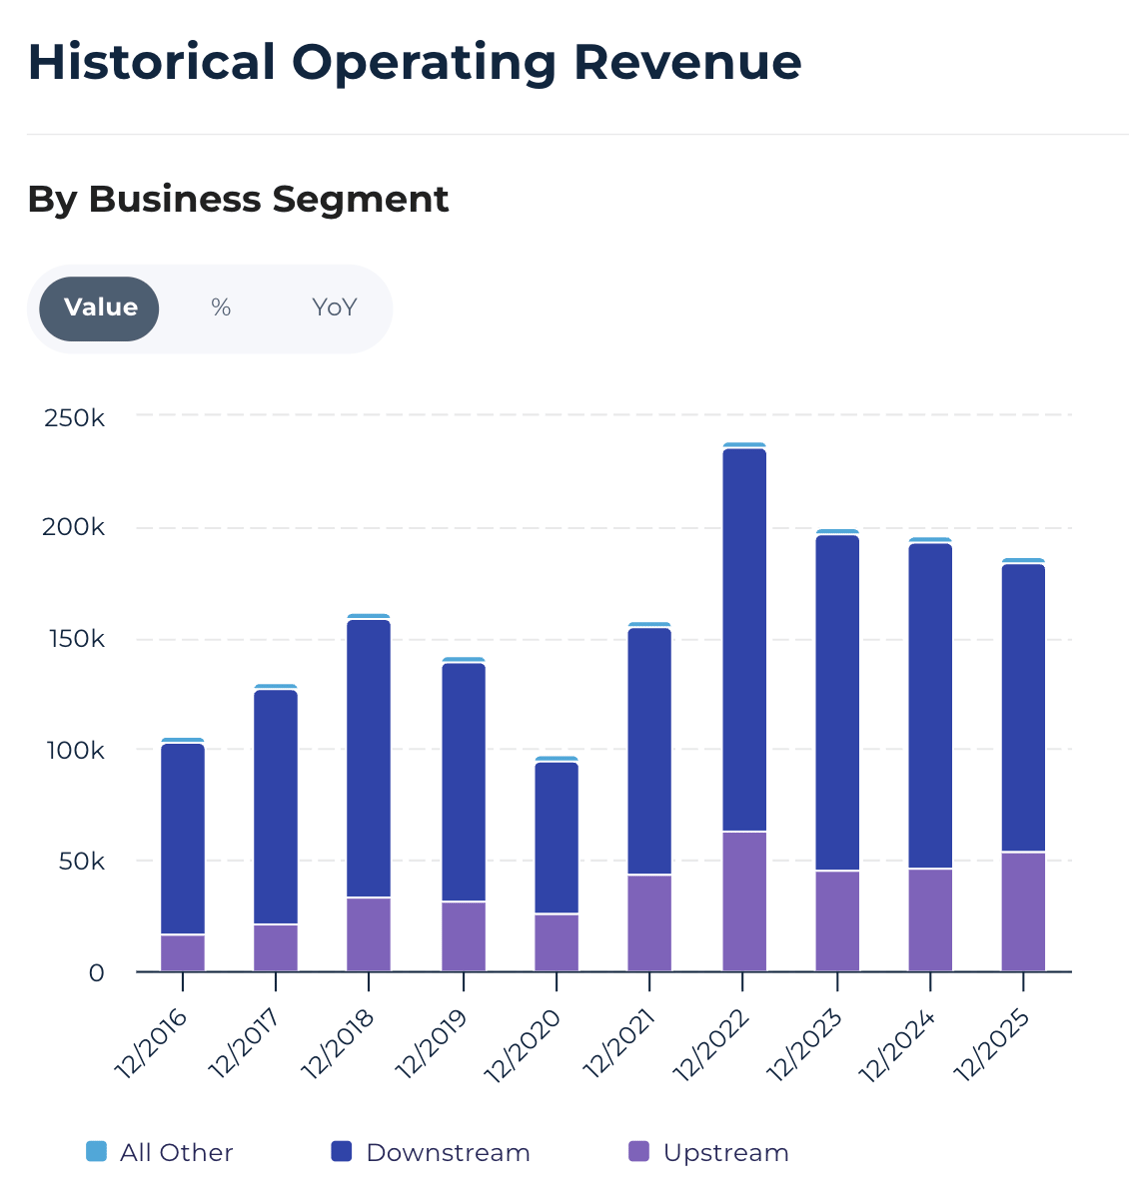
This structure provides some diversification, but Chevron's earnings still move heavily with commodity prices. Unlike a consumer or software company, it cannot set the market price of its main product. That cyclicality is central to its intrinsic value and your research as an investor.
What Is Chevron's Intrinsic Value?
Intrinsic value estimates what a business is worth based on the cash it can generate over time, rather than its current share price or one unusually strong quarter.
For Chevron, the challenge is the model used to evaluate the business. Using peak-cycle cash flow is like valuing a hotel on just its best holiday month. The result could be mathematically correct but economically misleading if and when conditions return to normal.
Chevron's Fair Value: What a 20-Year DCF Model Says
A 20-year discounted cash flow model estimates Chevron's fair value at about $574.31 per share, nearly three times the recent market price. It starts with trailing operating cash flow of $45.3 billion, adjusts for cash and debt, and discounts future cash flows at 5.79%.
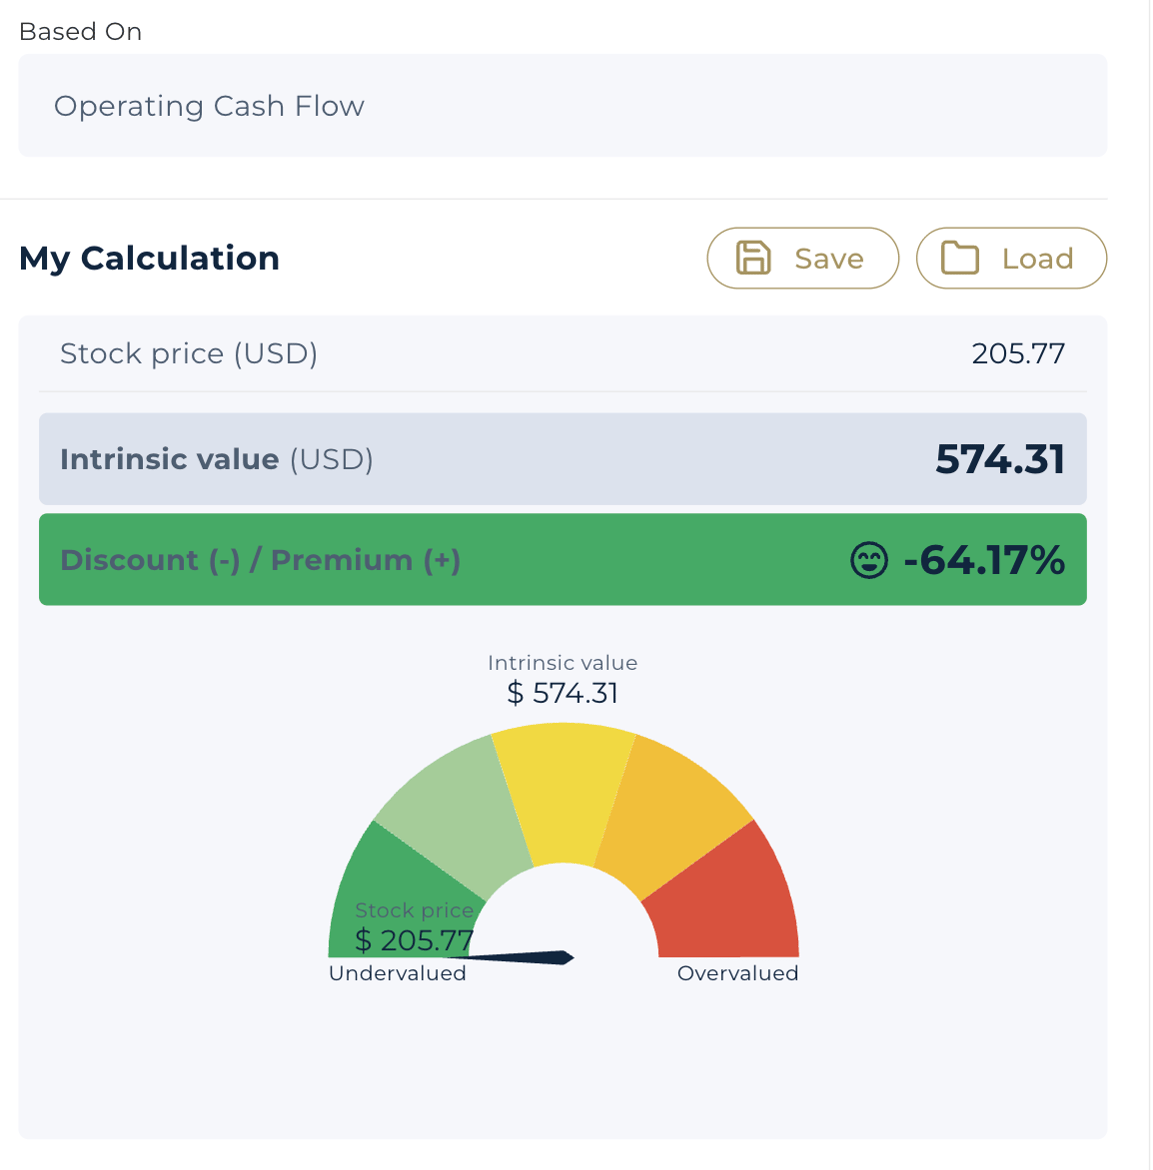
Chevron (CVX) Valuation Chart: 20-Year DCF Model. Powered by StockOracle™. Accurate as of 20 August 2026.
The model assumes 14.29% growth in Years 1 to 5, followed by 4% from Year 6 onward. Those rates are not the only concern. The starting cash-flow figure is also a point of argument in CVX intrinsic value.
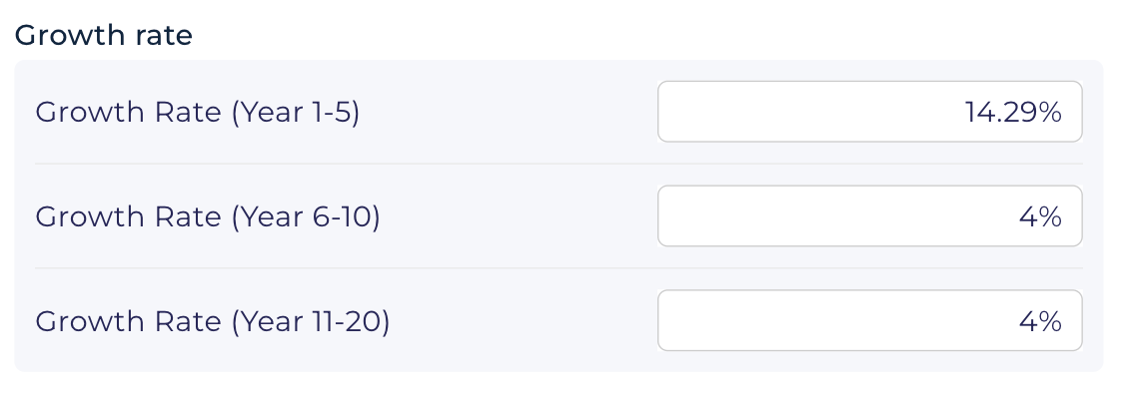
Trailing operating cash flow includes the benefit of the recent Brent spike. Fiscal 2025 operating cash flow was only $33.9 billion, roughly 25% lower. If oil prices normalize, compounding from the higher trailing figure could overstate Chevron's sustainable value. Secondly, the 1-5 year growth rates are also largely dependent on the macro market and events.
The bull case rests on genuine operational improvement. Hess synergies are ahead of schedule, and Permian and Tengiz production are reaching new highs. Management also expects double-digit annual free cash flow and EPS growth using a lower $70 Brent assumption.
The bear case is that Brent settles near $70 to $80 and the elevated cash-flow base contracts. Under that scenario, fair value would sit closer to a result built on normalized cash flow. Substituting the fiscal 2025 base would reduce the model output by roughly a quarter to a third, although the exact scenario should be tested using StockOracle™ intrinsic value calculator based on your own assumptions.

This is why Chevron is better valued with a range than a single point estimate. One scenario can use the current cash-flow base, another can use a normalized year, and a third can test a weaker commodity environment. If the stock appears attractive across several reasonable cases, the conclusion is more robust than one built entirely on today's oil price.
Investors should also separate business quality from valuation. Chevron can execute well operationally and still produce a disappointing investment result if the purchase price assumes high oil prices indefinitely. Conversely, a conservative market price can provide a margin of safety even when near-term earnings decline with Brent.
Chevron (CVX) Financial Performance
Revenue: A Beat, With a Geopolitical Assist
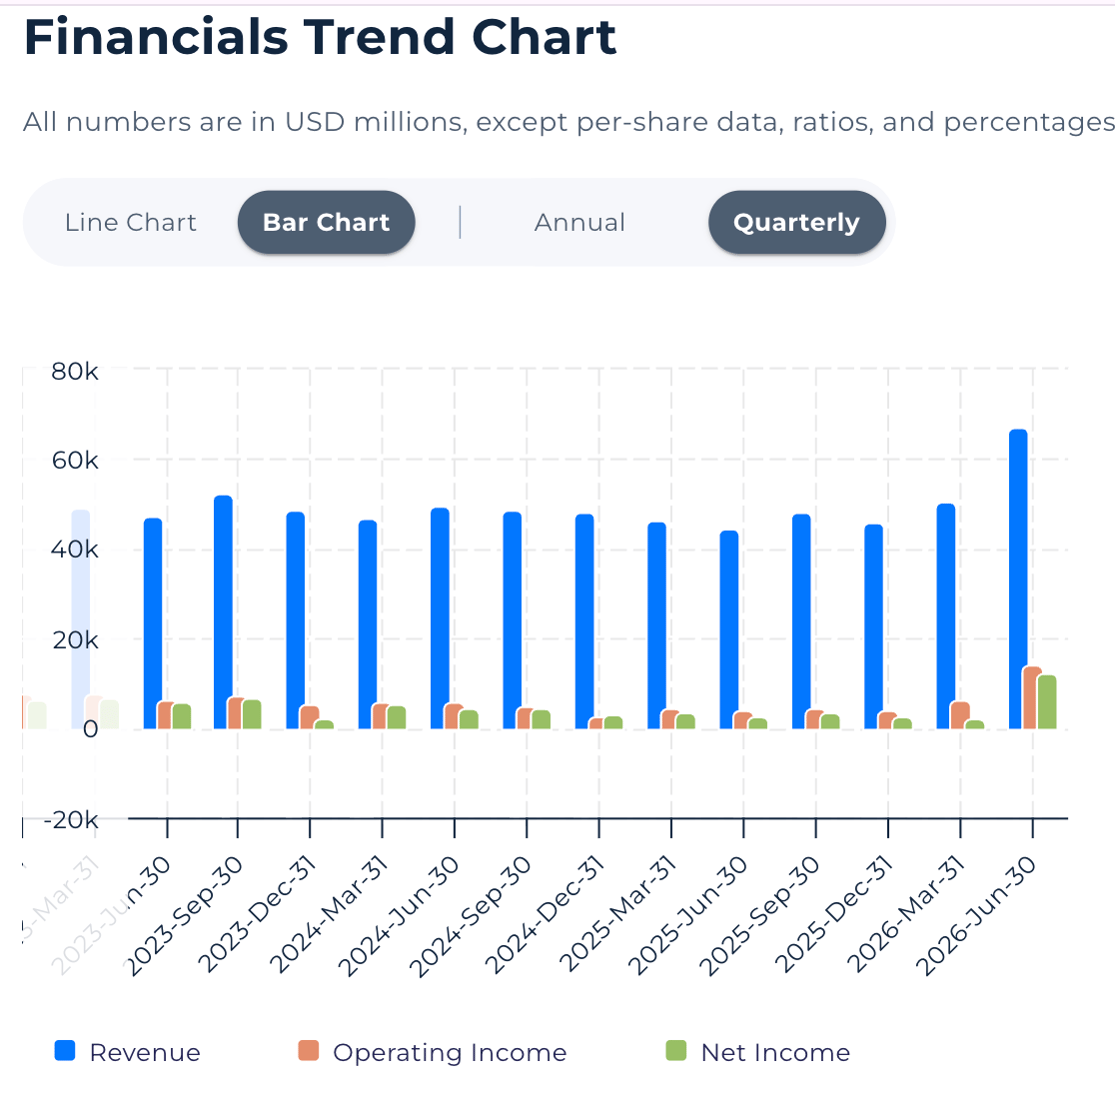
Chevron (CVX) Revenue, Operating Income and Net Income Trend. Powered by StockOracle™.
Revenue growth reflects both higher production and stronger oil prices. Trailing revenue reached $211.5 billion, up from $184.5 billion in fiscal 2025. Second-quarter revenue was $70.1 billion, compared with $44.8 billion a year earlier.
The operating improvement is real. Worldwide production rose roughly 20%, supported by Hess and organic growth in the Permian and Gulf of America. However, Brent averaged $104 during the quarter versus $68 a year earlier. Investors should not attribute the entire revenue increase to higher output.
The distinction affects forecasting. Production growth can persist as new projects ramp, but the oil-price contribution can reverse within a quarter. A useful revenue forecast should therefore model volume and realized pricing separately instead of extending the latest reported growth rate.
Free Cash Flow: Stronger, but Still Cyclical
Free cash flow is the cash left after funding operations and capital expenditure. For an oil producer, it changes with commodity prices that management cannot control.
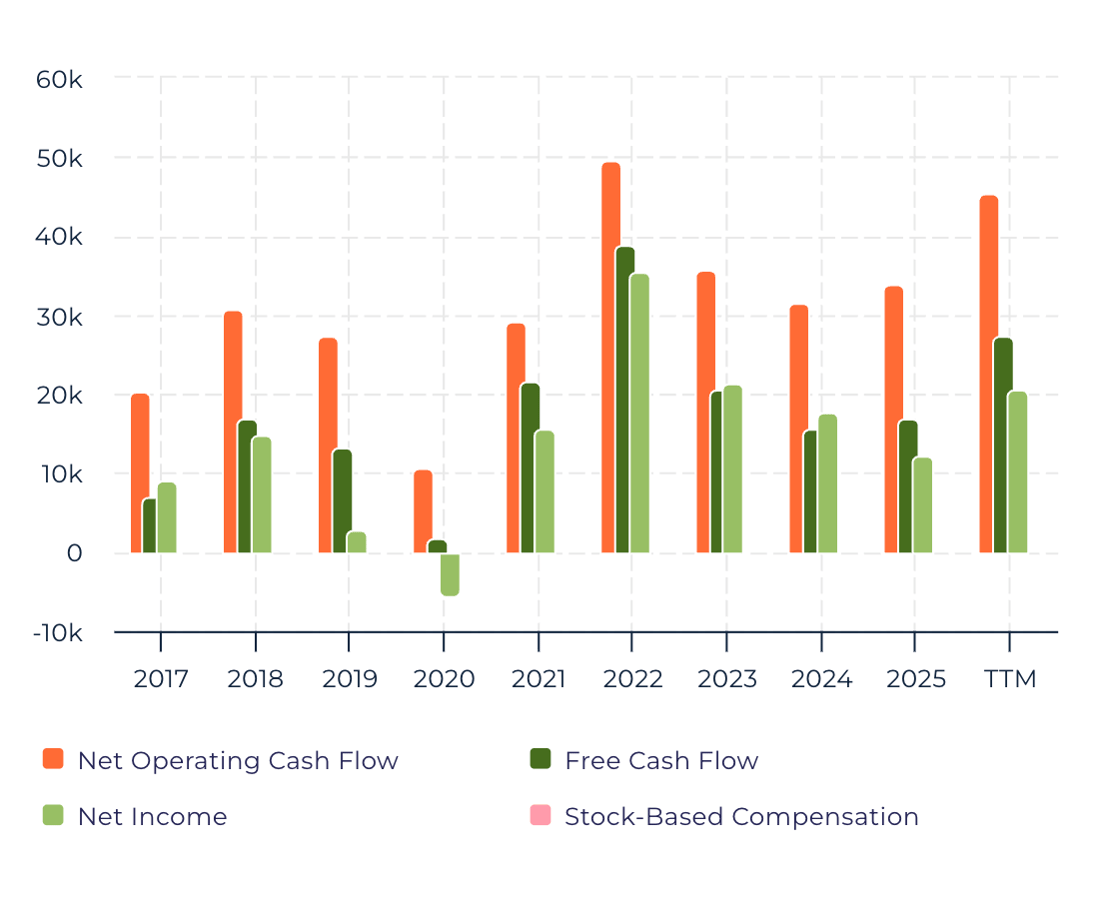
Chevron (CVX) Operating Cash Flow and Free Cash Flow Trend. Powered by StockOracle™.

Chevron's trailing free cash flow margin improved to 12.89% from 9.11% in fiscal 2025. Part of that recovery reflects higher Brent prices rather than a permanent margin reset.
Capital discipline is the more durable signal. Chevron guides for annual capital spending of $18 billion to $21 billion through 2030 and says it can cover capital expenditure and dividends below $50 Brent. This suggests the business can generate cash under weaker pricing, even if current margins do not persist.
Lower breakeven costs create resilience rather than immunity. If Brent falls sharply, cash available for buybacks will still decline before essential project spending or the dividend is reduced. Investors should treat discretionary repurchases as the flexible part of the capital-return plan.
Returns on Capital: Improving, but Still Modest
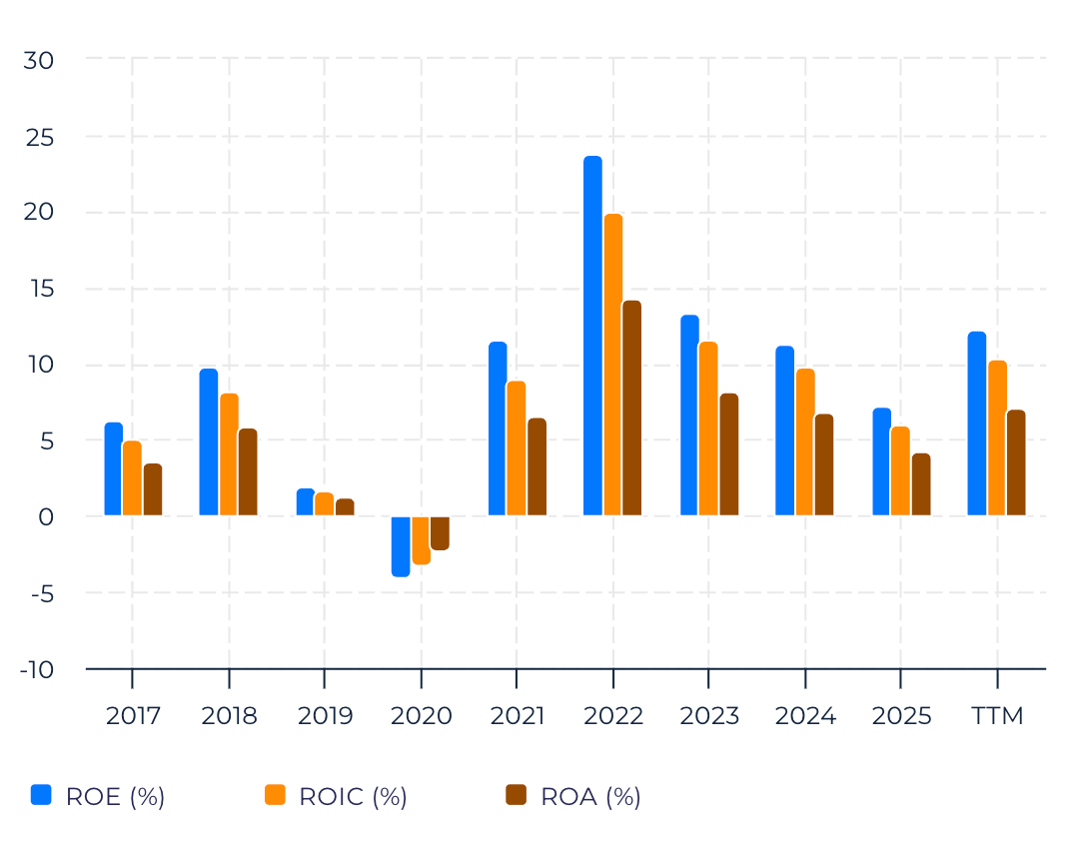
Trailing return on invested capital (ROIC) is 10.39%, below its five-year average of 11.26%. The latest quarter has not fully offset a weaker fiscal 2025.
Return on equity is 12.25%. Both figures look modest beside asset-light companies, but that is normal for a capital-intensive producer. The key question is whether new projects can lift returns across a full commodity cycle.
Shareholder Returns: Disciplined Capital Return
Chevron spent $11.3 billion on buybacks over the trailing period, down modestly from fiscal 2025.
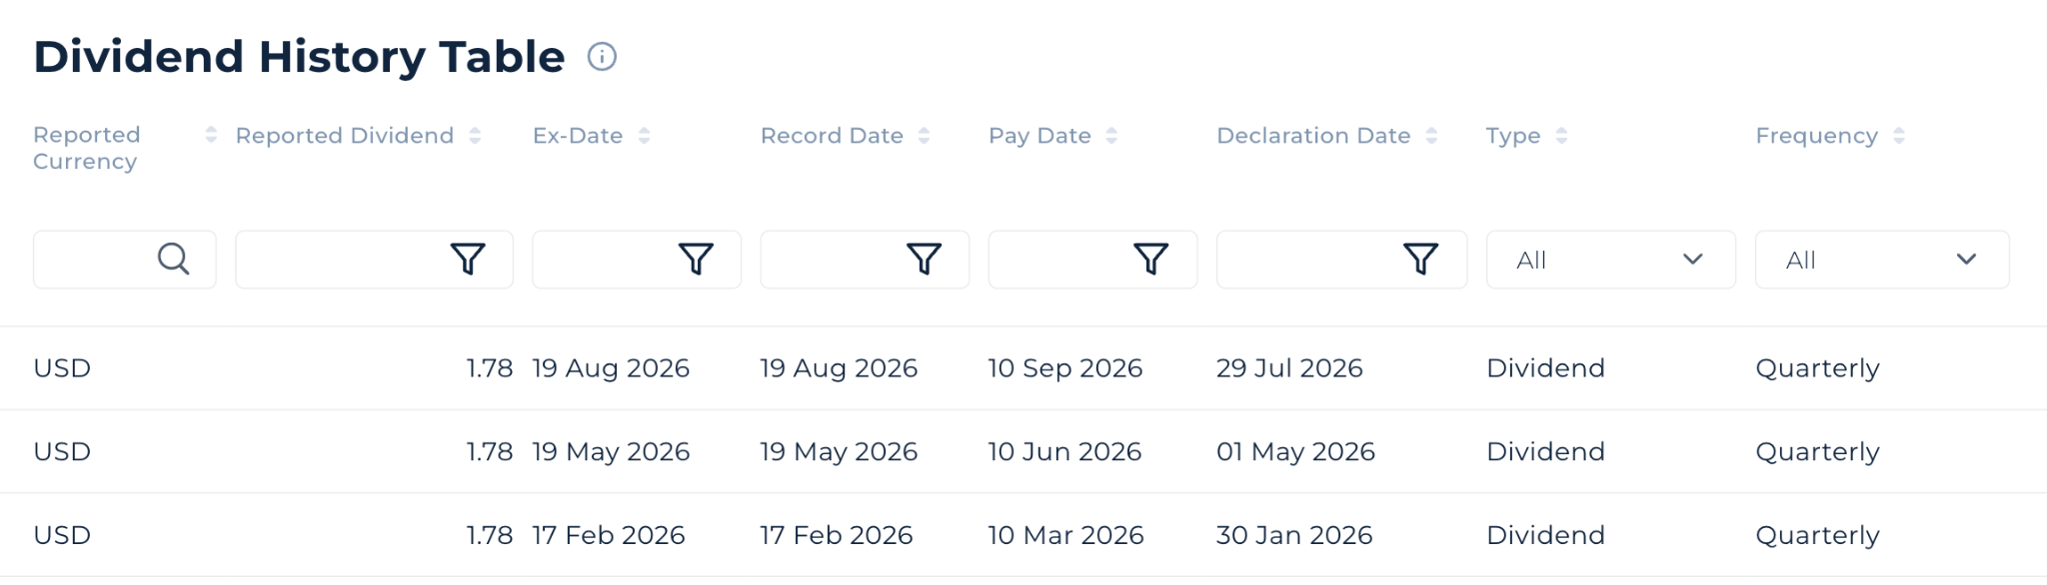
The company also pays a quarterly dividend of $1.78 per share, giving a current yield of 3.39% and extending a roughly four-decade record of annual increases.
The slower buyback pace is not necessarily negative. Reducing repurchases during a weaker margin period preserves balance-sheet flexibility while maintaining the dividend.
Growth Catalysts
Permian, Tengiz and Hess: The Structural Growth Story
- Permian production exceeded 1 million barrels of oil equivalent per day for the first time. Management is now shifting its emphasis from pure volume growth toward free cash flow.
- Tengiz expansion projects are online and moving the field toward full production. This should support cash flow beyond the latest oil-price spike.
- Hess integration reached $1.5 billion in annual run-rate synergies, 50% above the original target and ahead of schedule. Guyana adds a longer-duration source of high-margin production.
Chevron also expects company-wide production to grow 2% to 3% annually through 2030 while targeting $3 billion to $4 billion in structural cost reductions. Its Australian LNG assets provide another cash-flow source outside the main upstream oil cycle.
The Hess acquisition changes the quality as well as the scale of Chevron's portfolio. Guyana adds a long-duration asset, while early synergies suggest integration is progressing faster than originally expected. The remaining question is whether Chevron can preserve operating discipline after absorbing a transaction of this size.
These catalysts support a higher normalized cash-flow base. They do not remove oil-price risk, but they may allow Chevron to generate more cash at the same commodity price than it did before the Hess acquisition and recent project completions.
That is the structural thesis in practical terms. If production rises and unit costs fall, Chevron needs less help from commodity prices to support free cash flow. Investors should track cash generation per barrel and project returns, not only total production.
Economic Moat: Why Chevron Rates a Narrow Moat
StockOracle™ rates Chevron as a Narrow Moat business. Its advantage comes from scale, low-cost reserves and integrated assets that would be expensive for a new entrant to replicate. Refining and LNG operations also reduce some of the volatility faced by a pure upstream producer.
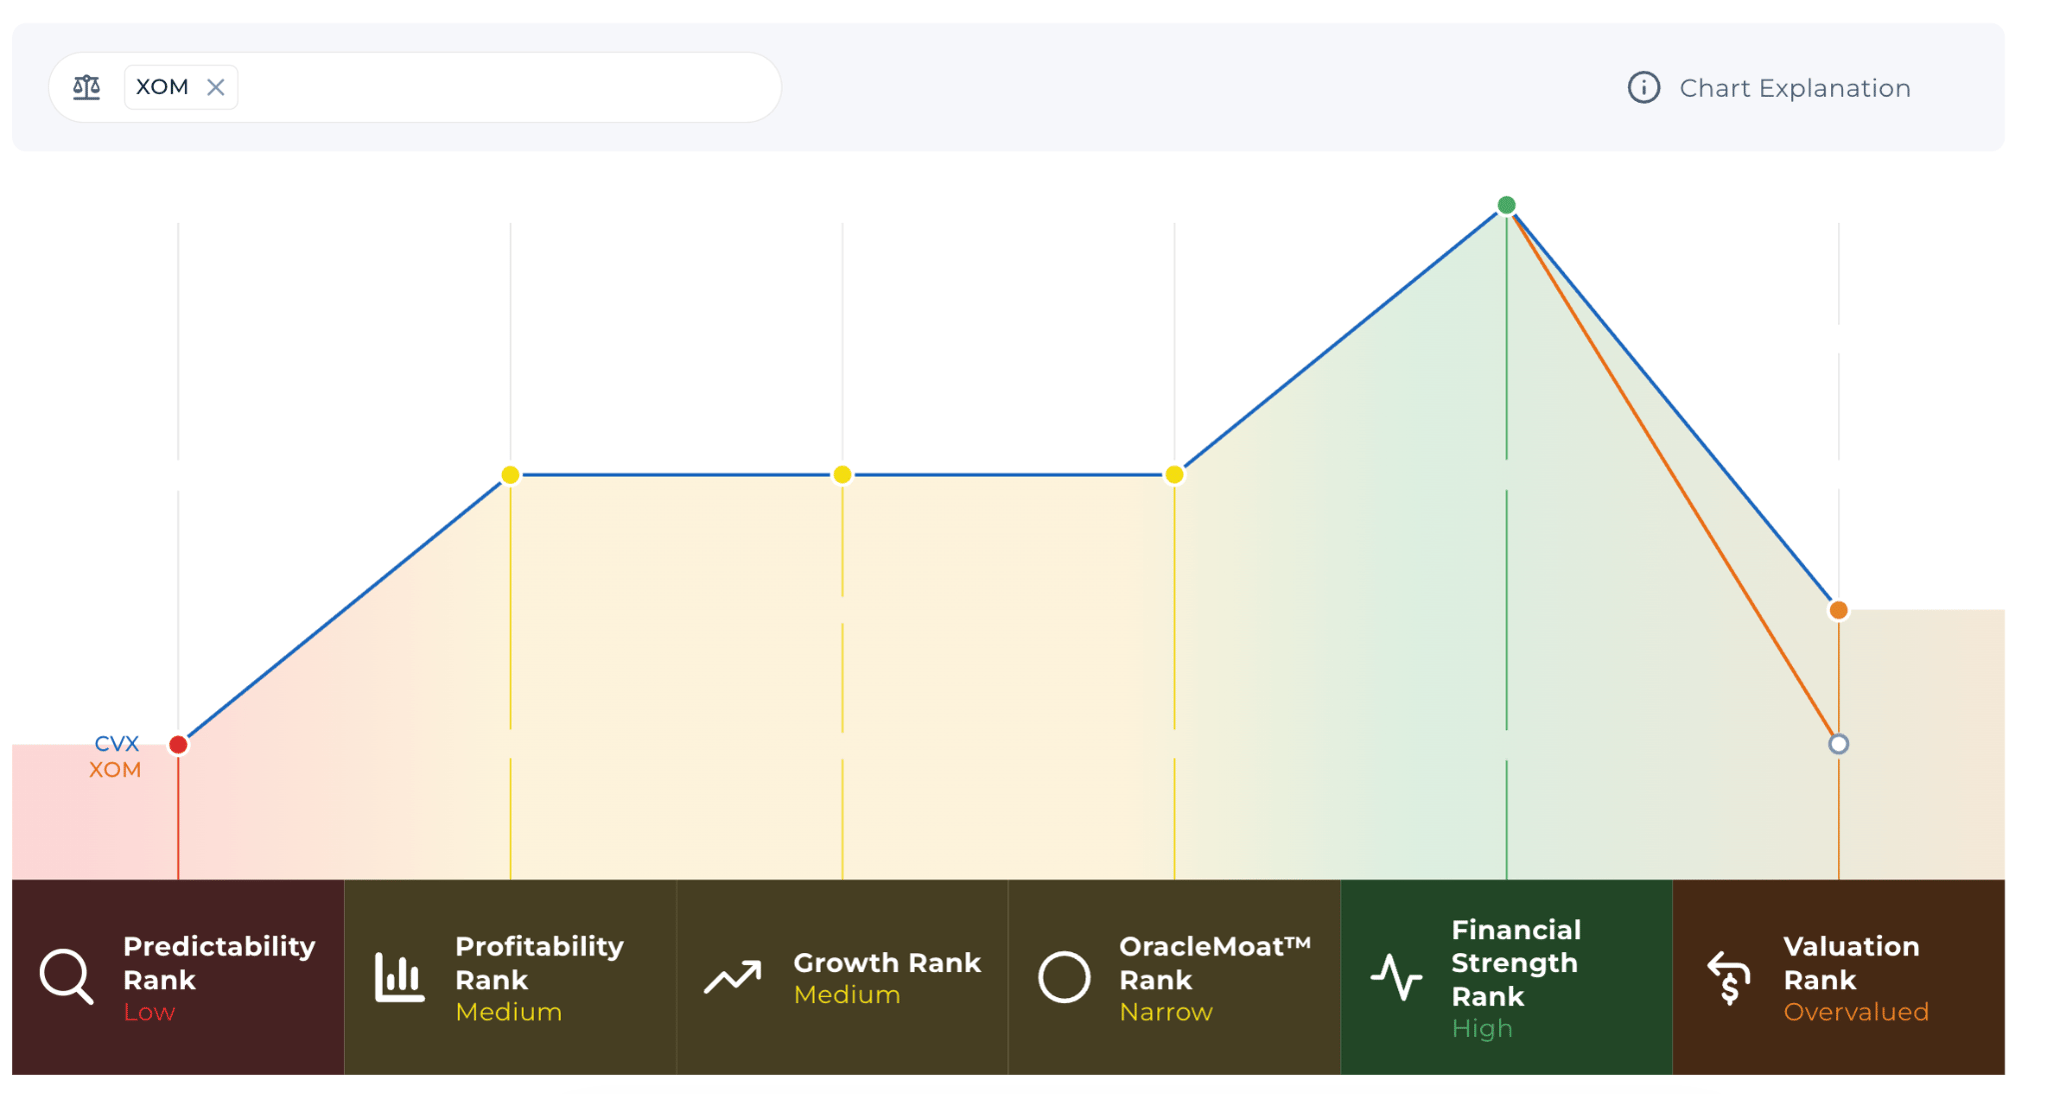
OracleIQ™ comparison of XOM and CVX - Powered by StockOracle™
The moat is real but limited. ExxonMobil competes at a similar scale with strong Permian and Guyana positions. Occidental Petroleum has more concentrated Permian exposure and can grow faster during strong pricing periods, although it is less diversified.
Renewables and grid-scale storage are the longer-term structural risk. They do not threaten a single Chevron asset immediately, but they could weaken demand growth over a 20-year valuation period. Chevron's moat protects current cash flows more effectively than it guarantees long-term growth.
Asset life also matters. Large energy projects require years of investment before they produce cash, so poor capital allocation can damage returns for a long time. Chevron's scale gives it access to complex projects, but the moat remains narrow because the product itself is largely undifferentiated. Buyers care about price and reliability, not which producer supplied the barrel.
Building Your Own DCF: What Would Have to Be True
The $574.31 estimate depends on a trailing cash-flow base boosted by unusually high Brent prices. Replacing the $45.3 billion starting figure with fiscal 2025's $33.9 billion would reduce fair value materially.
For something close to the base-case estimate to hold, at least one of two conditions must occur:
- Brent must remain meaningfully above the $70 level used in management's planning assumptions.
- Hess, Permian and Tengiz must expand cash flow enough to offset lower oil prices.
Investors should test both the cash-flow base and the oil-price assumption. For Chevron, changing the starting cash flow can matter more than fine-tuning the long-term growth rate.
Run your own growth assumptions and cash-flow base through StockOracle's DCF calculator.
Final Thoughts on Chevron's Intrinsic Value
- The recent profit surge benefited from Brent reaching $104, so the trailing cash-flow base should not be treated as permanent.
- Hess synergies, Permian production and Tengiz expansion represent genuine operating improvements that can survive lower oil prices.
- The 12.89% free cash flow margin is stronger than in fiscal 2025, but still reflects a favorable commodity environment.
- The $574.31 fair-value estimate is a high-end base case. A normalized cash-flow input produces a more conservative result.
Chevron's valuation is not a simple question of whether the company is performing well. The business has improved, but current cash generation also includes a temporary oil-price benefit. Investors need to separate those two effects.
If Brent stays elevated, the model becomes easier to defend. If oil prices normalize, the stronger production base should still support value above a purely cyclical reading, but likely below $574.31. The most useful valuation is therefore a range built from several commodity and cash-flow scenarios.
This analysis is for educational purposes only and is not financial advice or a recommendation to buy, sell or hold any security. The DCF is based on adjustable assumptions, not a fixed or guaranteed valuation. Past performance is not indicative of future results. Piranha Profits and StockOracle™ are financial education providers, not licensed financial advisors. All figures, especially third-party oil-price, synergy and production data, should be independently verified before publication.