Coca-Cola raised its full-year profit guidance for the second straight quarter and delivered 6% organic revenue growth, on top of a stock trading near 27 times earnings, a multiple usually reserved for growth names.

Hardly investors debate whether Coca-Cola is a good business anymore. The debate has moved entirely to whether the price already assumes more good news than the underlying numbers can keep delivering.
What Does Coca-Cola Actually Do?
Coca-Cola as we all know, manufactures and markets beverages across five operating groups: Europe, Middle East and Africa; Latin America; North America; Asia Pacific; and Global Ventures, alongside a Bottling Investments segment.
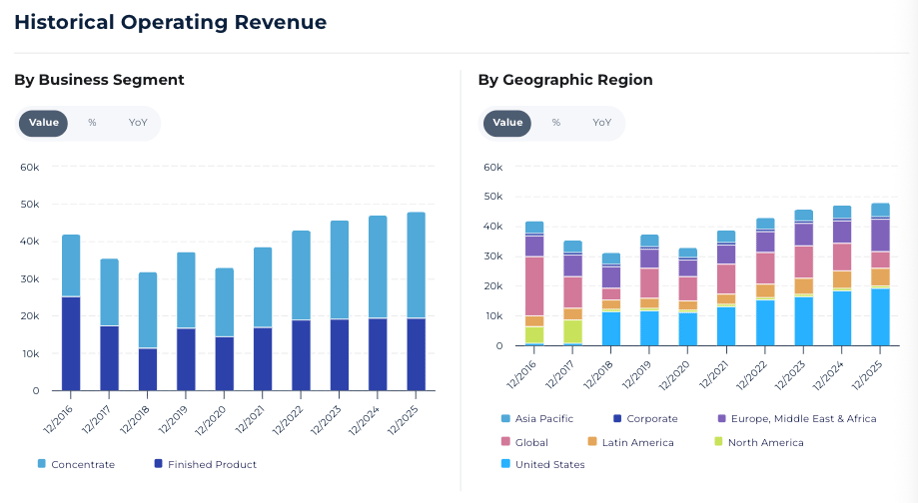
The business model is built around selling concentrate to bottling partners rather than owning most of the physical bottling and distribution infrastructure itself, which is a large part of why its margins and returns on capital tend to not look like a typical consumer packaged goods company.
What Is Coca-Cola's Intrinsic Value?
Intrinsic value is what a business is actually worth based on the cash it can realistically generate over time, not what the market is willing to pay for it on any given day. When the market price sits above that estimate, the premium has to be justified by growth that hasn't shown up in the numbers yet. When it sits below, investors call the gap a margin of safety.
Coca-Cola's Fair Value: The Debate Has Moved to the Price Tag
Run Coca-Cola's numbers through a 20-year discounted cash flow model and fair value lands at $76.59 per share. The discounted free cash flow variant comes in lower still, at $66.22, essentially matched by the discounted net income method at $66.31.

Coca-Cola (KO) Valuation Chart — Model Breakdown — Powered by StockOracle™ · Accurate as of 21 August 2026
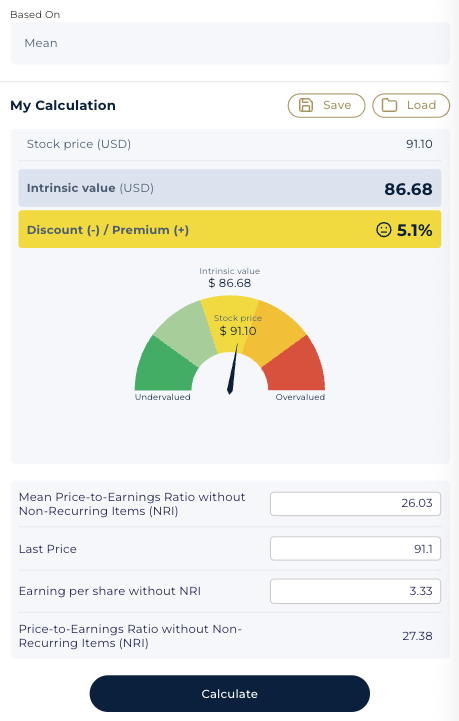
Multiple-based methods like Mean Price-to-Earnings puts fair value at $86.68 and Mean Price-to-Book at $89.54, both landing close to today's price.
That split between multiple based and cash flow based is telling investors something. It's the tension that shows up whenever a business converts an unusually thin share of its revenue into free cash relative to its reported earnings and book value: the market seems to be pricing Coca-Cola off its earnings power and brand-driven balance sheet, not off a pure cash-flow yield.
Coca-Cola (KO) Financial Performance
Revenue: Real Growth, Not Just A Price Spike
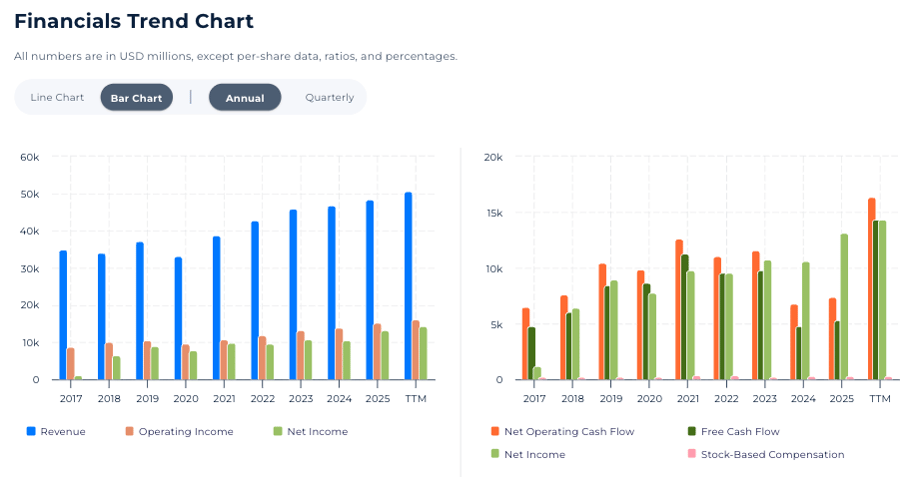
Coca-Cola (KO) Revenue, Operating Income and Net Income Trend — Powered by StockOracle™
Second-quarter 2026 net revenues reached $13.4 billion, up 7% year-over-year, with organic revenue growth of 6% built from real volume gains rather than price increases alone. That's a healthier mix than a price-driven beat: comparable operating margin expanded to 35.6% from 34.7% a year earlier, and comparable EPS grew 11% to $0.97. Management raised full-year guidance to organic revenue growth of approximately 5% and comparable EPS growth of 9 to 10%, up from a prior 8 to 9% range. Coca-Cola's Q2 2026 earnings release has the full regional and segment breakdown. CEO Henrique Braun credited the results to "staying close to the changing needs of our consumers."
The regional mix is worth a look: North America grew volume 3% and price/mix 4%, translating into 12% comparable operating income growth, while Asia Pacific delivered 8% volume growth offset by a 9% price/mix decline, netting out to roughly flat operating income. EMEA was the outlier, with operating income down 5% despite positive volume and price/mix, a reminder that growth in the top line doesn't always translate cleanly to the bottom line across every geography.

Free Cash Flow: The Line That Explains the Valuation Split
Coca-Cola free cash flow margin sits at 28.52% on a trailing basis, meaning roughly 28 cents of every revenue dollar converts to real cash. Year-to-date free cash flow reached $6.9 billion on the way to a full-year guidance of approximately $12.4 billion.
That healthy conversion is exactly why the DCF-based figures tend to sit meaningfully below the multiples-based ones: a 20-year model compounding forward from an already-strong cash base will find it hard to stretch and match a valuation built on brand-driven earnings and book-value multiples.
Returns on Capital: Best-in-Class, and Part of Why the Premium Exists
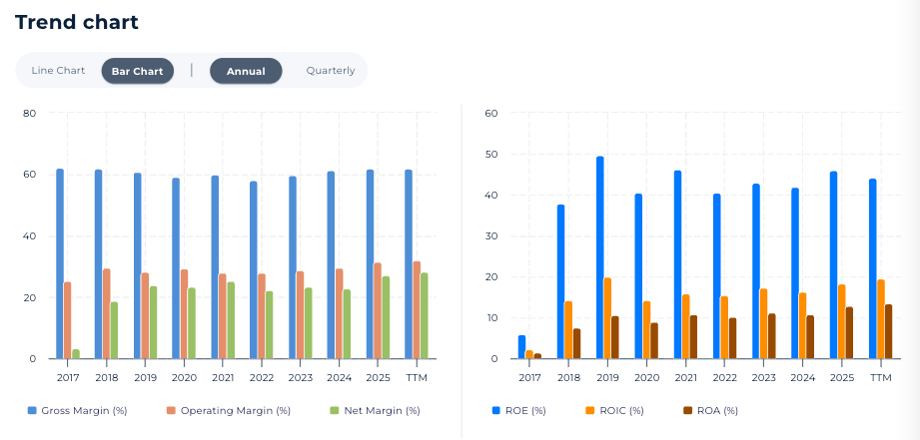
Coca-Cola (KO) Margins and Returns Trend — Powered by StockOracle™
Return on equity (TTM) reads an exceptional 44.23%, and return on invested capital 19.52%, both figures that few large-cap consumer businesses can match. That capital efficiency is real evidence behind the premium earnings multiple, not just sentiment: a business converting capital into profit this efficiently arguably deserves to trade above a pure cash-flow-derived fair value.

With ROIC running higher against WACC, Coca-Cola is generating returns well above its cost of capital. A wide spread that points to genuine value creation.
Add a beta of 0.34, and the picture becomes one of a business compounding capital efficiently while carrying far less perceived volatility than the broader market. A profile that tends to stand out when equities get choppy.
Shareholder Returns: Dividends Over Buybacks
Coca-Cola's dividend yield sits at around 2.28%, backed by a payout ratio of roughly 62.67%, extending one of the longest dividend growth streaks in the market.
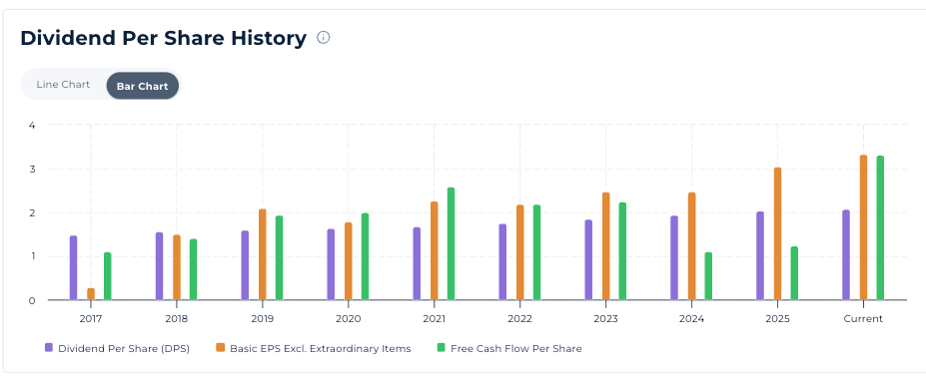 Buyback activity has been comparatively minimal, a sign that management prioritizes the dividend commitment and reinvestment over aggressive share reduction.
Try out StockOracle™'s Dividend Calculator
Growth Catalysts
What Has to Keep Working for the Premium to Hold
- North America's pricing power delivered 12% comparable operating income growth on modest volume gains, evidence the brand can still take price without losing share in its most mature market.
- Bottling Investments operating income surged 75% in the quarter, an outsized contributor worth watching for whether it's repeatable or a one-time re-franchising or currency effect.
- Coca-Cola's long-stated long-term targets roughly 5–6% organic revenue growth and 8–10% EPS growth, a framework management has reaffirmed even while raising near-term guidance twice this year.
- Asia Pacific's volume strength (up 8%) shows the growth runway is still there, even though price/mix pressure in the region ate into the operating income conversion this quarter.
Why it matters for valuation: the multiples-based fair-value figures are only defensible if this growth keeps compounding for years, not quarters. A single soft quarter in North America pricing or Asia Pacific volume would remove the strongest evidence behind paying today's premium.
Economic Moat: Why StockOracle™ Rates Coca-Cola a Wide Moat
StockOracle™ rates Coca-Cola a Wide Moat business, built on advantages that are genuinely hard to replicate: one of the most recognized brands on earth, a bottling partner network built over more than a century, and shelf and fountain placement relationships that a new entrant simply cannot buy quickly at scale.
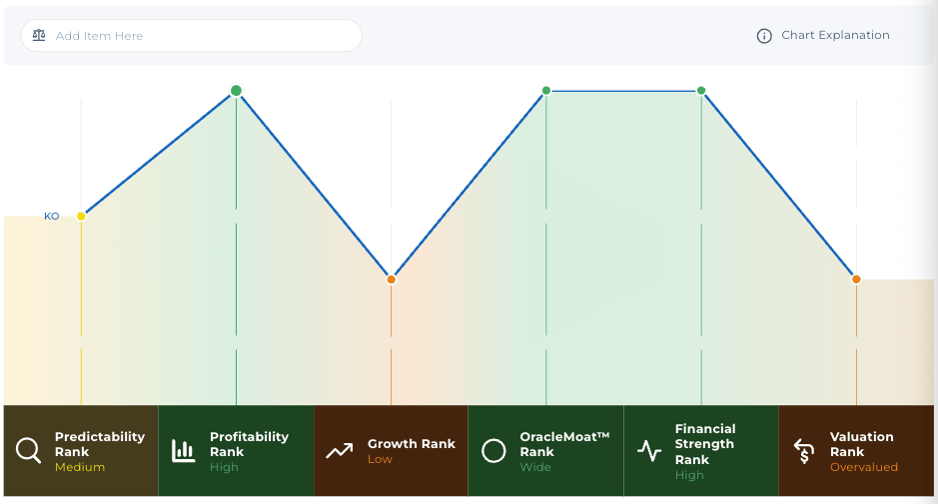
The competitive set carries different, specific advantages, and Coca-Cola has to defend against each rather than simply out-market it. PepsiCo brings a diversified snack-and-beverage portfolio that cross-subsidizes its beverage marketing in ways a pure-play beverage company can't match. Keurig Dr Pepper competes with a stronger position in at-home coffee and flavored soda in specific North American categories.
Other Private-label and emerging functional beverage brands chip away at the margins of the category by targeting health-conscious consumers with lower-sugar or functional positioning that legacy cola brands are still adapting to. None of these rivals fully replicate Coca-Cola's combined scale in bottling infrastructure, brand recognition, and global distribution, which is the core of why the wide-moat rating holds even as the beverage category itself evolves.
Building Your Own Price Targets
Input your own assumptions of future earnings per share (EPS) and price of KO here. Readers can run their own assumptions through StockOracle's Mean PE Ratio calculator.
Final Thoughts on Coca-Cola's Intrinsic Value
- Organic revenue growth of 6% and comparable EPS growth of 11% in the second quarter were driven by genuine volume growth and margin expansion, not just price increases.
- Free cash flow margin of 28.52% is genuinely strong in absolute terms, it simply isn't strong enough on its own to support a valuation built on 20 years of compounding.
- Management raised full-year guidance for the second consecutive quarter, reaffirming its long-standing 5–6% organic growth, 8–10% EPS growth algorithm.
- North America drove outsized profit growth on modest volume gains, while EMEA's operating income fell despite positive volume and pricing, evidence the growth story isn't uniform across every region.
- The wide-moat rating rests on scale in brand, bottling infrastructure, and distribution that no single competitor currently replicates in full.
Almost nobody argues Coca-Cola is a bad business. The open question is whether a company converting less than 30 cents of every revenue dollar into free cash deserves to trade at a multiple more commonly associated with far higher-growth names, and that answer depends entirely on whether the current growth algorithm keeps compounding the way the last two quarters suggest, or whether one region's soft patch turns into a broader one.
This analysis is shared for educational purposes only and is not intended as financial advice or a recommendation to buy, sell, or hold any security. The valuation figures above are model outputs built on stated, adjustable assumptions, not a fixed or guaranteed price target, and should not be treated as a standalone signal. Past performance, including any figures referenced above, is historical and is not indicative of future results.