In September 2026, McDonald's joined one of the most exclusive clubs on Wall Street as it had 50 consecutive years of dividend increases.
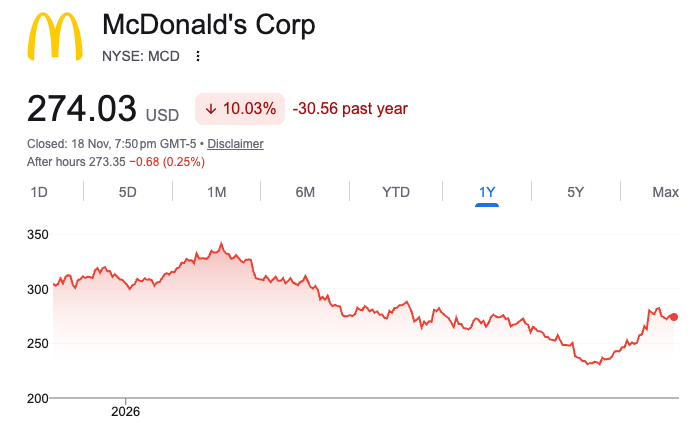
Within a week, its stock sank to a fresh 52-week low, and by late October it was down about 20% for the year while the broader market climbed.
Then, on November 4, third-quarter earnings beat expectations, and the shares jumped 6.5% in a single day.
For many dividend investors, McDonald’s has been the stock that rarely went on sale.
The real question is whether the market is offering a rare bargain, or quietly repricing a slower McDonald’s.
Working out the MCD intrinsic value is how investors start to tell the difference.
What Does McDonald's Do?
While many of us probably don't need any introduction to what McDonald's does. As investors, it's important to dive deeper into its business model. McDonald's runs the world's largest fast-food restaurant system, with more than 46,000 locations in over 100 countries serving more than 70 million customers a day.
About 95% of those restaurants are owned and run by independent franchisees.
McDonald's itself earns most of its money as a landlord and brand owner, collecting rent and royalties on a percentage of each restaurant's sales.
How McDonald's Makes Its Money: Three Revenue Segments
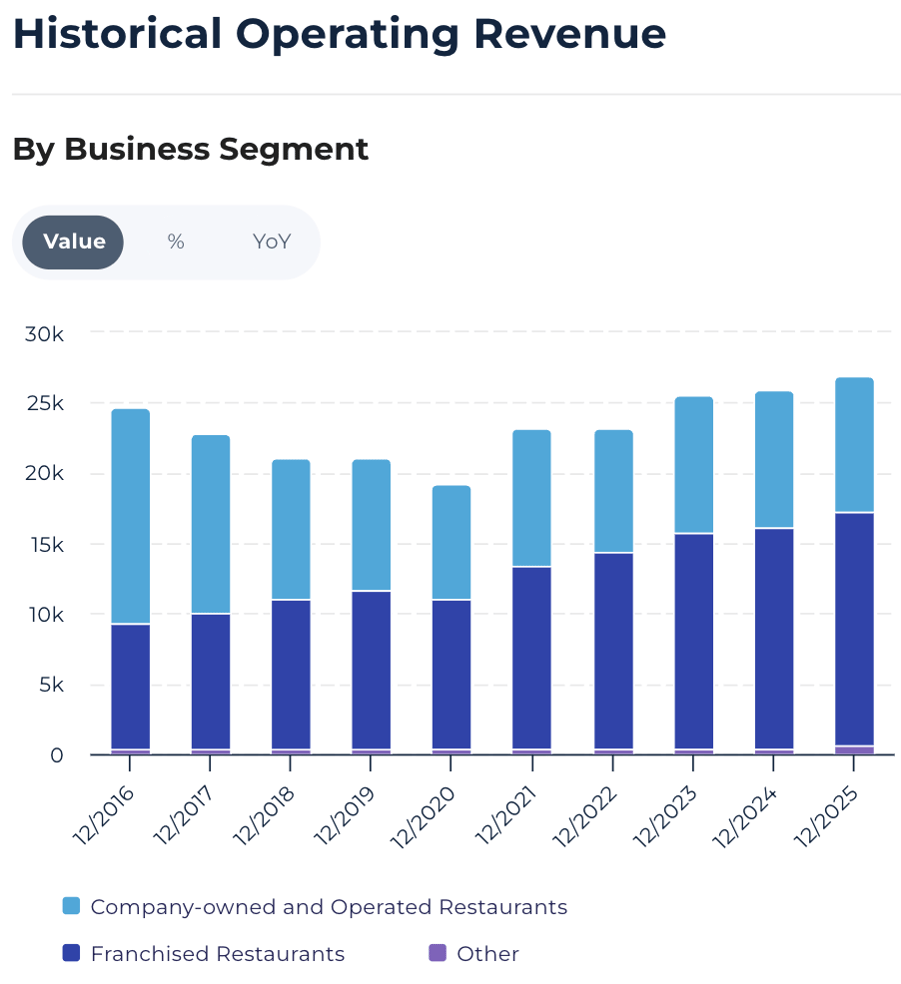
McDonald's reports revenue in three buckets. In 2025, they added up to $26.9 billion:
- Franchised restaurants: $16.5 billion (about 62%)
Rent and royalties based on a percentage of each franchisee's sales, plus initial fees when a new franchise opens. This is the high-margin core of the business.
- Company-owned and operated restaurants: $9.7 billion (about 36%)
The full sales from the roughly 5% of restaurants McDonald's runs itself. The revenue per restaurant is much bigger, but McDonald's also pays for the food, wages, and running costs.
The mix keeps shrinking, though management is targeting 98% franchised by 2028.
- Other: $647 million (about 2%)
This mainly consists of fees franchisees pay to recover part of McDonald's costs for technology and digital platforms, plus brand licensing deals that put the McDonald's name on consumer packaged goods, such as branded products sold in grocery stores.
It is a small, but fast-growing portion: up 53% in 2025 and 26% in Q3 2026, to $189 million.
What Is MCD Intrinsic Value?
Intrinsic value is an estimate of what a business is truly worth, based on the cash it can produce for shareholders over its lifetime.
With McDonald's, the intrinsic value is a range; run MCD through nine different valuation models and the results spread from $13.25 to $324.70 per share.
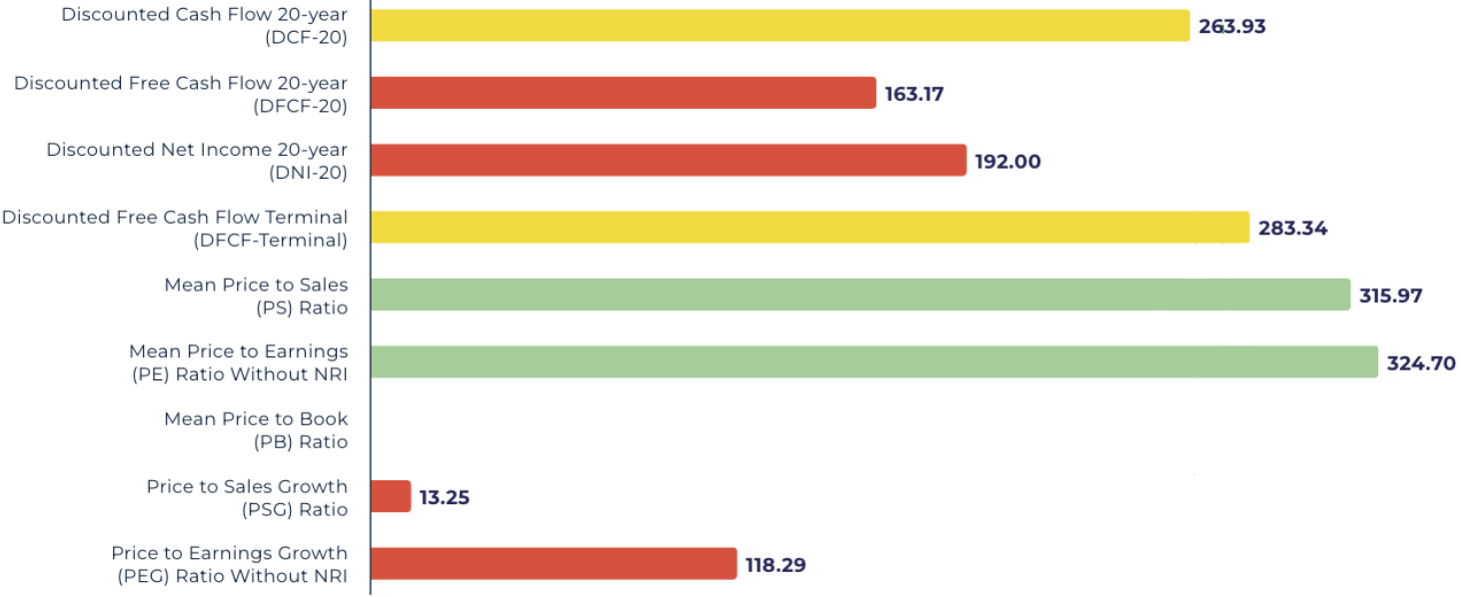
MCD Intrinsic Value Across Valuation Models - Powered by StockOracle™
Models anchored on history, such as average PE and average PS, land highest, because McDonald's has spent most of the past decade priced as a premium, defensive compounder.
Models anchored on growth, like PEG and PSG, land lowest, because McDonald's is a mature business expected to grow its earnings in the mid-single digits.
For a slow, steady cash machine like McDonald's, cash flow models with a long runway usually tell investors more than growth-ratio models.
Why Is the PSG Estimate So Much Lower Than the Rest?
The Price-to-Sales Growth model rewards companies whose revenue is growing fast. McDonald's reported revenue grew just 1.7% in 2024 and 3.7% in 2025, to $26.9 billion.
In Q3 2026, revenue rose just 1% to $7.16 billion. Feed a low single-digit growth rate into a growth-scaled formula, and the output collapses to $13.25.
Additionally, because 95% of restaurants are franchised, McDonald's only books the rent and royalties it collects, not the full sales at the counter.
Systemwide sales are more than four times larger than reported revenue, with $38 billion in Q3 2026 alone.
The PSG figure is best read as a reminder that MCD is not a growth stock, and this is why most investors don’t use PSG to value MCD.
MCD PE Ratio: What History Tells Us About Today's Valuation
At $280.22, McDonald's trades near 22 times trailing earnings.
That uses about $12.64 of trailing-twelve-month diluted EPS: FY2025 EPS of $11.95, plus nine-month 2026 EPS of $9.61, minus $8.92 for the same nine months of 2025. At the late-October price of $264.52, the forward multiple sat around 19x.
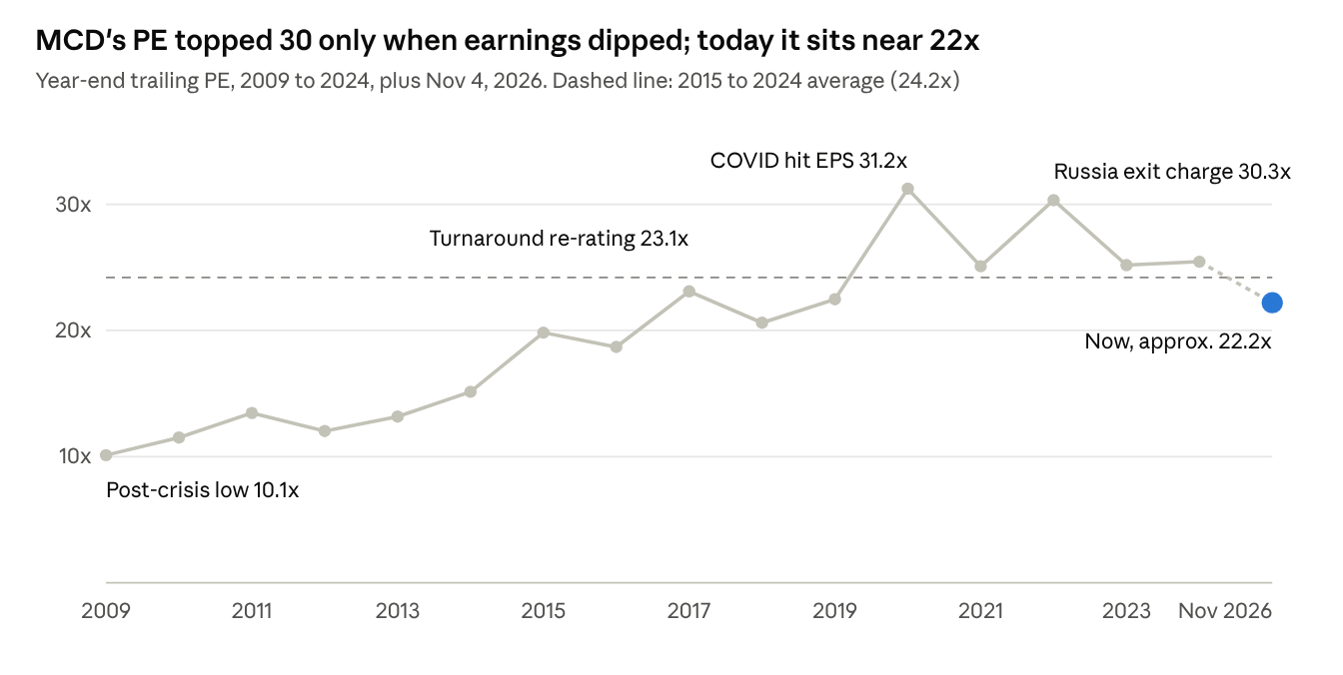
The MCD PE ratio has moved through four distinct eras, and each one has a clear cause 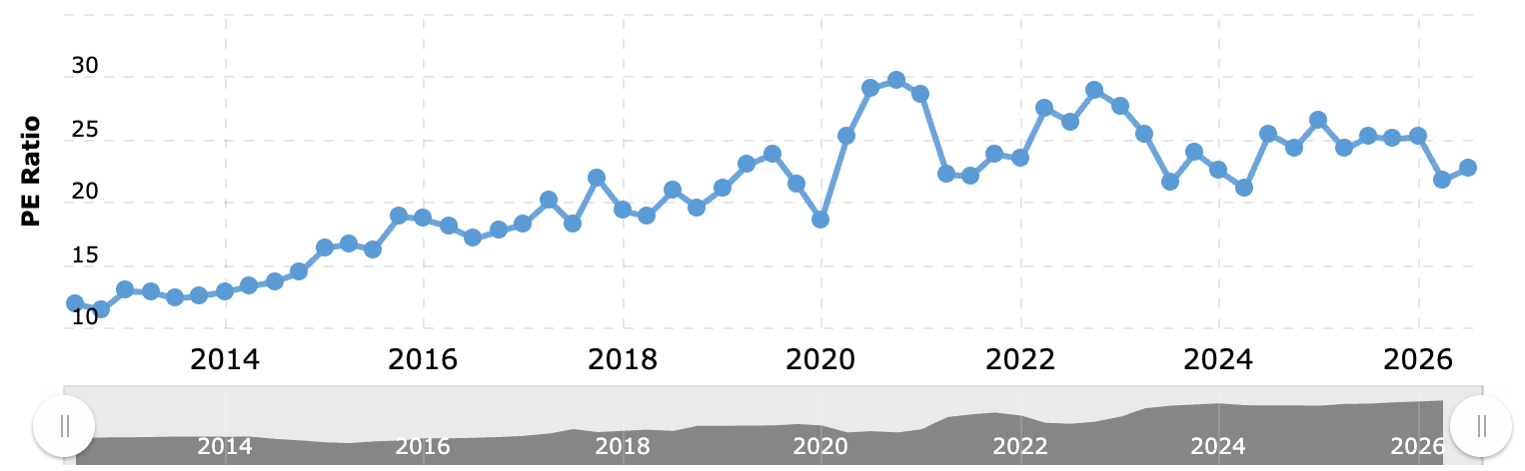
- 2009 to 2013:
The cheap years: 10x to 13x. After the financial crisis, the whole market traded at low multiples. McDonald's kept growing earnings, but investors were unwilling to pay for it.
- 2015 to 2017:
The turnaround re-rating was about 19x to 23x.
A more royalty-like business earned a more premium multiple.
- 2020 and 2022:
The false peaks above 30x.
These spikes came from falling earnings, not soaring optimism.
COVID pushed 2020 EPS down to $6.31, and in 2022 the exit from Russia cost $1.44 per share in charges. The price held steady while the "E" shrank.
- 2026:
The de-rating is about 17x to 22x.
As U.S. traffic slowed, the stock slid to its 52-week low of $229.20, pulling the trailing PE down to about 18.6x. That sits below every year-end reading from 2017 to 2024. After the Q3 2026 earnings beat, it recovered to about 22x.
A high PE can mean the market is excited, or it can mean earnings are bad. Always check which half of the ratio moved.

Today's MCD PE ratio sits below its 2015 to 2024 average of about 26x. That gap is the market pricing in slower growth. Whether it proves to be an opportunity or a fair reset depends on whether U.S. guest counts recover.
Pull up MCD’s full PE history on StockOracle™ and check which half of the ratio moved in each era.
MCD Dividend Yield: 50 Years of Raises, and a Yield That Rises When the Stock Falls
|
MCD dividend snapshot |
Figure |
|
Annualized dividend |
$7.72 per share |
|
Forward MCD dividend yield at $280.22 on Nov 4, 2026 |
about 2.8% |
|
Forward yield near the September 2026 low around $234 |
about 3.3% |
|
5-year trailing yield range |
2.07% to 3.21% |
|
Dividend per share, 2015 vs 2025 |
$3.44 vs $7.17 |
|
Payout ratio $7.72 dividend / ~$12.64 trailing EPS |
about 61% |
|
2025 dividends paid vs free cash flow |
$5.1B of $7.2B, about 71% |
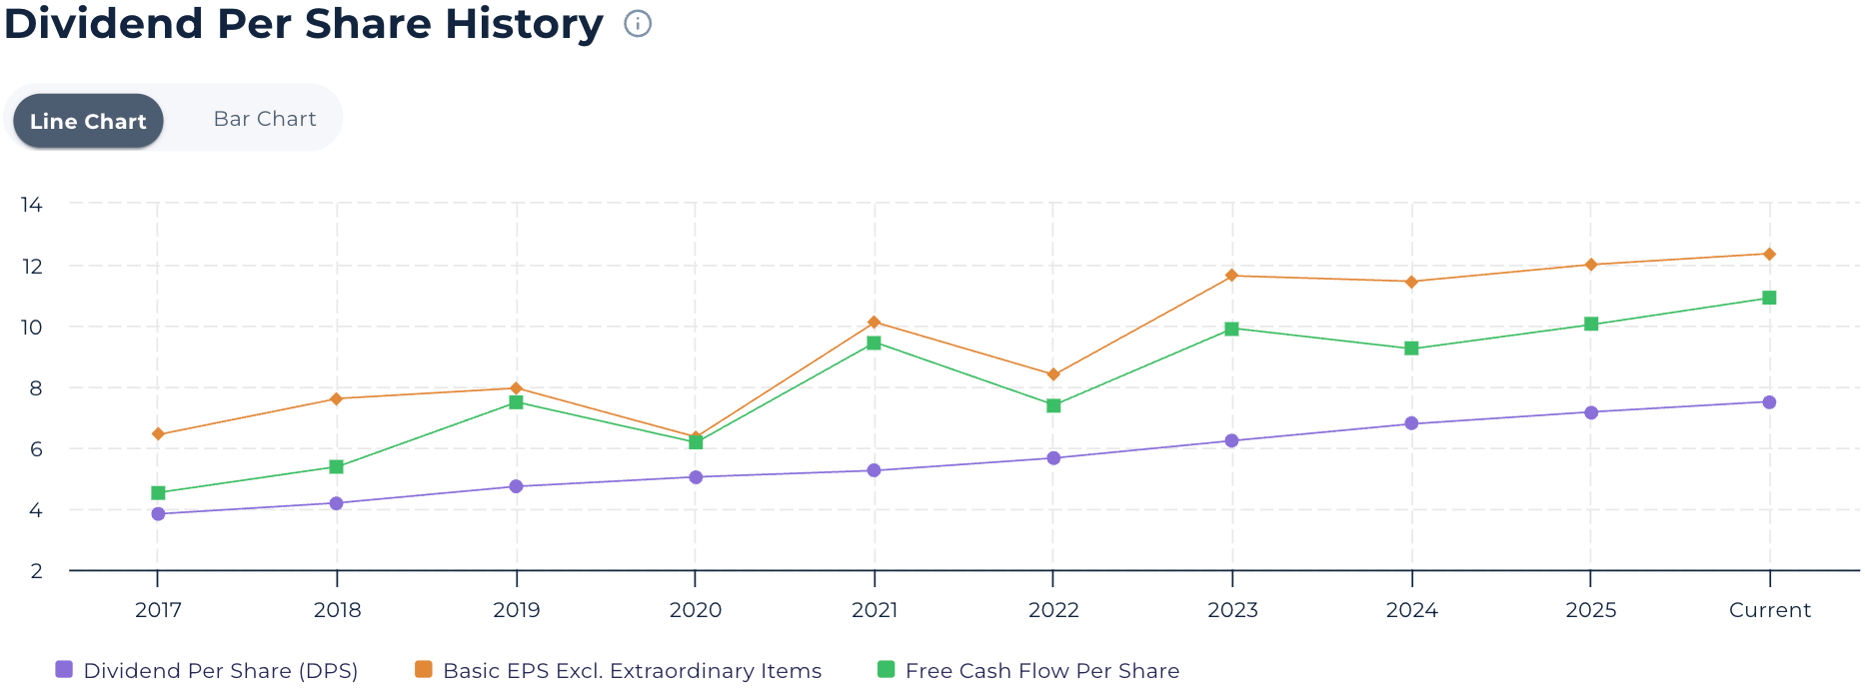
MCD Dividend Per Share Powered by StockOracle™
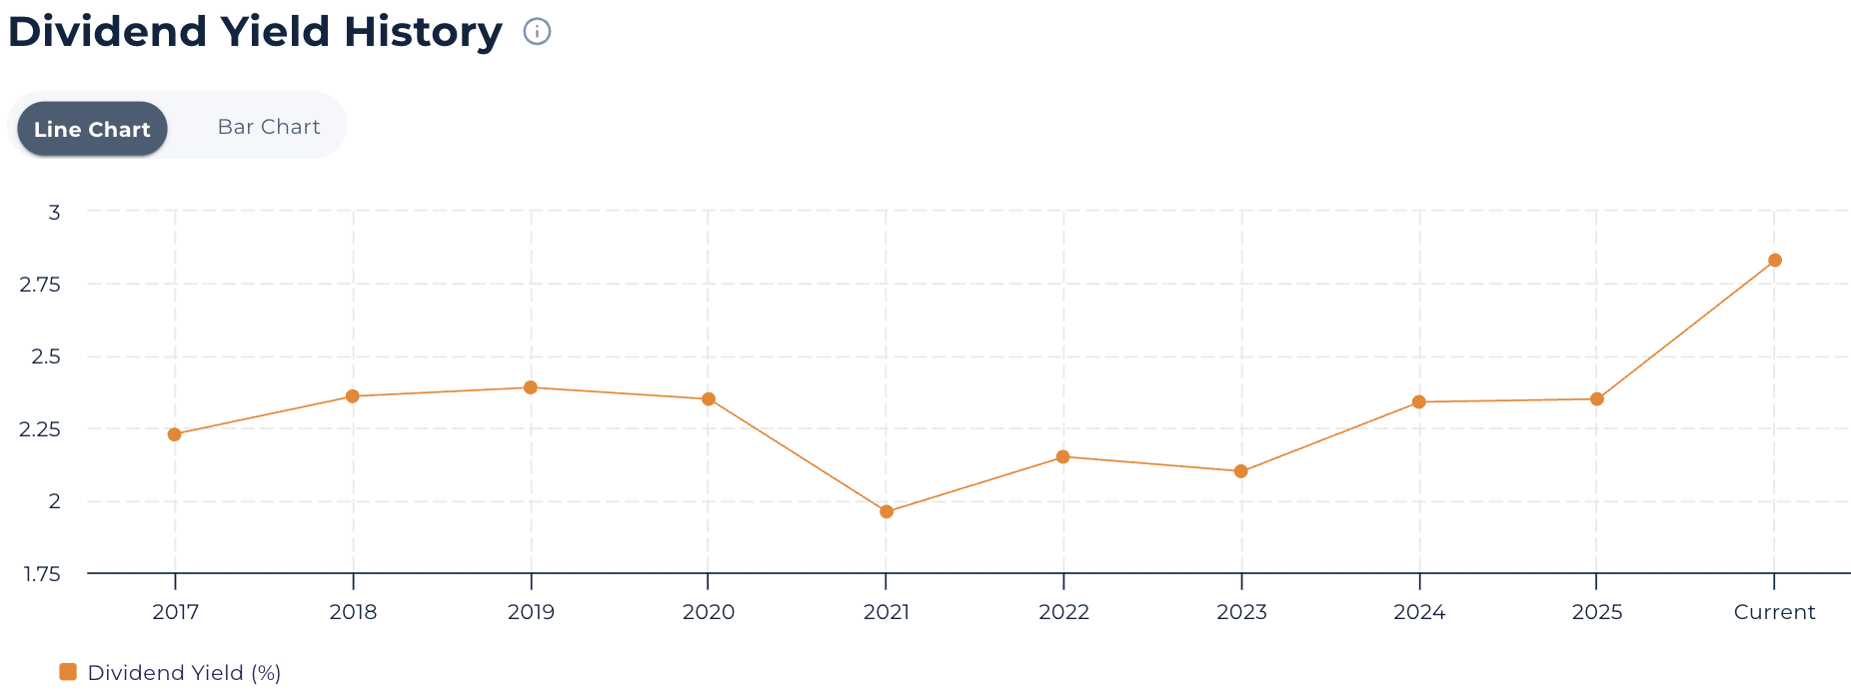
MCD Dividend Yield History Powered by StockOracle™
The MCD dividend yield is near the top of its five-year range because the share price fell, not because the payout jumped.
Yield is simply the annual dividend divided by the price, so when the stock dropped roughly 20% in 2026, the yield rose automatically.
Think of it like a rental property. If the rent stays the same but the property price falls, your rental yield goes up.
That can signal value, or it can signal that buyers expect the rent to grow more slowly.
That second reading deserves attention. This year's 4% raise is smaller than recent hikes, and with roughly 70% of free cash flow already going to dividends, the room for faster increases depends on earnings growth returning.
MCD Free Cash Flow: The Number That Drives Intrinsic Value
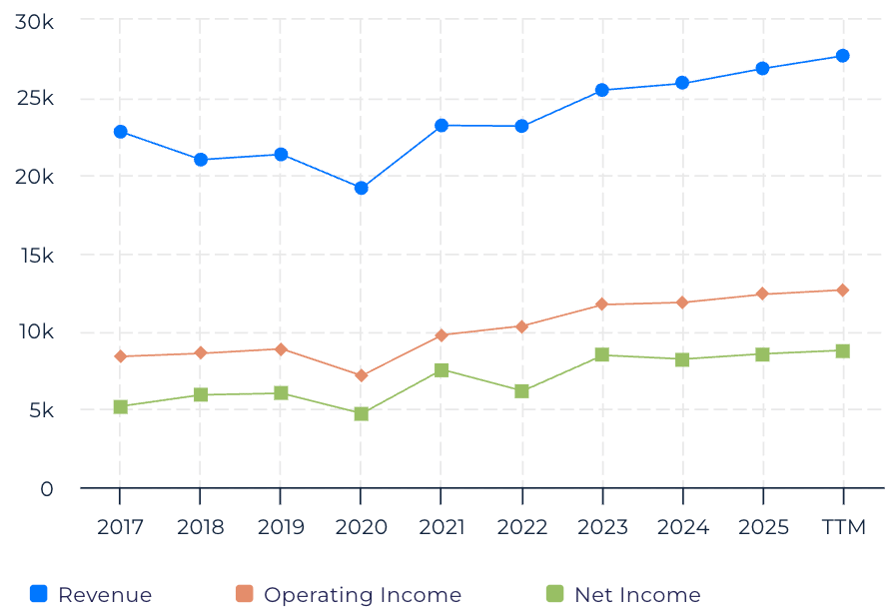
MCD Revenue Trend Powered by StockOracle™
McDonald's grew revenue to $26.9 billion in 2025, with $16.5 billion, about 62%, coming from franchised restaurants.
Franchise income is mostly rent and a percentage of sales, so it carries far higher margins than flipping burgers directly.
This is why reported revenue grows slowly while profits stay remarkably stable. McDonald's collects a slice of every franchisee's sales without paying their wages or food bills.
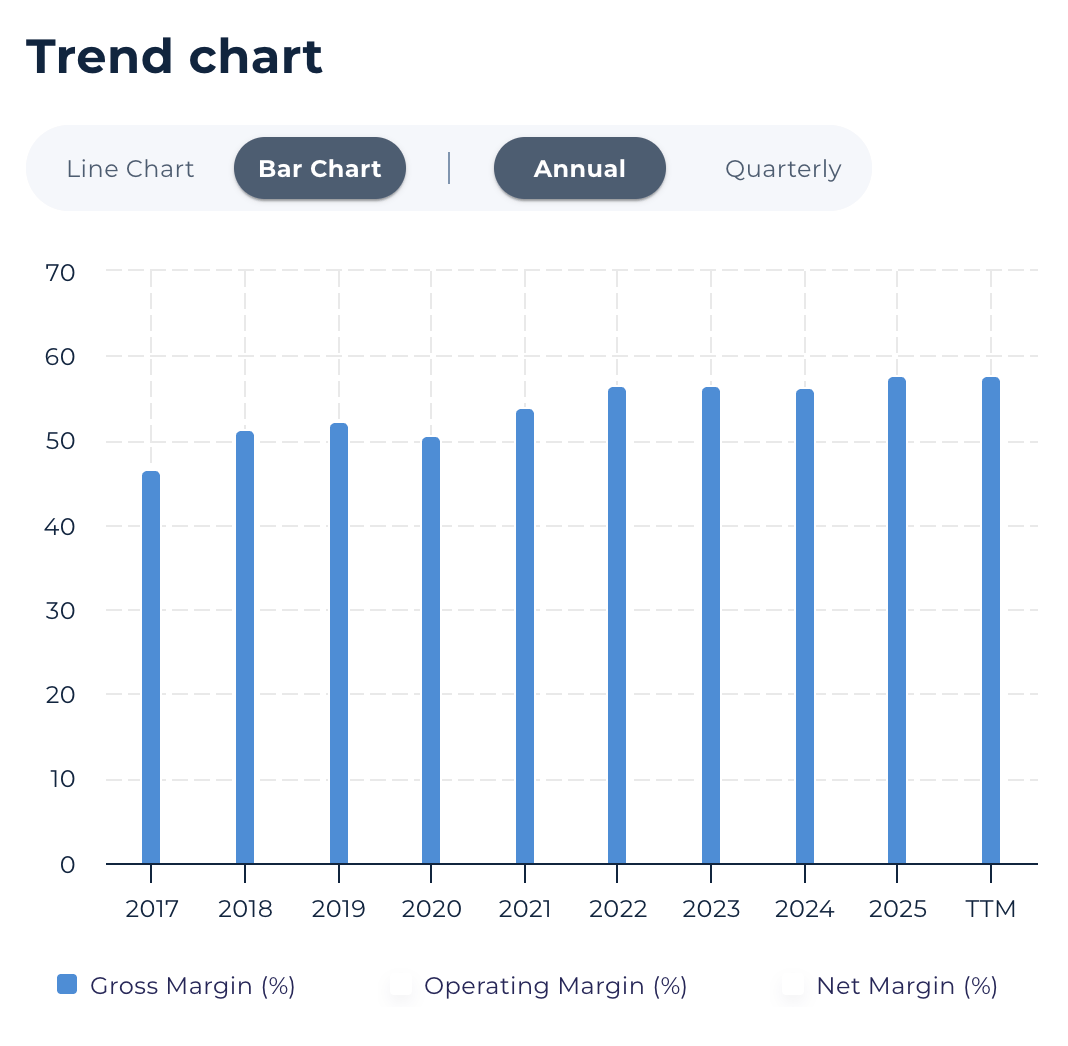
MCD Margin Trend Powered by StockOracle™
Free Cash Flow: What McDonald's Actually Keeps
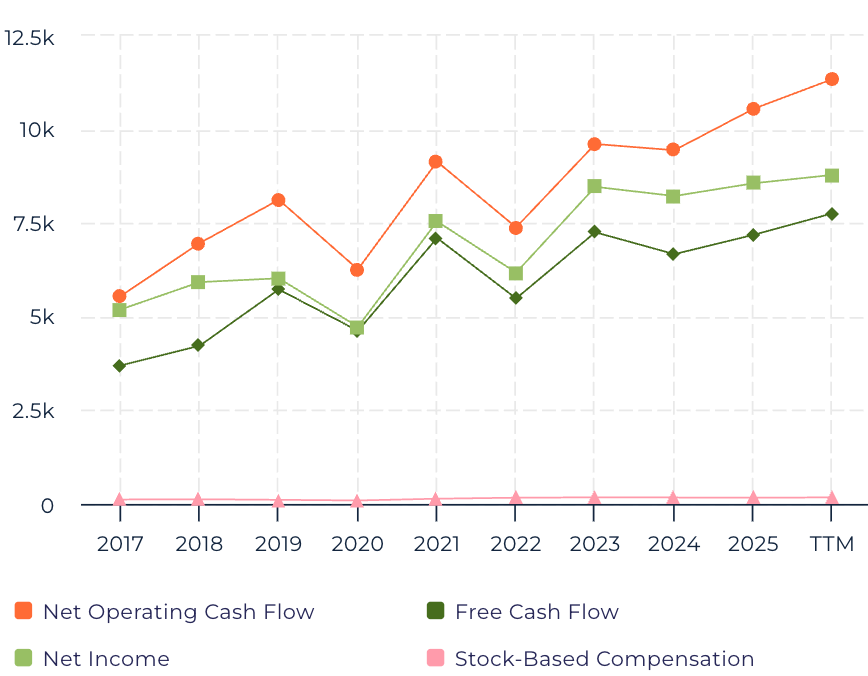
Operating Cash Flow and Free Cash Flow Chart Powered by StockOracle™
Topline growth is the headline. Free cash flow is the receipt.
In 2025, McDonald's generated $10.6 billion in operating cash flow, spent $3.4 billion on capital expenditures, and kept $7.2 billion in free cash flow. That works out to roughly 27 cents of real cash for every dollar of revenue, and an 84% conversion of net income into free cash flow.
That cash funded $5.1 billion in dividends and $2.0 billion in buybacks in 2025. Fewer shares means each remaining share owns a slightly larger piece of every future royalty check.
What Changed From Here
At its September 2026 Investor Day, McDonald's laid out its "NEXT" plan with 2030 targets:
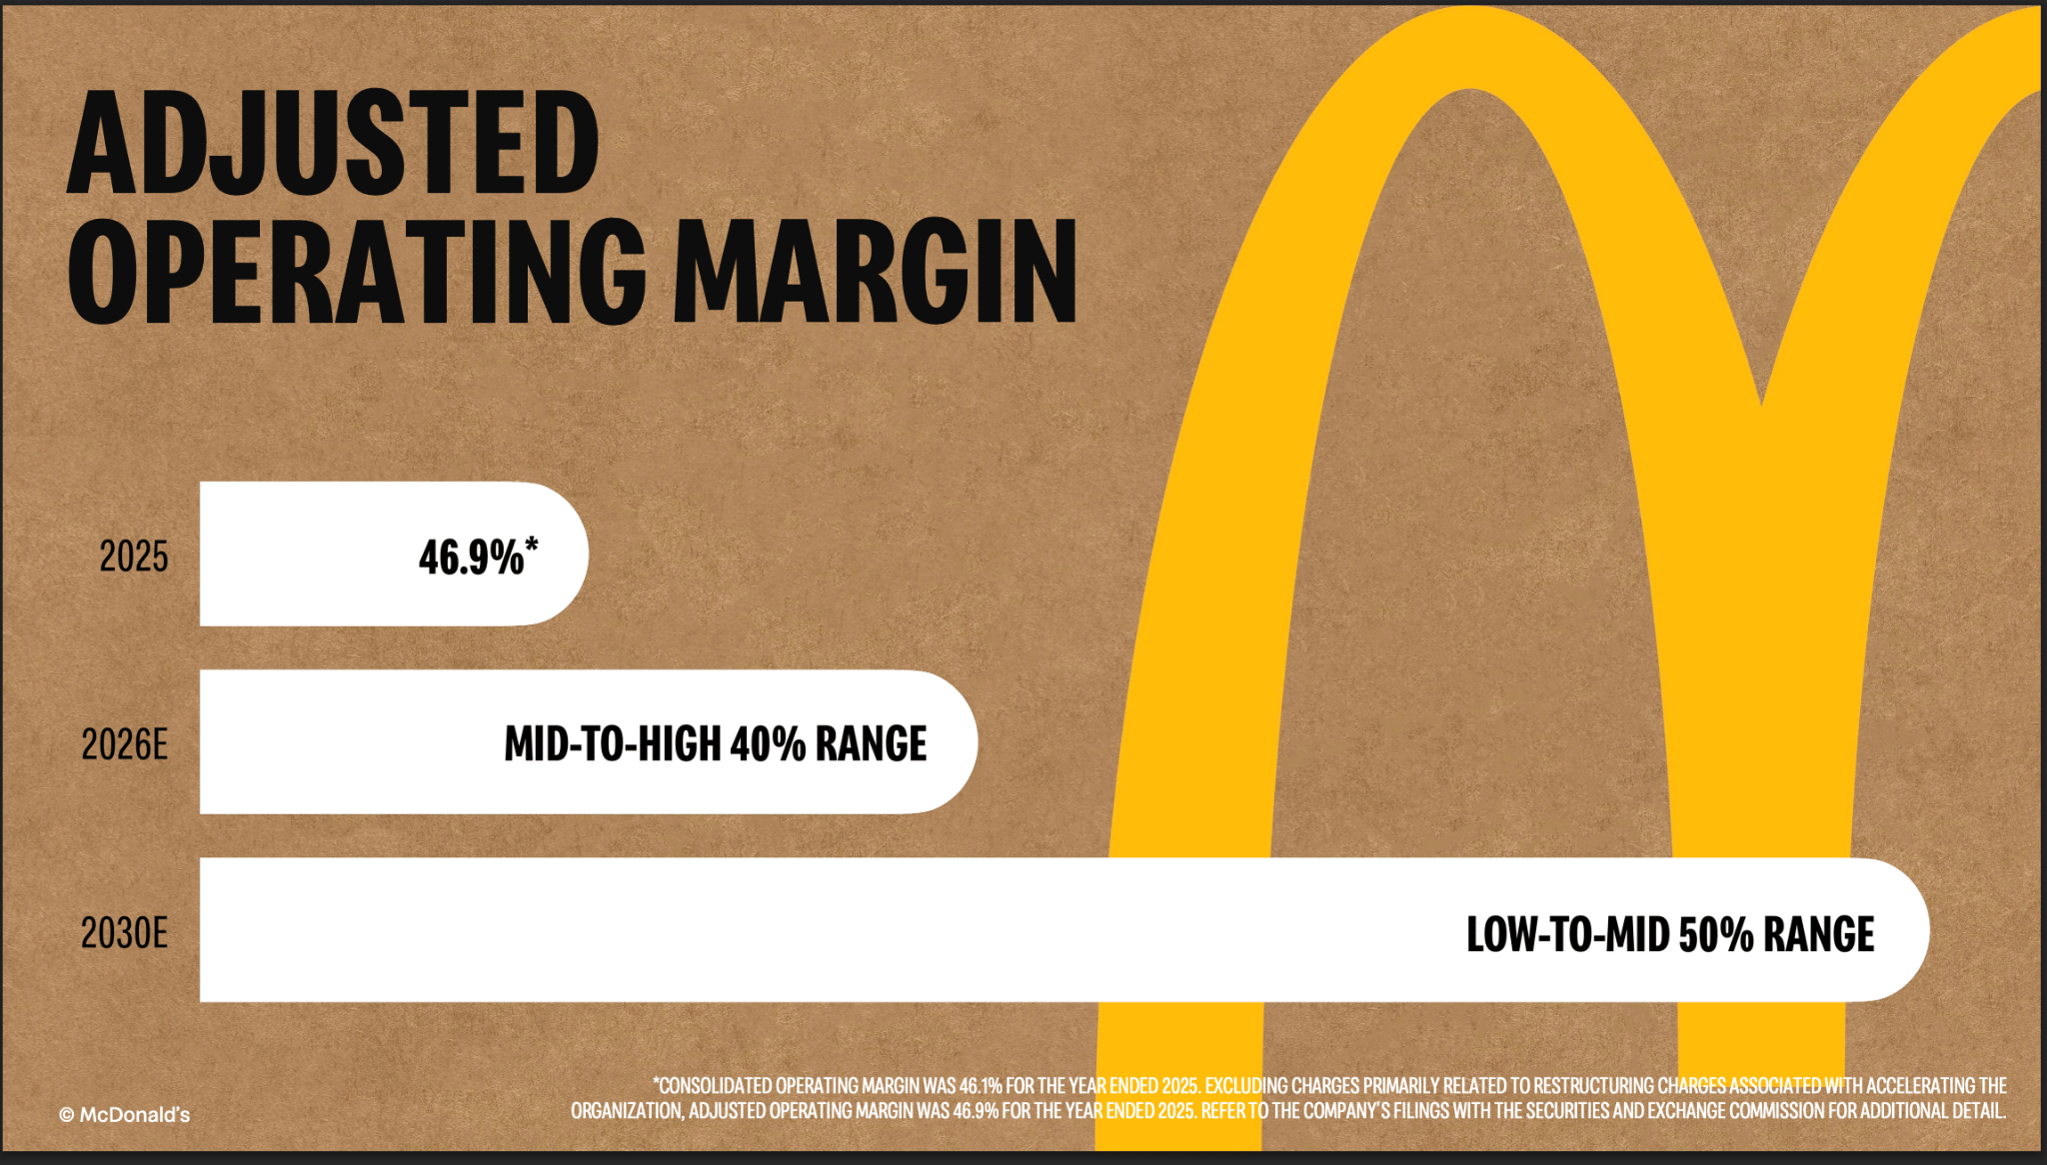
- Operating margin in the low-to-mid 50% range
- Free cash flow conversion in the mid-to-high 80% range
- About $3 billion of annual baseline capex from 2027 to 2030
- About $5 billion of franchisee support (rent relief and capital) through 2030, and $8.5 billion through 2036
The trade-off is timing. Franchisee support is expected to weigh on cash flow in the near term, with the promised efficiency gains arriving later.
For MCD intrinsic value, the question is how much near-term cash investors give up in exchange for stronger restaurants by the end of the decade.
Did the McDonald's App Move Revenue? The 2026 Natural Experiment
The McDonald's app lets the company push personalized deals, new menu items, and rewards straight to a customer's phone.
The scale is large: about $40 billion in trailing-twelve-month systemwide sales went to loyalty members as of June 2026, up more than 20%, across nearly 220 million 90-day active users in 70 markets.
By September 30, 2026, that trailing figure reached $41 billion, with more than $11 billion spent by loyalty members in Q3 alone.
For context, loyalty members accounted for $30 billion of roughly $130 billion in global systemwide sales in 2024, after growing 30% that year.
Management targets 250 million active users and $45 billion in loyalty sales by 2027.
The clearest evidence of the app's impact came when McDonald's turned it down.
On the Q3 2026 call, management said it is restoring some digital offers to drive frequency with its most engaged customers, and was encouraged by the initial response. U.S. comparable sales turned positive in September after slightly negative results in July and August, leaving the quarter at -0.2%. One quarter is a small sample, so the next few months of U.S. traffic matter more than this single data point.
Two caveats keep this in perspective:
- Loyalty sales are not all new sales. Many members would still visit without the app. The app's real value is nudging extra visits and steering customers toward specific items.
- The effect on MCD's revenue is indirect. McDonald's collects rent and royalties as a percentage of franchisee sales, so app-driven visits lift MCD's revenue only as they lift sales at the counter.
The app is a meaningful traffic lever, significant enough that removing offers showed up in quarterly results.
It works best as a tool for frequency among existing fans, while menu value and in-store experience still decide whether casual customers return.

McDonald's Economic Moat
McDonald's advantages are built into daily routines and real estate, which makes them slow to erode:
- Landlord economics: franchisees pay rent and royalties on sales, giving McDonald's a steady, contract-backed income stream.
- Global scale: more than 46,000 restaurants and 70 million customers a day spread advertising, technology, and supply chain costs across an enormous base.
- Brand portfolio: 17 menu items each generate more than $1 billion in annual sales.
- Customer data: nearly 220 million active loyalty users give McDonald's a direct line to customers that most rivals cannot match.
Think of McDonald's as the toll road of fast food. Competitors can build their own roads, but few have this many on-ramps.
However, rivals carry their own specific advantages.
Chick-fil-A has built a reputation for hospitality and chicken quality that McDonald's is now openly chasing with its "Make It Golden" service program and chicken share targets.
Taco Bell competes hard on low-price, high-variety value menus.
Specialty coffee chains own the premium beverage habit that McDonald's targets with its new beverage platform and a +1.5 point beverage share goal.
McDonald's has to defend its share against each of these strengths, rather than simply outspend them.
MCD Stock Valuation: The Bull Case and the Bear Case
McDonald's shares fell about 20% in 2026, breaking to a then 52-week low of $234.04 on September 23, the day of Investor Day, before dipping as low as $229.20.
Reasonable investors are reading that drop in opposite ways.
Then Q3 2026 results changed the mood.
Adjusted EPS of $3.57 beat the $3.38 consensus, and the stock jumped 6.5% to $280.22 on November 4.
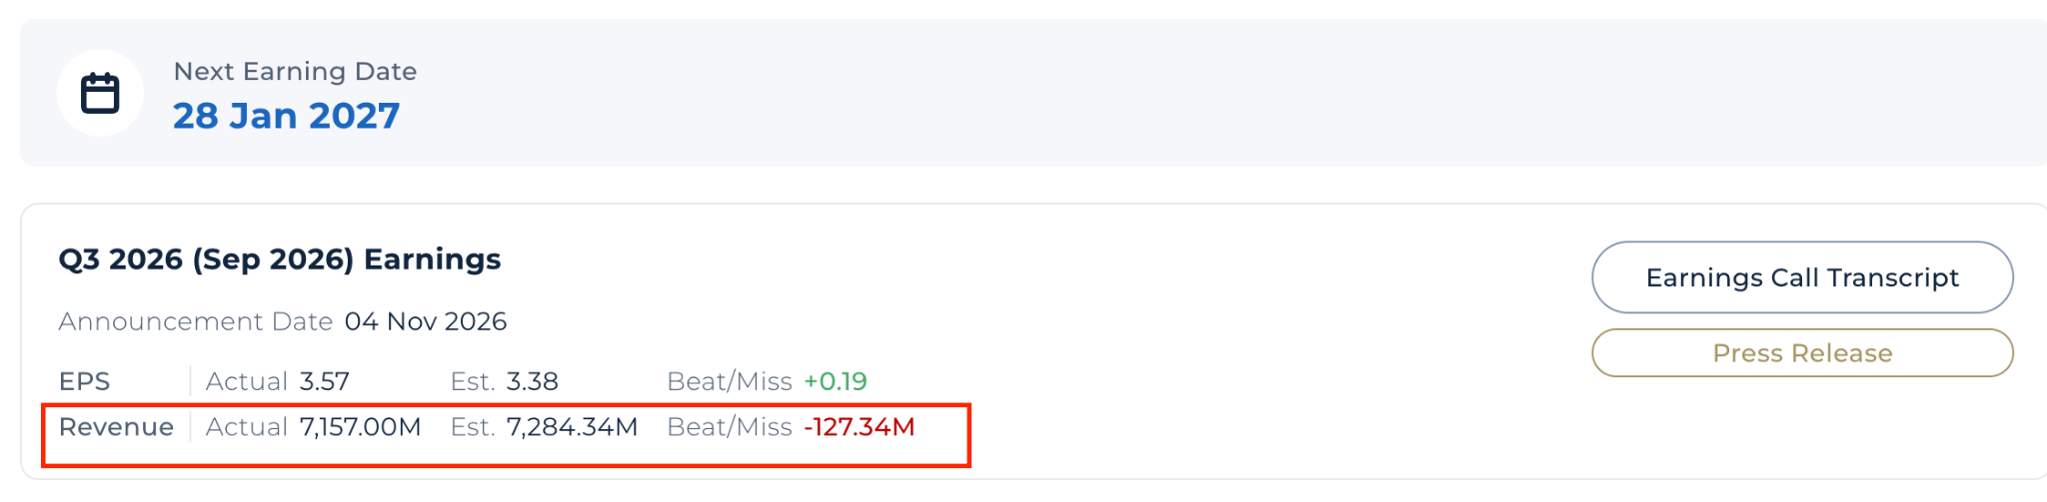
Revenue, however, came in at $7.16 billion, below the $7.29 billion forecast.
The Bull Case for MCD
- Earnings and cash intact:
$7.2 billion of free cash flow in 2025, with a target to lift conversion into the mid-to-high 80% range by 2030. Q3 2026 diluted EPS rose 10% to $3.51.
- Valuation reset:
The forward PE recently touched its lowest level since 2020, so expectations are already lower.
- Shareholder track record:
50 straight years of dividend increases, plus ongoing buybacks.
- International strength:
Q3 2026 comps rose 1.4% in International Operated Markets, led by Germany and Australia, and 4.2% in Developmental Licensed Markets, led by Japan.
- Fixable levers:
Management is restoring digital offers, and its new beverage platform launched in May has performed ahead of plan, with checks that include a specialty beverage running about 50% above the average check.
- Margin roadmap:
NEXT targets about 250 basis points of restaurant efficiency and roughly $100,000 of annual cash flow benefit per average U.S. restaurant.
The Bear Case for MCD
- Slowing sales:
Global comparable sales growth slowed from 5.7% in Q4 2025 to 3.8% in Q1 2026 and 1.3% in Q2 2026, and Q3 came in at 1.5% globally and -0.2% in the U.S., where fewer guests were largely offset by higher checks.
- A tougher consumer:
- Execution gaps:
- Near-term cash drag:
- Balance sheet:
Roughly $40 billion of total debt and negative shareholders' equity leave less flexibility if earnings stall.
- Structural demand risk:
Some analysts flag GLP-1 weight-loss drugs as a possible long-term limit on fast-food demand.
Both cases ask the same question.
Is the U.S. traffic slump an execution problem McDonald's can fix, or a lasting shift in how its customers spend?
Final Thoughts on McDonald's Intrinsic Value
MCD intrinsic value depends heavily on which lens you use:
- History-based models average PE and PS point higher, reflecting a decade of premium pricing.
- Growth-based models PEG and PSG point far lower, because McDonald's is a mature, low-growth business.
- Cash flow models land in between and swing widely with small changes in growth and discount rate.
- The MCD PE ratio near 22x sits below its 2015 to 2024 average of about 24x, as the market prices in slower traffic.
- The MCD dividend yield near 2.8% sits in the upper half of its five-year range, supported by 50 straight years of increases.
- The app and loyalty program are proven traffic levers, as the 2026 offer pullback showed.
The market has turned cautious on McDonald's in 2026, and the concerns about U.S. traffic and lower-income consumers are real.
Q3 2026 offered a first sign of stabilization, with U.S. comps turning positive in September and EPS up 10%. At the same time, the business still converts most of its profit into cash and has a clear plan to lift margins by 2030.