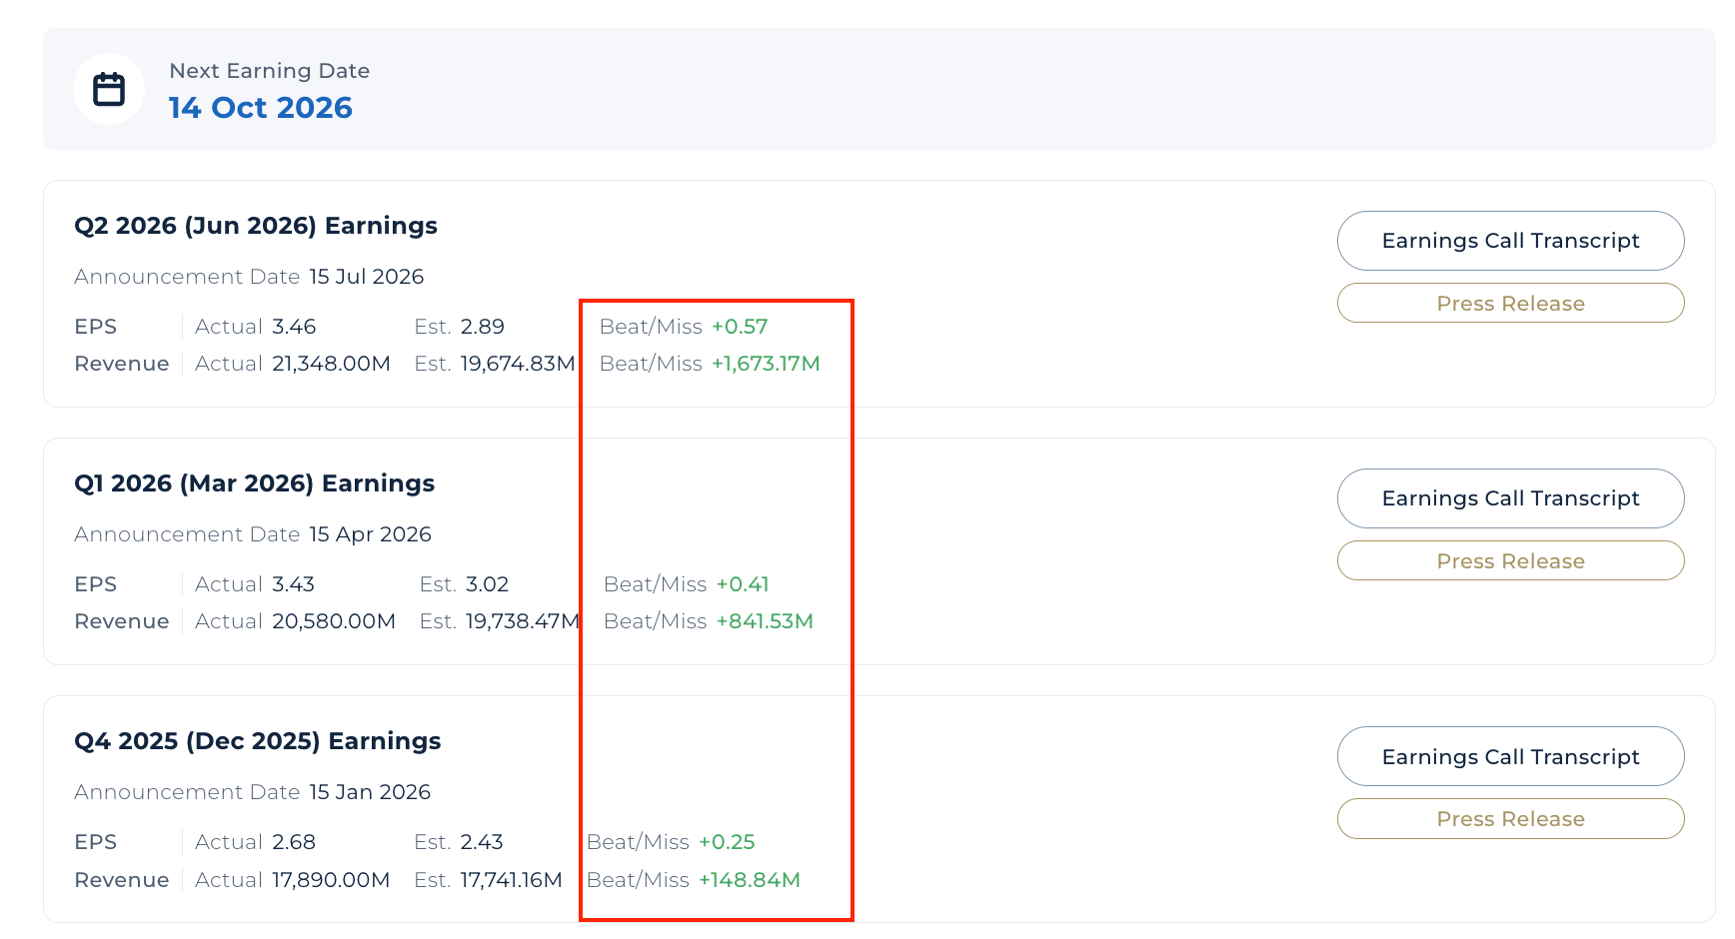
Morgan Stanley crossed $10 trillion in combined client assets and posted record revenue and record earnings per share for the second straight quarter.
Yet its own analyst coverage is unusually split, including one outright sell rating on a stock up roughly 50% over the past year.
What Does Morgan Stanley Do?
Morgan Stanley runs three global segments: Institutional Securities (investment banking, sales, and trading), Wealth Management (brokerage and advisory for individual and institutional clients), and Investment Management (asset management strategies).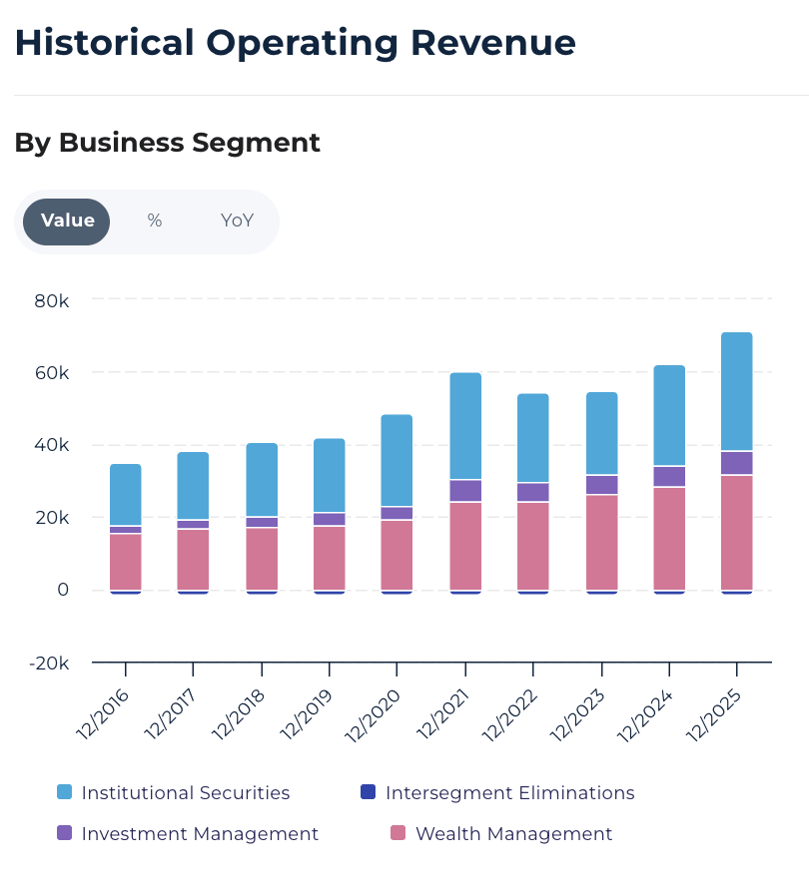
That mix ties earnings to capital markets activity and the scale of its fee-based wealth franchise, which is why this valuation section digs deeper into the numbers than most.
What Is Morgan Stanley's Intrinsic Value?
Intrinsic value is what a business is worth, based on the cash flows and earnings power it can sustain over time. It's not what the market pays for it today.
For a bank, that question isn't answered the same way as for a software company or a retailer. Morgan Stanley doesn't sell a product for more than it costs to make. It earns fees on managed assets, advises on deals, and trades on its balance sheet, and that changes which numbers matters to investors.
Morgan Stanley's Fair Value: Why a Bank Needs a Different Lens
Run Morgan Stanley's numbers through a 20-year discounted cash flow model, and the output looks disconnected from reality. The Discounted Cash Flow 20-year method lands at $358.46, the Discounted Free Cash Flow 20-year method at $312.62. Numbers that are far from the share price, say something on their own.
Cash-flow-based models built for asset-light businesses don't translate cleanly to a bank's balance sheet. Morgan Stanley's "cash flow" is tangled up with deposit inflows, trading positions, and roughly $545 billion of total debt and borrowings, none of it comparable to a company selling products or services.

Morgan Stanley (MS) Valuation Chart — Model Breakdown — Powered by StockOracle™ · Accurate as of 22 August 2026
The more useful readings sit lower on the chart. Mean Price-to-Book puts fair value at $133.57, Mean Price-to-Sales at $176.54, and Mean Price-to-Earnings at $187.27.
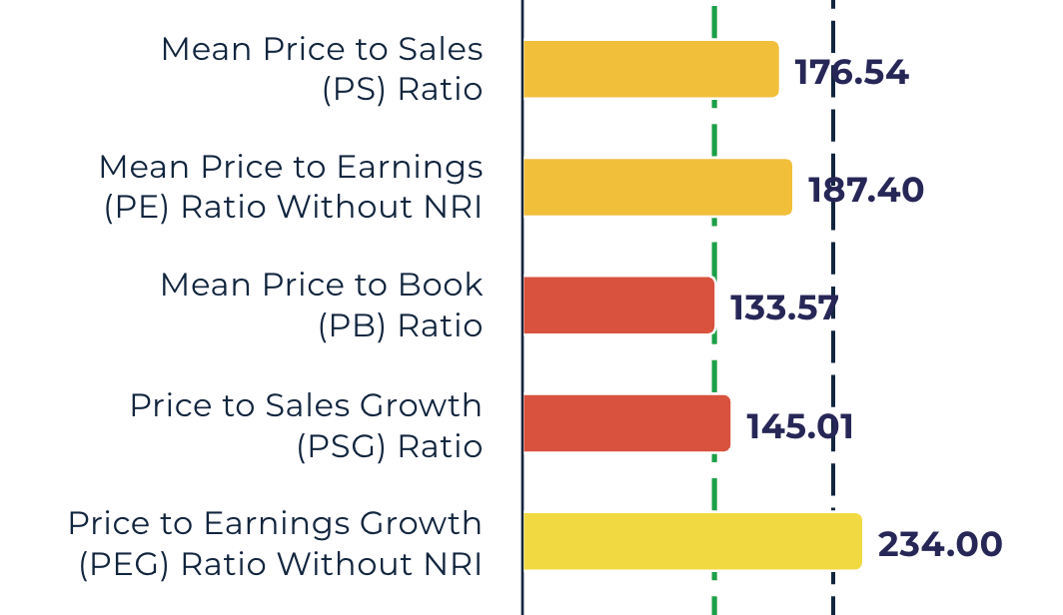
The Price-to-Earnings-Growth read of $234.00 sits modestly. These multiples-based methods work with what describes a bank's earning power, profit generated and capital deployed, rather than a cash-flow projection.
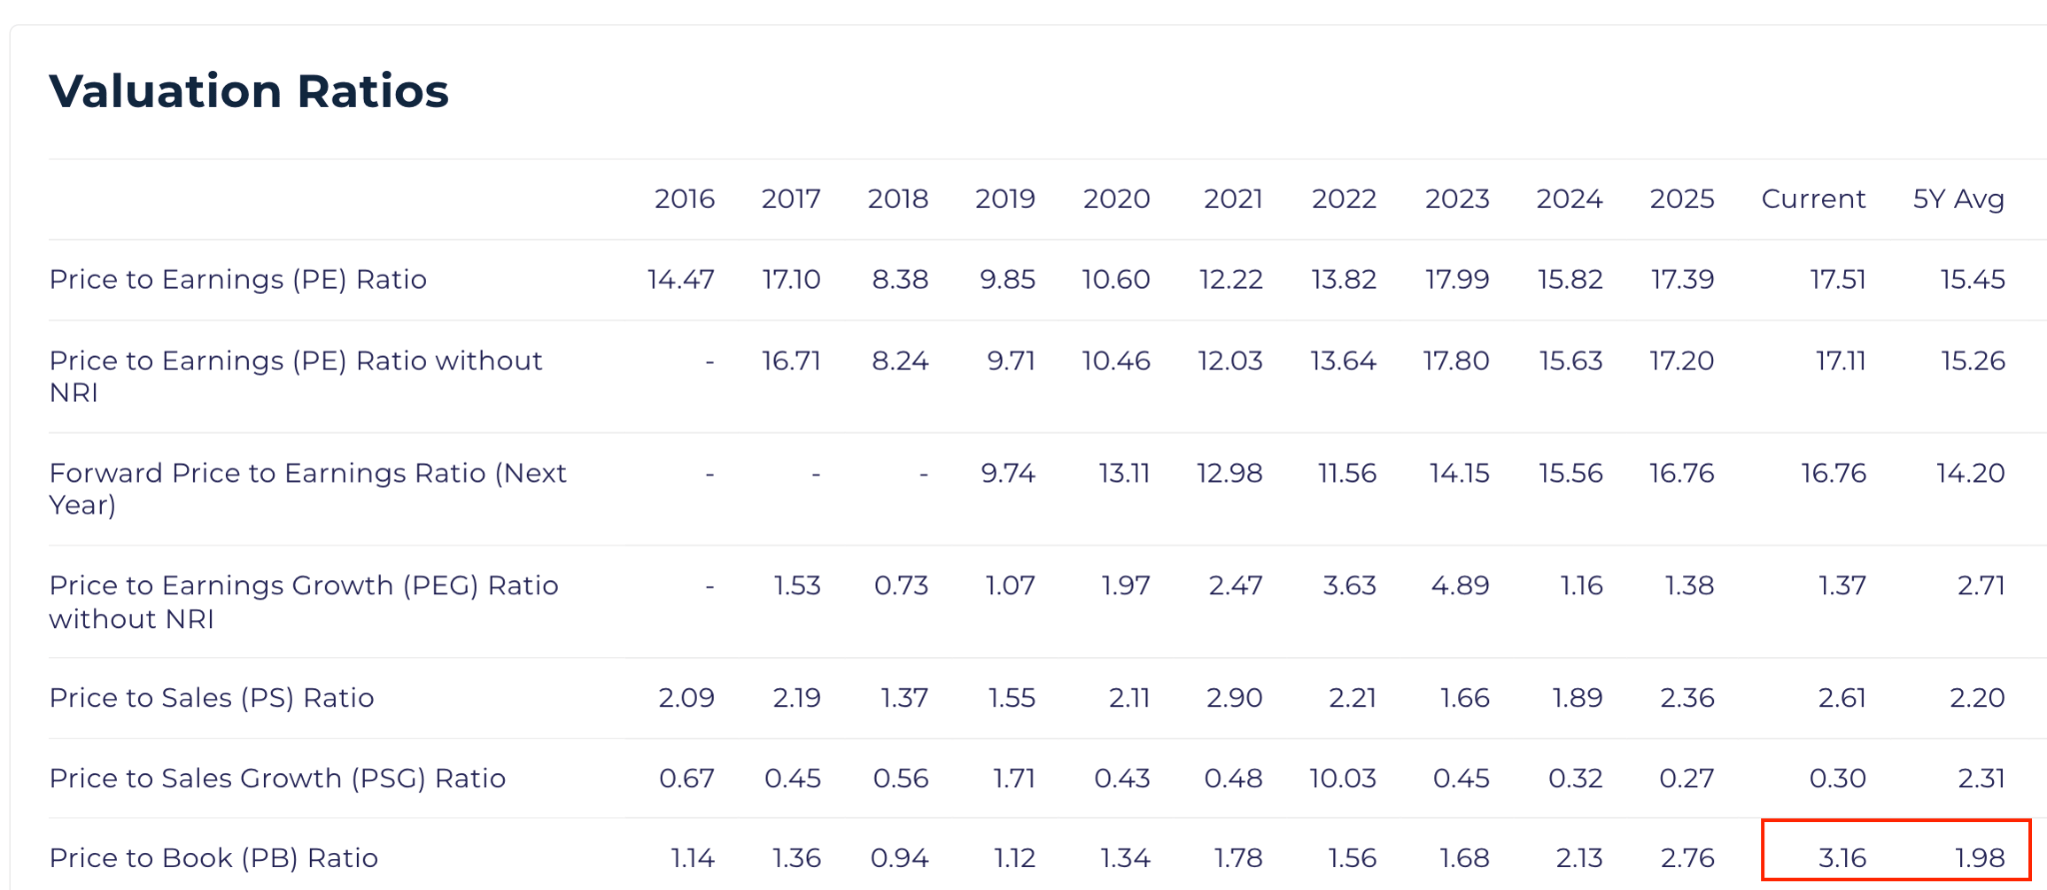
Lastly, Morgan Stanley's current price-to-book ratio of 3.16 sits well above its five-year average of 1.98 and ten-year average of 1.58. That's a real premium to its history.
Morgan Stanley (MS) Financial Performance
Revenue and Earnings: Record Results Across Both Engines
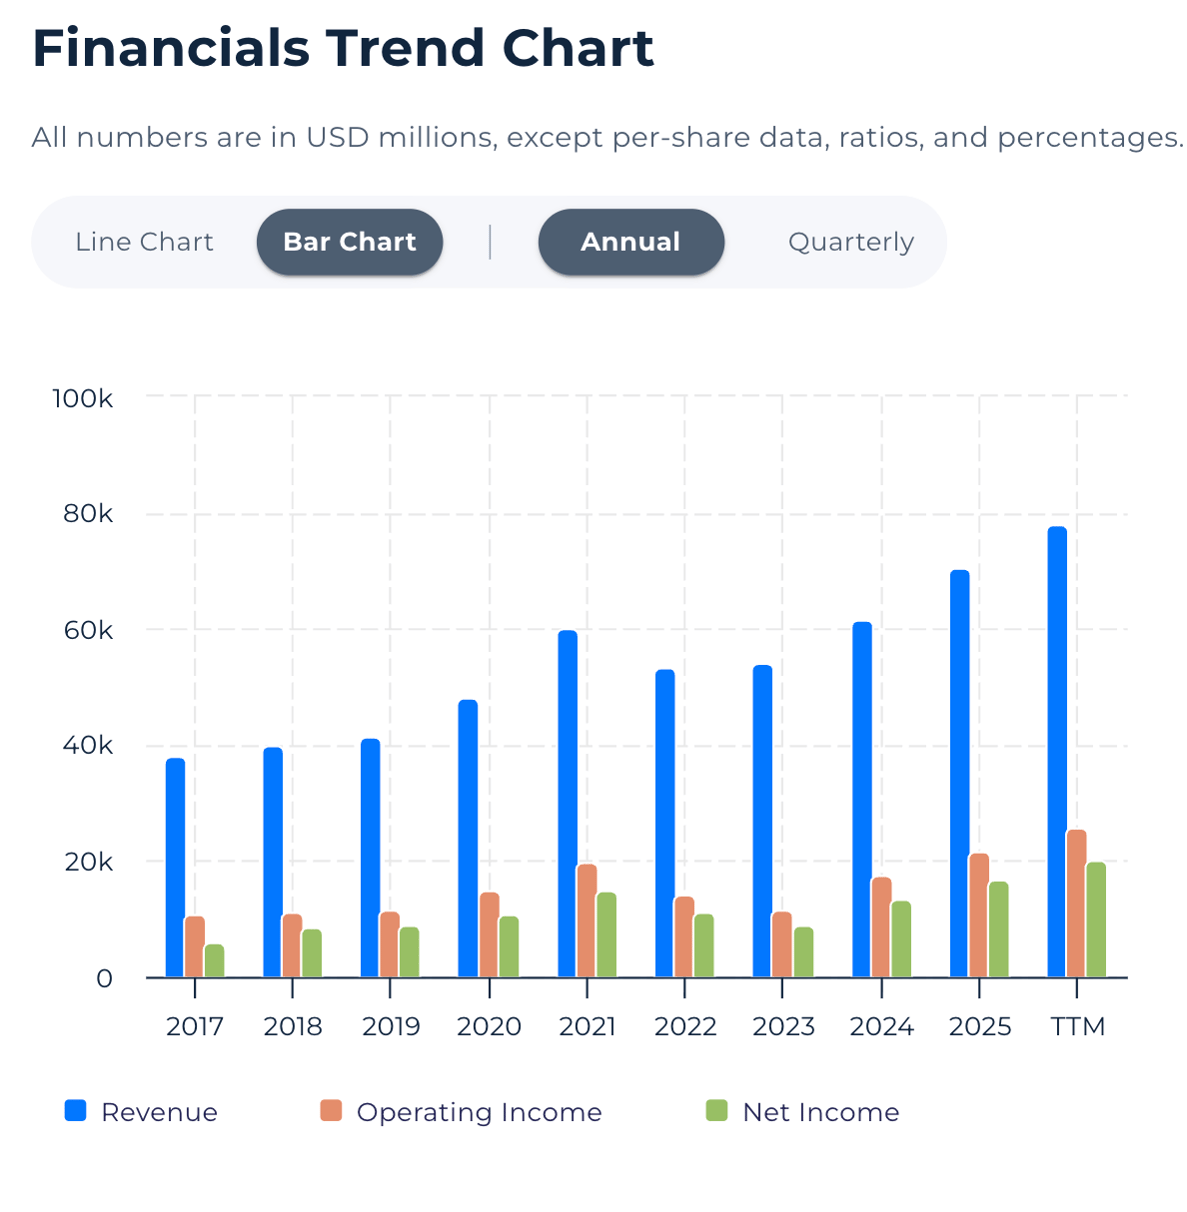
Morgan Stanley (MS) Revenue, Operating Income and Net Income Trend — Powered by StockOracle™
Second-quarter 2026 net revenue reached $21.3 billion, a record, with net income of $5.6 billion and diluted earnings per share of $3.46, also a record. Morgan Stanley's second-quarter 2026 earnings release shows return on tangible common equity of 26.6%. CEO Ted Pick credited "active markets and consistent execution across all three regions" for the results.

Wealth Management contributed $8.9 billion in net revenue at a 30.5% pretax margin and added a record $148 billion in net new assets. Institutional Securities contributed $11.0 billion, evidence both sides of the business are firing at once, not one carrying the other.
Combined Wealth Management and Investment Management client assets crossed $10 trillion, a target the firm had spent years building toward. Reaching that scale matters for the valuation debate below. A larger, stickier asset base supports the case that fee income is becoming durable and less dependent on any single quarter's trading volume.
Free Cash Flow: Why the Number Means Something Different for a Bank
For Morgan Stanley, the reported free cash flow margin of 33.25% looks strong on the surface.
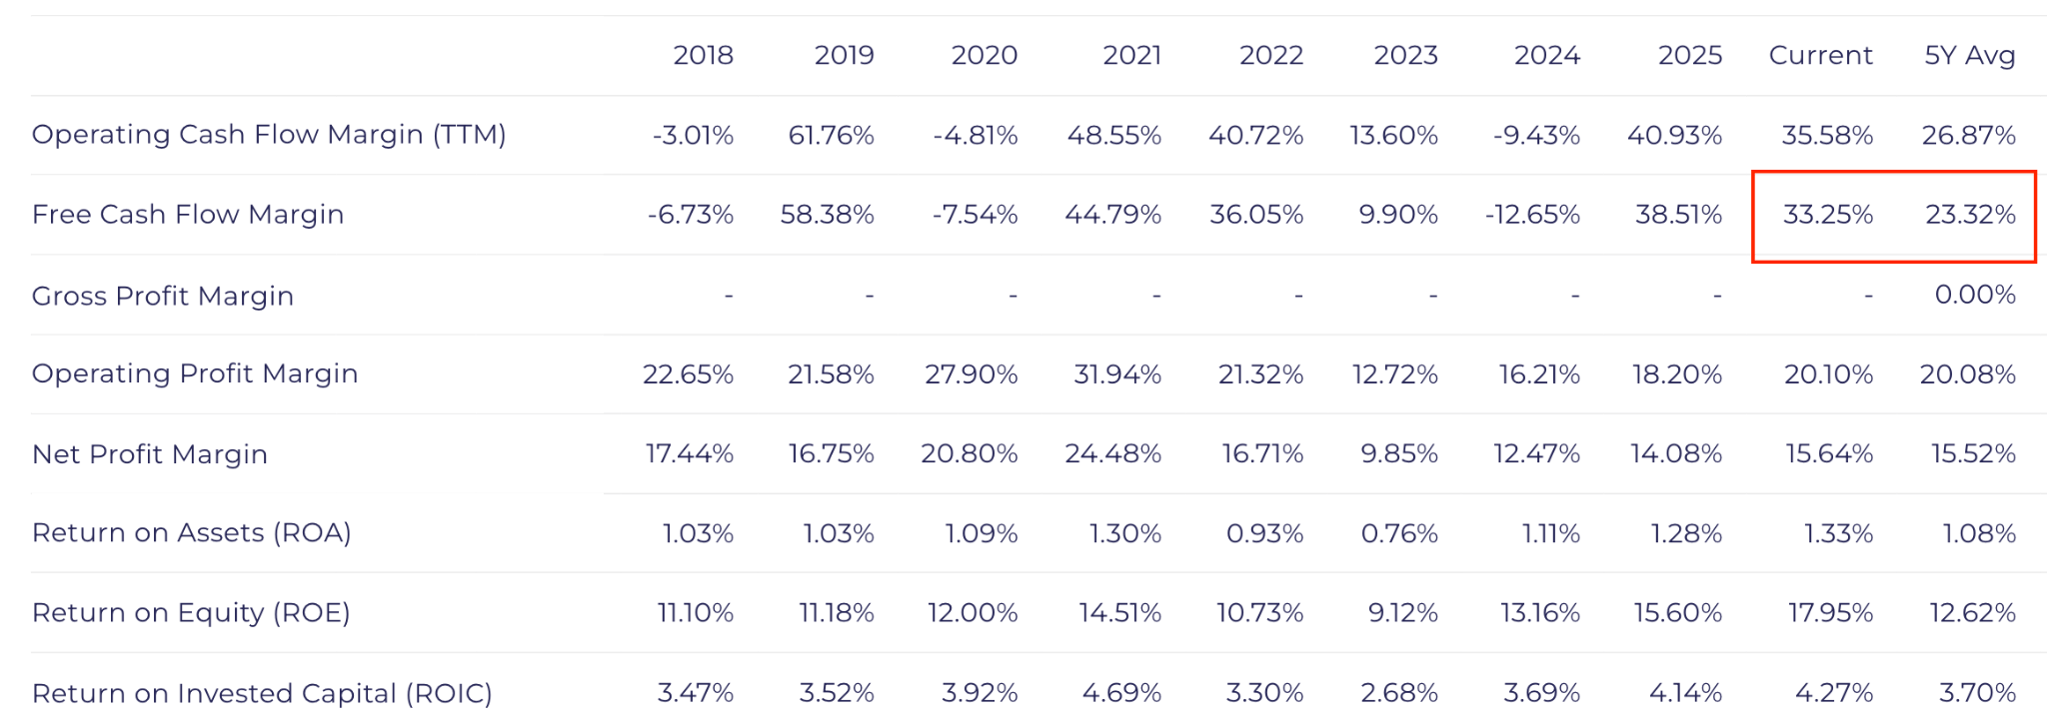
But that figure is shaped by the same deposit, trading, and financing flows that make the DCF-20 and DFCF-Terminal methods above unreliable for a bank. That's why most investors lean towards price-to-book and price-to-earnings methods instead: they isolate the profit and capital story from balance-sheet cash movements. And it brings us to our next point. MS's returns metrics.
Returns on Capital: A Decade-Long Re-Rating
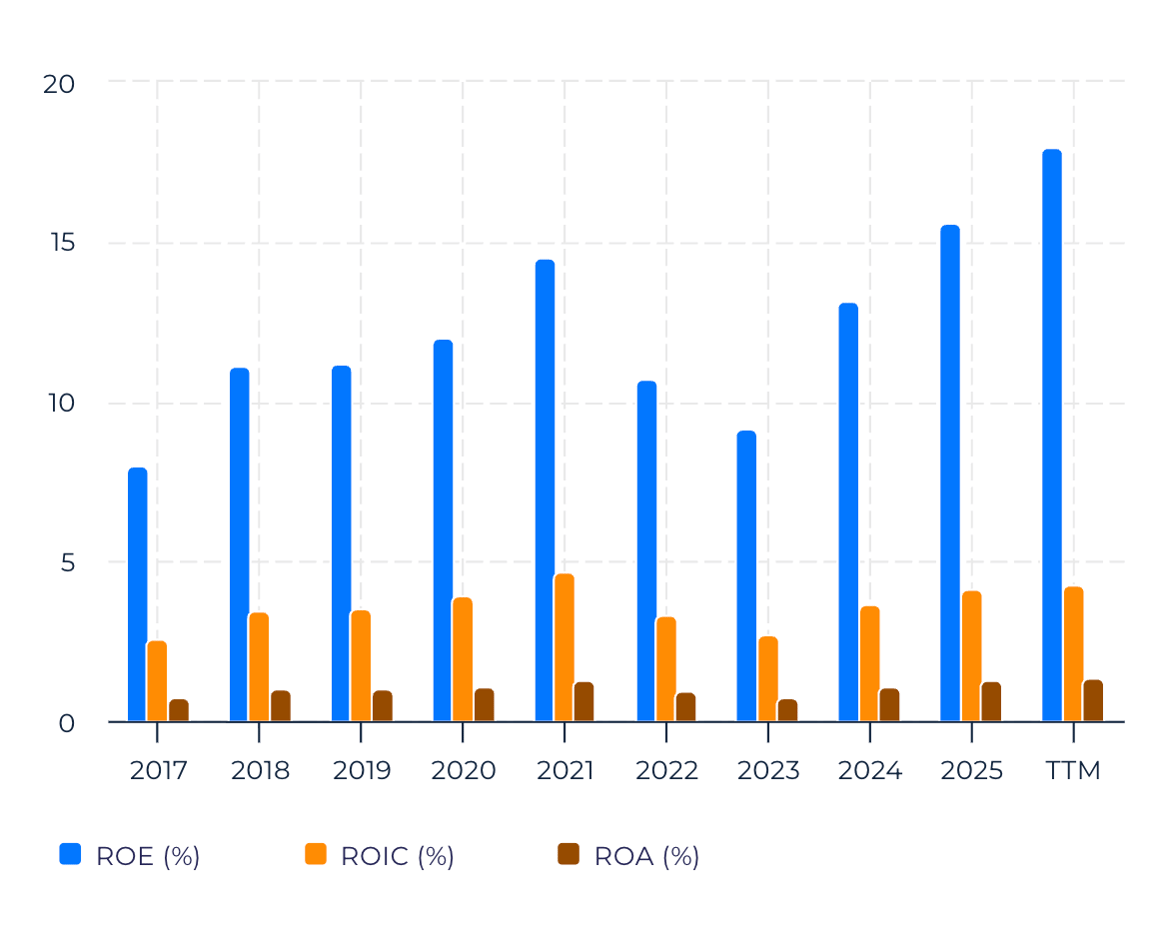
Morgan Stanley (MS) Margins and Returns Trend — Powered by StockOracle™
Return on equity (TTM) sits at 17.95%, more than double the roughly 8% it posted a decade ago. Return on invested capital reads 4.27%, roughly typical for a bank's capital structure. That climb in ROE over ten years could be the closest thing to a fundamental defense for today's above-average book-value multiple.
A bank trading at a rising premium to book value might only be justified if the returns on that equity have improved to match. On that count, Morgan Stanley's re-rating might have real substance, not just a function of the current bull market in bank stocks.
Shareholder Returns: Dividend Growth Alongside a New Buyback Program
Morgan Stanley's dividend yield sits at 1.94%, backed by a payout ratio of roughly 32%. The quarterly dividend rose to $1.00 per share in mid-2025, alongside a new $20 billion, multi-year buyback authorization with no expiration date. Management also points to improved 2025 stress test results, including a lower stress capital buffer, as evidence of the balance sheet strength behind both moves.
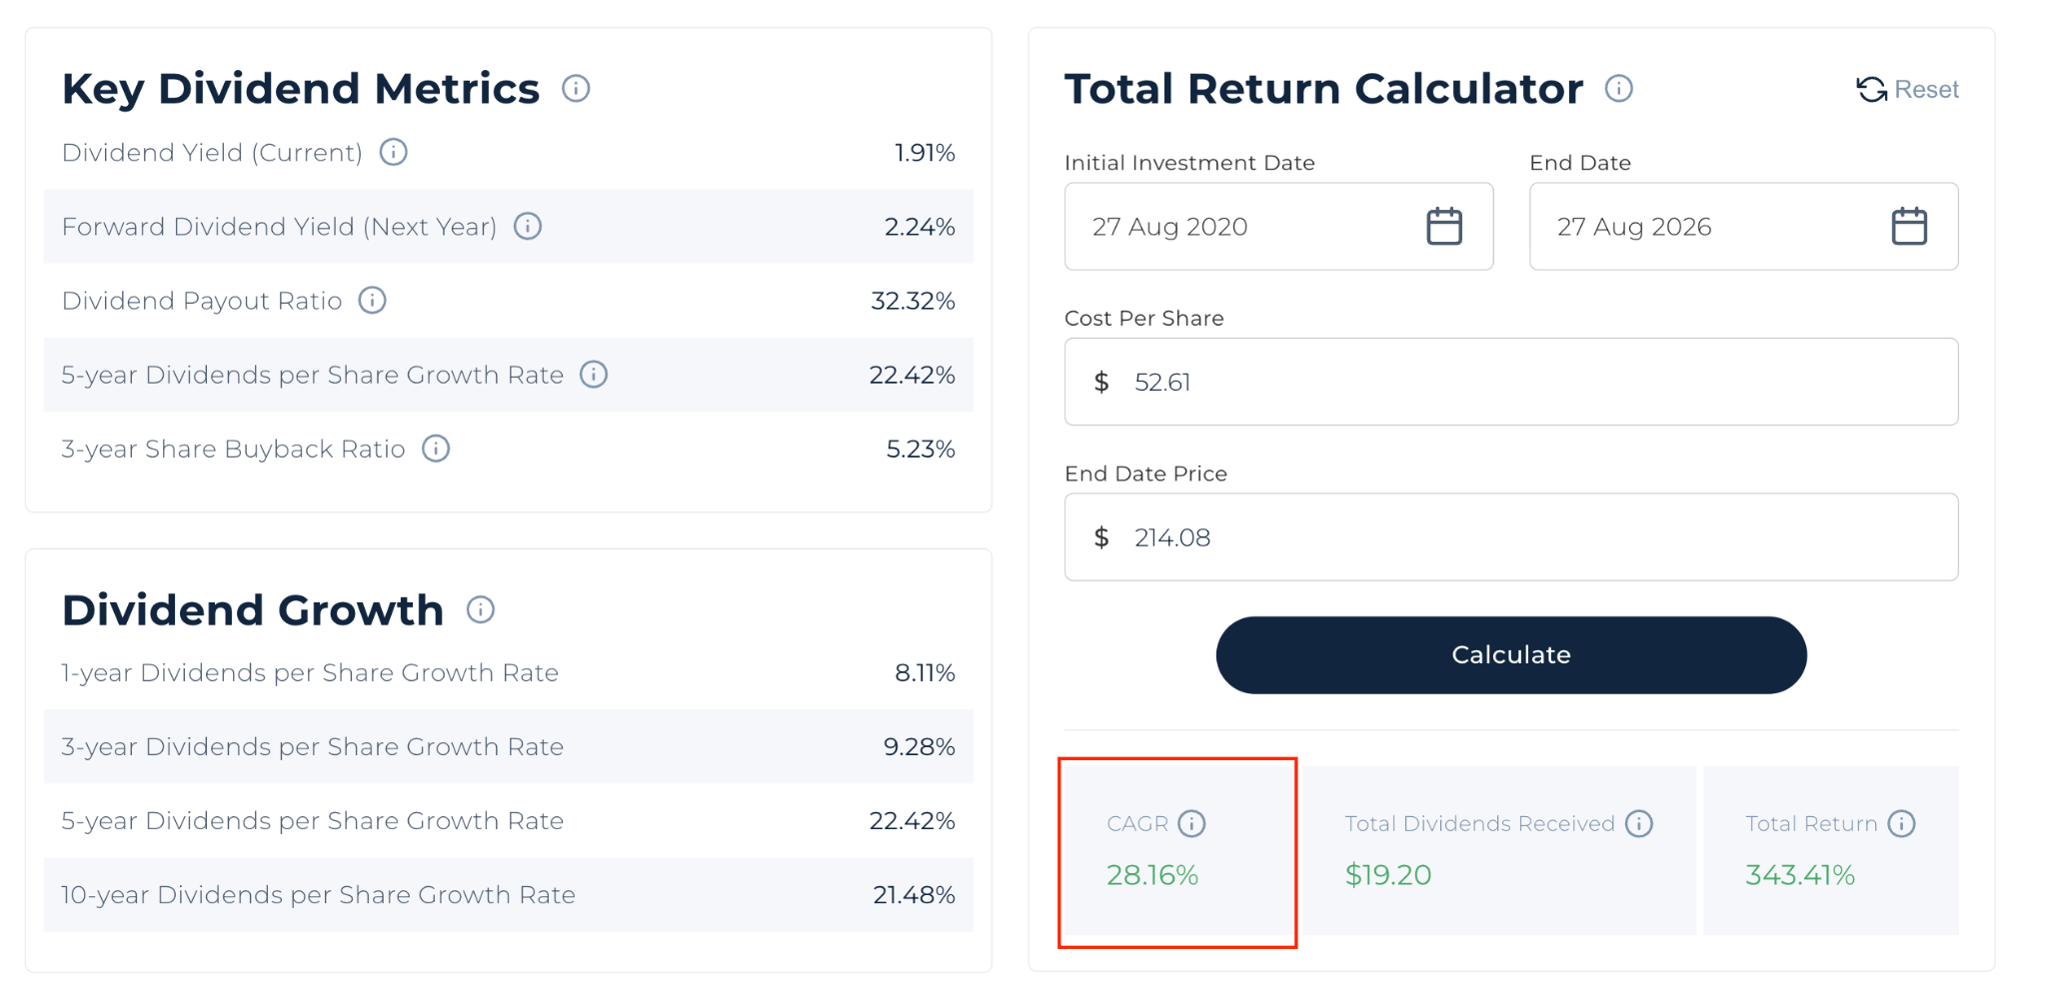
Did you know MS achieved a 5-year CAGR of 28.16%? Explore StockOracle™ to learn more.
Growth Catalysts
The Wealth Management Scale Story, Tested Against Capital Markets Cyclicality
- The $10 trillion combined client asset milestone reached in the second quarter of 2026 caps a strategy years in the making. It aims to shift Morgan Stanley's earnings mix toward recurring, asset-based fees.
- Record net new assets of $148 billion show the wealth engine is still adding scale, not just managing an existing asset base through market appreciation.
- Institutional Securities revenue of $11.0 billion confirms the trading and advisory business remains a major contributor. That cuts both ways: high-margin when markets are active, but the more cyclical half of the story.
- A $20 billion share buyback authorization with no expiration date gives management flexibility to return capital opportunistically as earnings compound.
The bull case for today's above-book premium rests on Wealth Management's fee income looking like a subscription business. The bear case is that a meaningful share of this quarter's record results, particularly in Institutional Securities, is tied to capital markets activity that has historically proven cyclical. A slowdown there would test how much of the current multiple is supported by durable fee income.
Economic Moat: Why StockOracle™ Rates Morgan Stanley a Narrow Moat
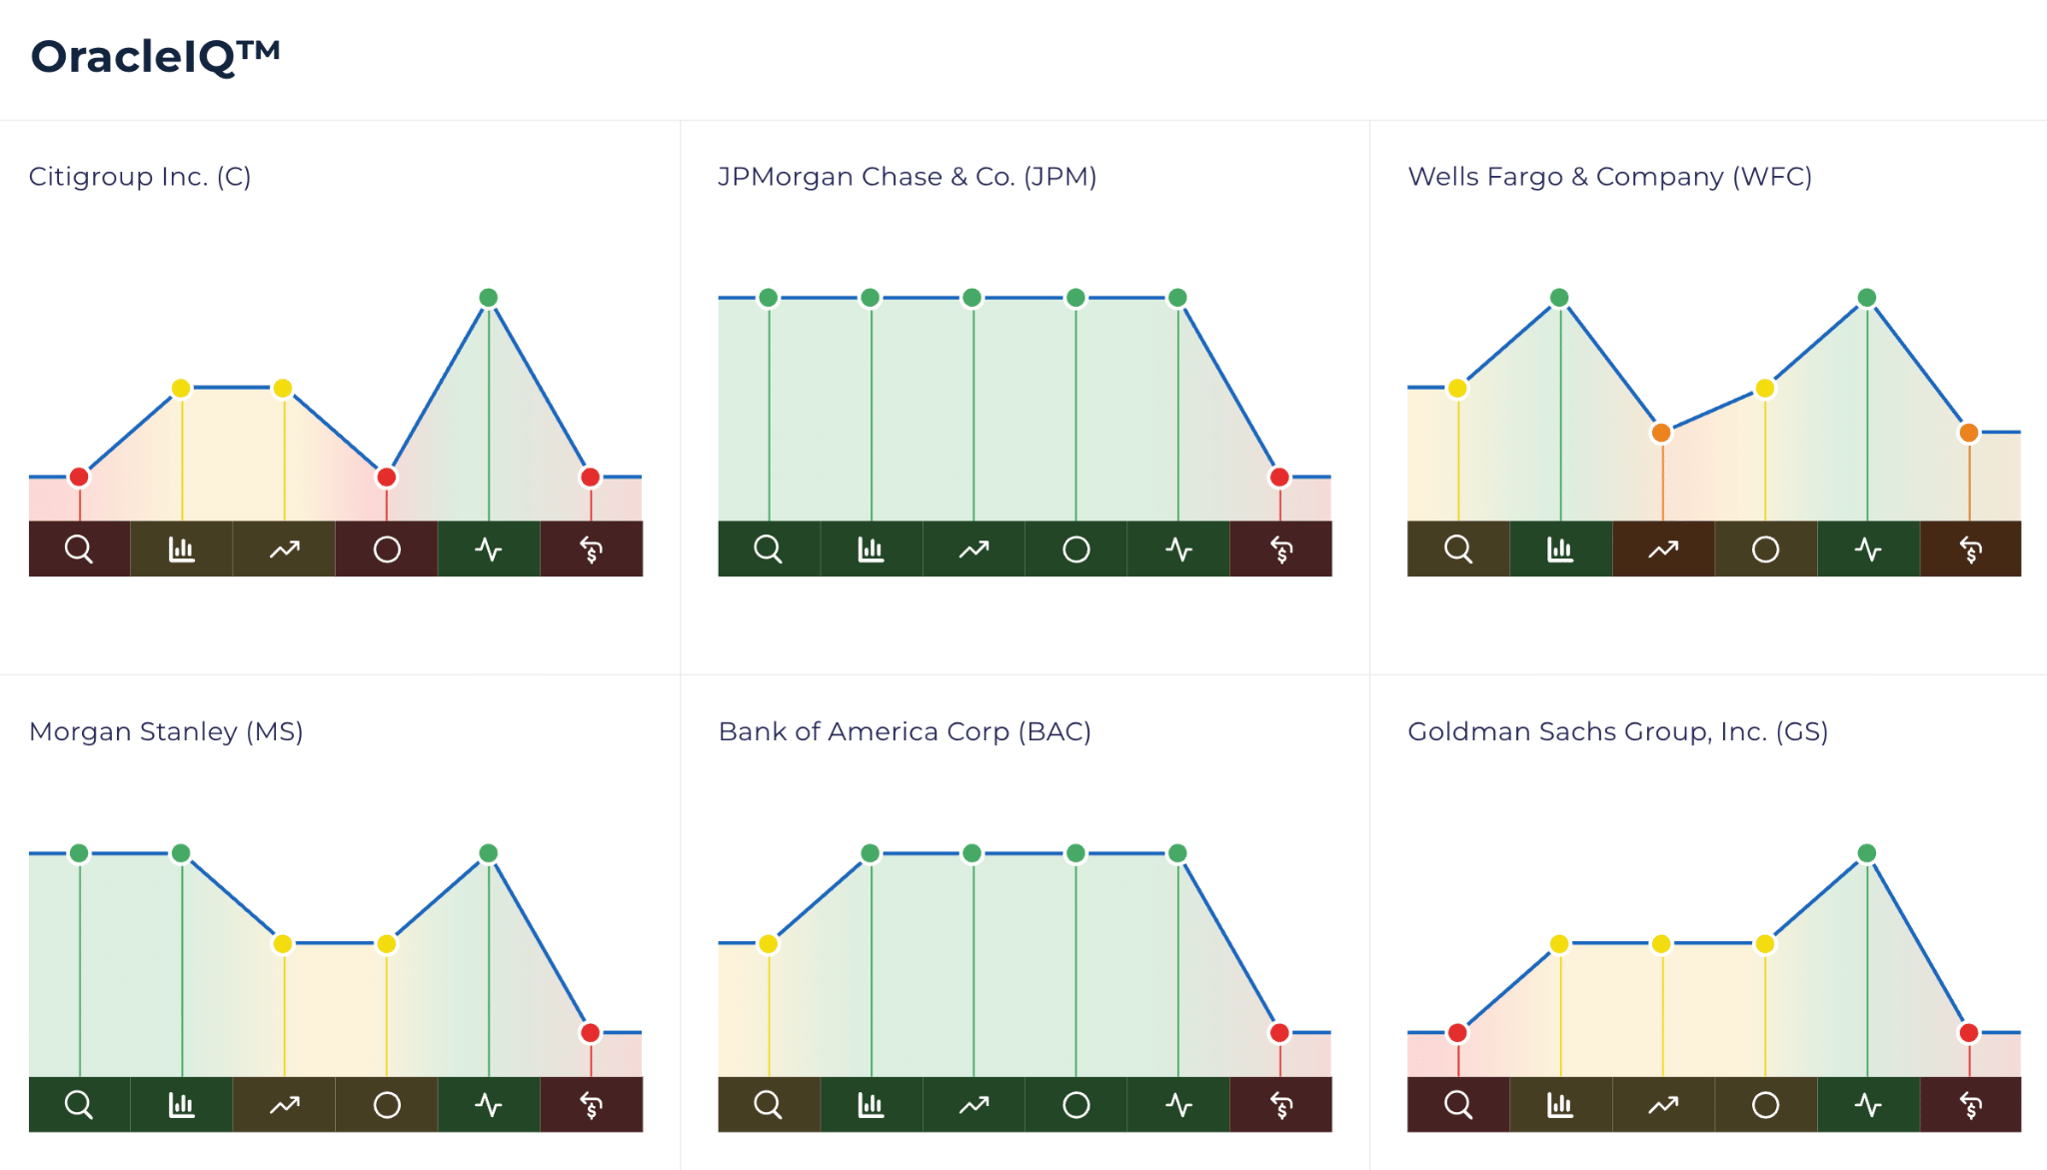
StockOracle™ rates Morgan Stanley a Narrow Moat business, a notch below the Wide Moat rating typically given by banks like JPMorgan Chase or Bank of America.
The distinction is about business mix. JPMorgan and Bank of America run on low-cost, sticky consumer deposits, a structural cost edge rivals can't easily replicate. Morgan Stanley's revenue leans more on capital-markets and advisory fees, plus asset-based wealth management fees. Although real and profitable, it's more sensitive to markets than a deposit-funded lending book.
JPMorgan Chase and Bank of America bring larger, cheaper deposit bases that fund lending more cheaply, a moat Morgan Stanley doesn't fully share. Goldman Sachs competes in trading and investment banking with a similar capital-markets-weighted model, but lacks a wealth management segment of Morgan Stanley's size.
A More Conservative Look at Morgan Stanley's Fair Value
The $132.89 mean price-to-book figure above sits well below Morgan Stanley's current price. That figure is built on a 3.16 price-to-book ratio that assumes today's elevated return on equity holds.
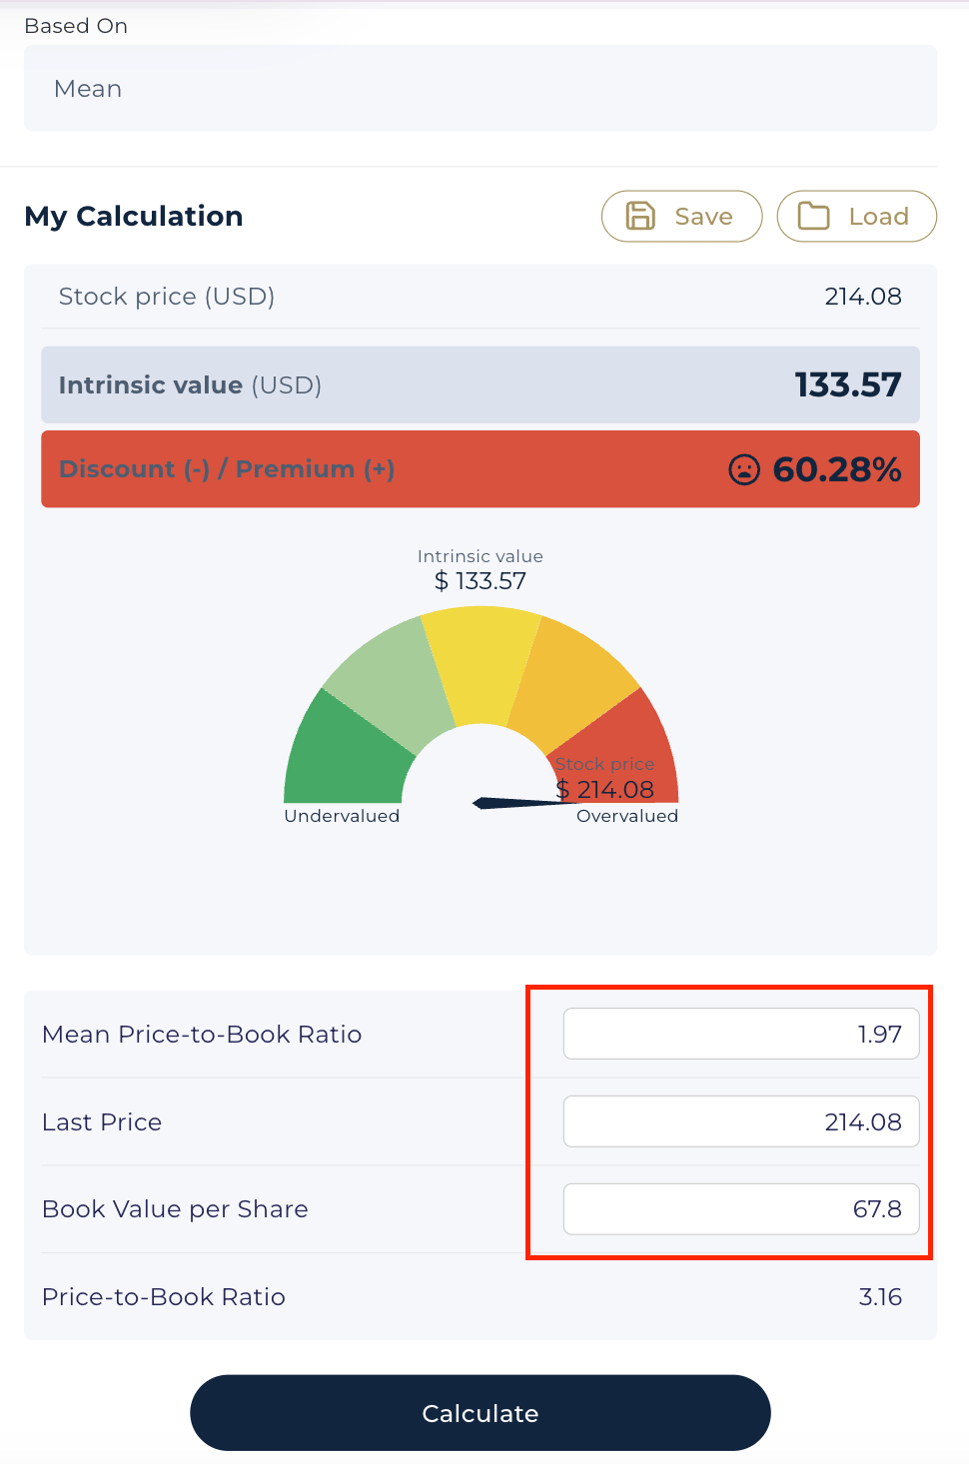
Turn the exercise around and ask what has to hold for the current premium to be fully earned. Run your own Price to Book valuation assumptions here on StockOracle™
Final Thoughts on Morgan Stanley's Intrinsic Value
- Second-quarter 2026 net revenue and diluted EPS set records, with Wealth Management and Institutional Securities contributing at the same time rather than one segment offsetting weakness in the other.
- Standard cash-flow-based models (DCF-20, DFCF-20, DFCF-Terminal) produce figures ranging from $312 to $1,176, a sign of a structural mismatch between a bank's balance sheet and cash-flow valuation, not genuine mispricing.
- The more representative lens, mean price-to-book at $132.89, sits well below the current price. Morgan Stanley's 3.16 price-to-book ratio, versus a 1.58 ten-year average, shows the market is paying a real premium to the stock's own history.
- Return on equity has climbed from roughly 8% a decade ago to 17.95% today, the clearest fundamental defense for that premium, provided the improvement holds.
- Crossing $10 trillion in combined client assets, with a record $148 billion added in net new assets, is genuine evidence the wealth franchise is compounding, not just riding market appreciation.
- The Narrow Moat rating, a notch below JPMorgan's and Bank of America's Wide Moat, reflects Morgan Stanley's reliance on capital-markets and fee income relative to the cheaper, stickier deposit funding its largest peers carry.
The business isn't in question this quarter. What's in question is whether a decade-long re-rating in return on equity can keep justifying a book-value multiple this far above Morgan Stanley's history. A slowdown in capital markets activity would test that, exposing how much of the current premium was borrowed from a strong cycle rather than earned from a structurally better business.

This analysis is shared for educational purposes only and is not intended as financial advice or a recommendation to buy, sell, or hold any security. The valuation figures above are model outputs built on stated, adjustable assumptions, not a fixed or guaranteed price target, and should not be treated as a standalone signal. Past performance, including any figures referenced above, is historical and is not indicative of future results.