There's a term circulating in media circles right now: "Second-Screen Storytelling." The idea is that Netflix viewers are increasingly scrolling their phones, or even playing games while watching. So content is being redesigned around it. More telling, less showing. Stories are engineered for divided attention.
Yes, it sounds like a cultural critique. And for investors, the real question is whether Netflix can keep getting paid while they do it. And on that front, the fundamentals tell an interesting story.
|
Key Points
|
What Is Netflix's Intrinsic Value?
Intrinsic value is what a business is actually worth based on the cash it's expected to generate over its lifetime, independent of what the market prices it at on any given day. Think of it as the difference between a stock's price and its true economic value.
Using OracleValue™, StockOracle™ estimates Netflix's intrinsic value at $82.66 per share (OracleValue™ as of 24th May 2026).
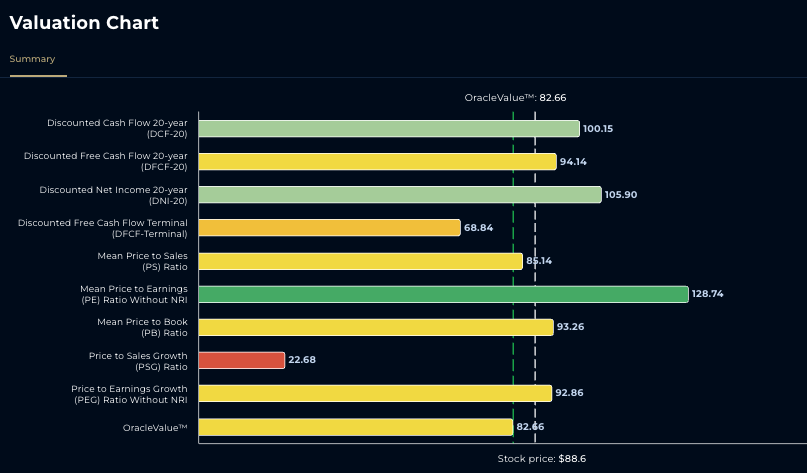
NFLX Intrinsic Value Chart — Powered by StockOracle™
Across multiple valuation methods DCF-20 at $100.15, DFCF-20 at $94.14, DNI-20 at $105.90, and Mean P/B at $93.26 – most approaches cluster in the $82–$106 range, suggesting reasonable convergence around that ballpark.
The outlier on the high end is Mean P/E at $128.74, driven by Netflix's expanding margins. The terminal FCF model at $68.84 represents the most conservative floor.
What matters: multiple independent models point to a similar zone.
How Netflix Makes Money and Why It Matters for Intrinsic Value
Netflix earns revenue through subscription fees across three tiers (Standard with ads, Standard, Premium) and a fast-growing advertising business. In Q1 2026, revenue reached $12.25 billion up 16% year-over-year. With full-year guidance of 12–14% growth.
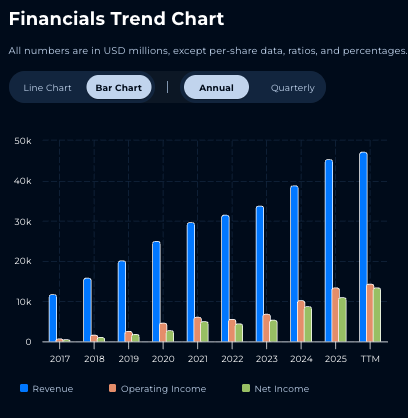
NFLX Revenue Trend — Powered by StockOracle™
But revenue is just the headline. What mostly drives the cleanest way to evaluate an intrinsic value is free cash flow. The cash left after Netflix pays for everything it needs to operate and grow.
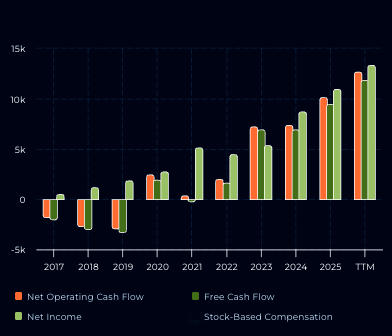
Operating Cash Flow and Free Cash Flow Chart — Powered by StockOracle™
Netflix generated $5.09 billion in free cash flow in Q1 2026 alone, up 91.4% year-over-year. Operating income rose 18.2% to $3.96 billion, with an operating margin of 32.3%. Gross margins have expanded steadily from the mid-30s in 2017 to approximately 50% on a TTM basis, while net margins have followed suit.
This is the engine behind the intrinsic value models. When a business converts a rising share of revenue into real cash the DCF model responds. Netflix is now doing exactly that and at scale.
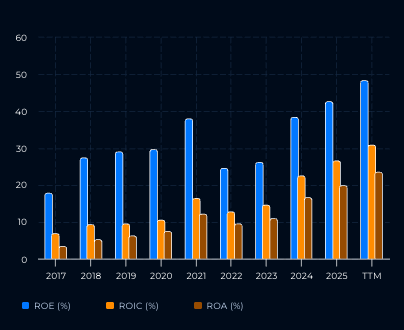
NFLX Returns Metrics (ROE / ROIC / ROA) — Powered by StockOracle™
Returns metrics tell the same story. ROE, ROIC, and ROA have all trended upward through 2025 and into the TTM period ROE approaching 50%, ROIC near 30%. These aren't vanity metrics. Rising ROIC signals that each dollar Netflix reinvests is generating more value than the last, the definition of a compounding business.
Interested in Netflix? Read more in our Netflix Deep Dive with StockOracle™
The Second-Screen Problem — and Why the Business May Not Care
Here's the honest tension: if viewers are half-engaged, does content quality erode? And if quality erodes, does churn rise?
Maybe. But Netflix's moat doesn't rest on any single show being great. It rests on scale, data, and switching inertia.
Amazon Prime Video reaches hundreds of millions of Prime members who already pay for shipping. Disney+ owns one of the most valuable IP catalogs in entertainment. YouTube captures free-tier viewing hours at a scale no subscription service can match. These are competitors with deeply embedded distribution advantages. Netflix defends its position through sheer content volume, a recommendation engine trained on 325 million subscribers, and an ad platform growing 70%+ year-over-year with over 4,000 advertisers.
The content machine runs at full speed with 568 new Originals in 2023, 589 in 2024, and 597 in 2025, with a single-year peak of 749 back in 2022.
If anything, Second-Screen viewing might accelerate Netflix's ad-tier thesis. More passive viewers = more ad inventory consumed anyways. Management is targeting ~$3 billion in advertising revenue in 2026, effectively doubling ad revenue. High-margin, scalable, recurring. This is the kind of revenue stream that moves intrinsic value estimates upward over time.

Growth Drivers For Netflix
Subscriber expansion isn't done. Netflix crossed 325 million paid subscribers in Q1 2026, up from ~301.6 million a year prior. EMEA (~101M), UCAN (~89.6M), APAC (~57.5M), and LatAm (~53.3M) are all contributing. Management estimates a global addressable audience approaching one billion — suggesting the current base is roughly one-third penetrated.
Live sports as a churn reducer. Netflix streamed the MLB Opening Day exclusively in 2026 under a three-year deal. The World Baseball Classic in Japan drew 31.4 million viewers and drove record paid net adds in Japan that quarter. Live events don't just attract viewers; they make cancelling feel hard.
The ad tier is a margin unlock. Advertising carries structurally higher margins than subscription revenue. It improves revenue per user without requiring proportionally more content spend. Each incremental ad dollar flows more directly to free cash flow.
Content spend is disciplined, not reckless. Netflix plans ~$20 billion in content spend for 2026, but against $12.25 billion in quarterly revenue and a 32% operating margin, this is self funded growth. Additionally the $2.8 billion breakup fee from the Warner Bros. Discovery deal provides additional dry powder for redeployment.
Investment Risks of Netflix
No Investments are without risks and Netflix faces a convergence of near-term and structural risks. Q2 2026 guidance came in below analyst expectations on both revenue and EPS. Margins are already under pressure as content costs balloon toward $20 billion in 2026.
Longer term, the competitive threat is real: a combined Paramount-Skydance could pull ahead of Netflix in U.S. market share, while YouTube's 37.5 million unique users in Spain versus Netflix's 15.9 million signals how user-generated platforms are quietly eating into engagement. Add in Reed Hastings' board exit, execution risk in scaling the ad business to its $3 billion target, and the looming threat of subscription fatigue and the bull case requires a lot to go right simultaneously.
Final Thoughts on Netflix's Intrinsic Value
The Second-Screen narrative is real. Viewing habits are shifting, and Netflix is adapting content to match. The business underneath, the cash flows, the margin profile, the subscriber base, the ad platform is still compounding in a way the headlines don't capture.
If advertising scales as projected and FCF margins continue expanding, that figure becomes a conservative starting point. Investors who anchor to fundamentals rather than cultural commentary may find that Netflix's story looks quite different from the business side of the screen.
Compare other streaming and media companies' intrinsic value with a free StockOracle™ trial.