By Piranha Profits Team
Last updated on June 10, 2026
When most investors compare Disney and Netflix, the conversation naturally ends up in the same place: which one is cheaper and which one is growing faster.
While that is a good start, it's important to first understand the underlying business before valuations and growth assumptions come into the picture.
|
Key Points
|
Disney (DIS) and Netflix (NFLX) are not the same type of business. While they share an industry and they both own original content, the way each company makes money, spends capital, and generates returns is structurally different.
Treating them as a straight apples-to-apples comparison can lead investors to the wrong conclusions.
So, let's look at the businesses first.
Netflix and Disney Business Model and Segments
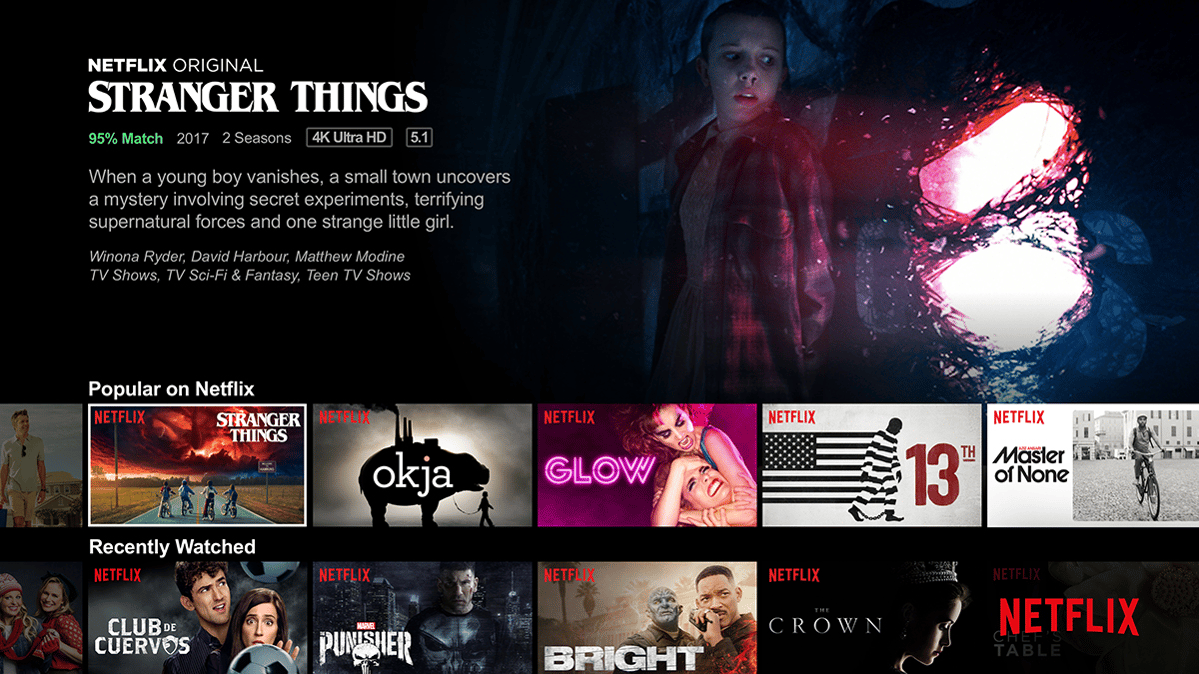
Netflix is a pure-play streaming business.
Its revenue model is extremely simple: subscribers pay a monthly fee to watch, and advertisers pay to reach those subscribers through an ad-supported tier. That's it.
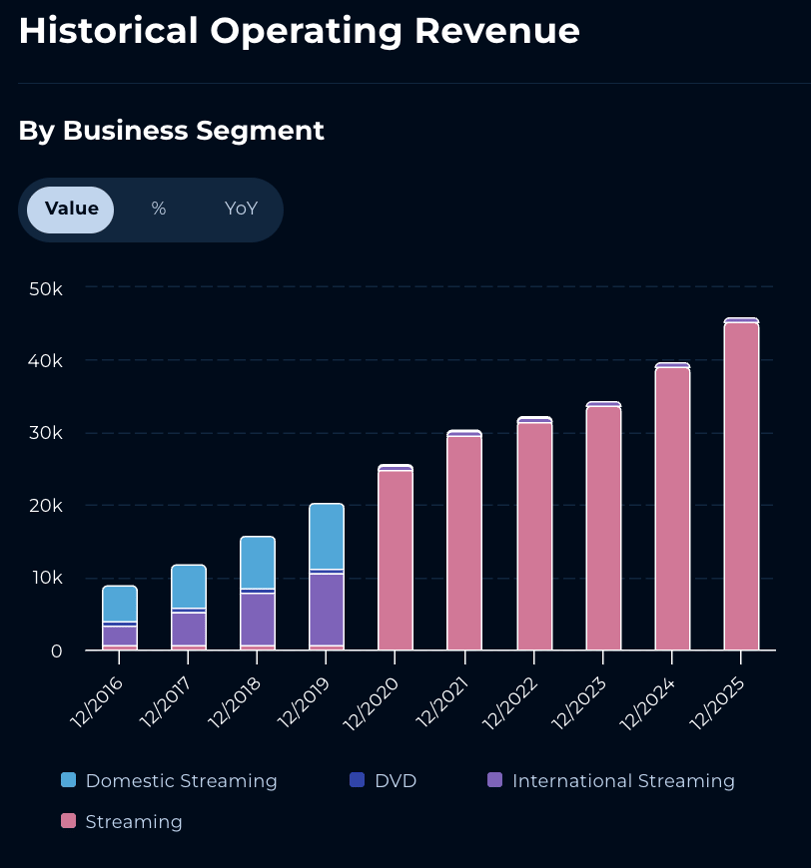
Netflix Historical Revenue by Segment — Powered by StockOracle™ 10th June 2026
Look at Netflix's historical revenue chart, and the simplicity is visible. Up until 2019, you could see three revenue streams: domestic streaming, international streaming, and a shrinking DVD business. Today, it's effectively just one bar, streaming.
The DVD segment is long gone. The entire company is organised around a single product and a single distribution channel.
That simplicity has a powerful financial consequence. Netflix's revenue scales without proportionally growing its cost base. Content is the primary cost and once a show is made, it costs roughly the same to stream it to 10 million viewers as to 100 million. This is what drives the margin expansion story.
Disney – Many Businesses in One Stock Price
Disney is different entirely.
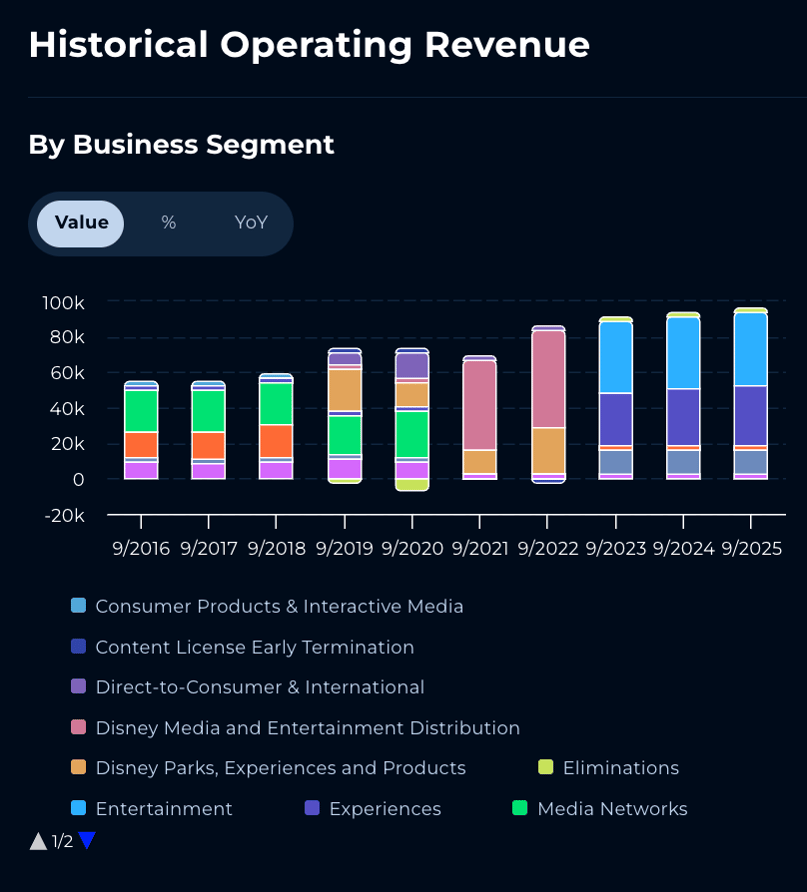
Disney Historical Revenue by Business Segment — Powered by StockOracle™
Disney's revenue chart tells the story visually: it's a stack of multiple segments, each with its own economics, growth trajectory, and capital requirements.

img src : Disney Cruise Line
In fiscal 2025, Disney's Experiences segment (theme parks, cruise ships, and resorts) generated approximately $36 billion in annual revenue, making it the company's single largest business unit and the segment that produced record operating income of $10 billion for the full year.
And.. that segment has nothing to do with streaming. It's subject to tourism cycles, weather events, and geopolitical travel patterns in a way that does not affect streaming platforms as much.
Then there's Entertainment, which includes Disney+, Hulu, Hotstar, ABC, and the studio pipeline.
After years of losses, streaming reached profitability: direct-to-consumer operating income climbed from around $100 million in fiscal 2024 to $1.3 billion in fiscal 2025. That's a meaningful inflection, but the segment still operates alongside a declining linear TV and cable business that is losing affiliate fees and advertising revenue as cord-cutting accelerates.

img src : ESPN Wide World of Sports at Disney World – Orlando , FL
Sports (ESPN) is in its own transition too, the standalone ESPN DTC product launched in August 2025 and is still unproven at scale.
Running five businesses with different capital needs, margin profiles, and growth rates simultaneously is a structural challenge that Netflix simply doesn't need to face.
But the tradeoff cuts both ways.
Netflix's single-business focus means its business rises and falls entirely on streaming.
Disney's diversification across parks, sports, media, and streaming provides more revenue sources but more moving parts, each with different growth trajectories and different risks.
What the Financials Look Like Side by Side
Netflix Financials Trend Chart Powered by StockOracle™
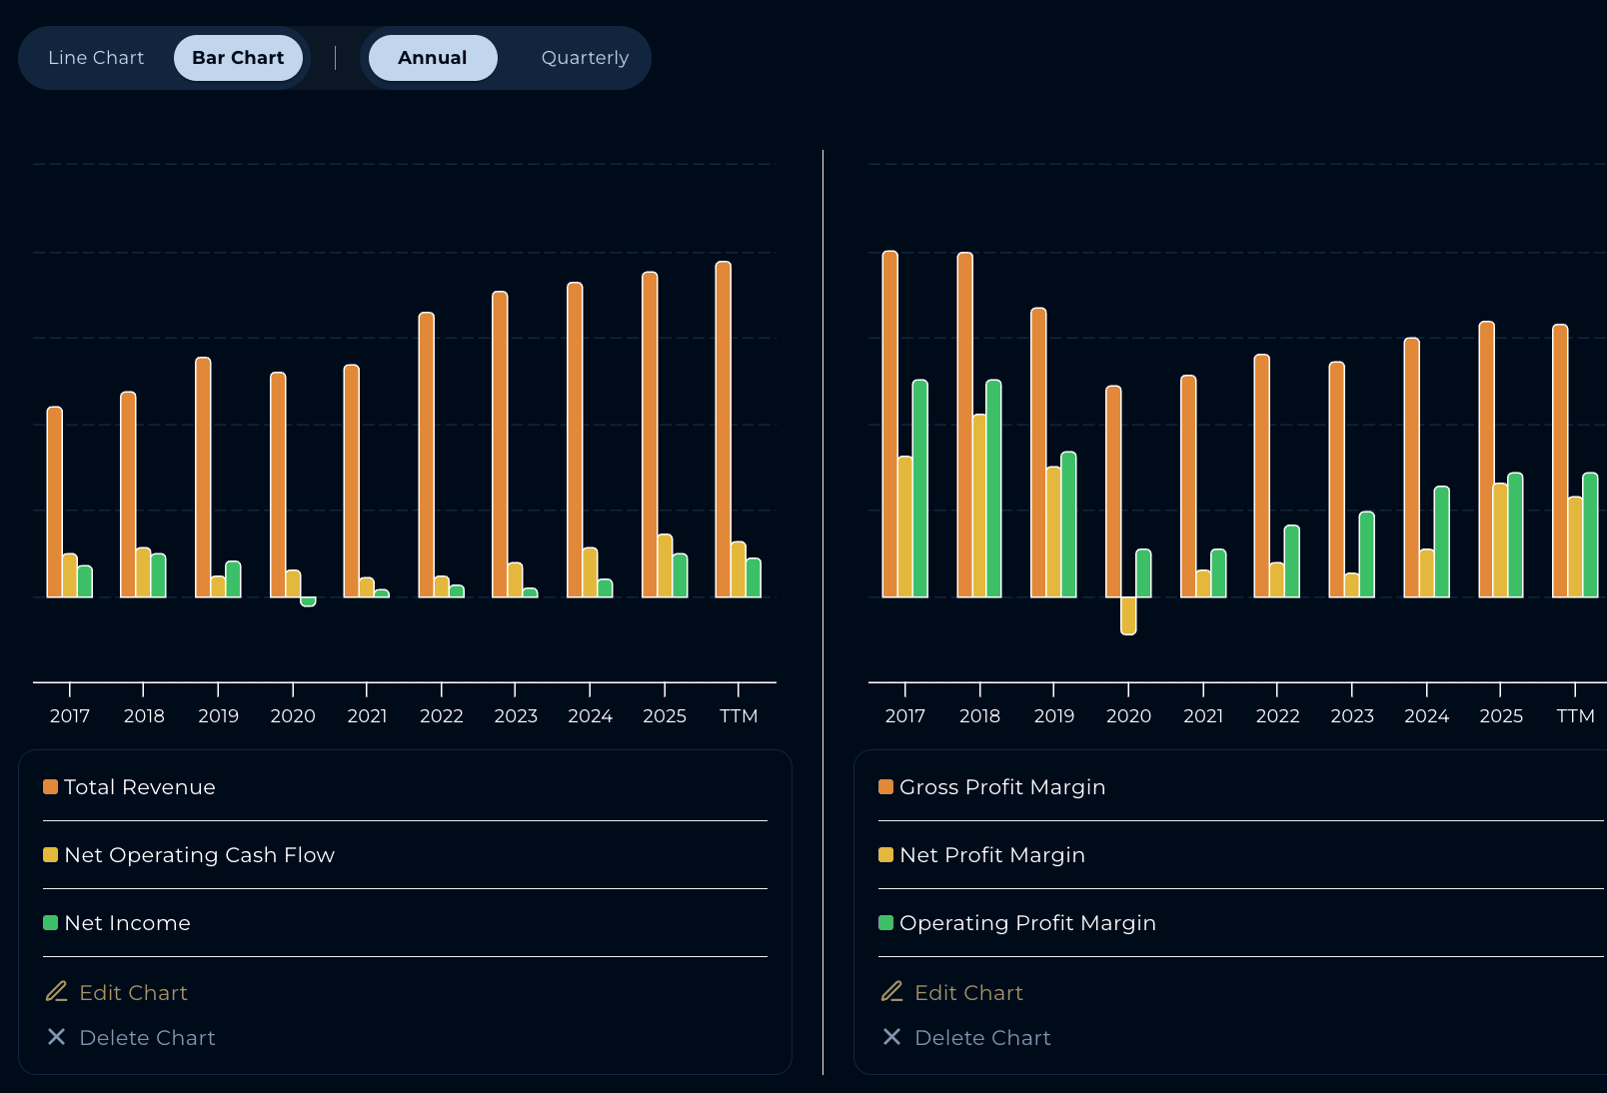
Disney Financials Trend Chart — Powered by StockOracle™
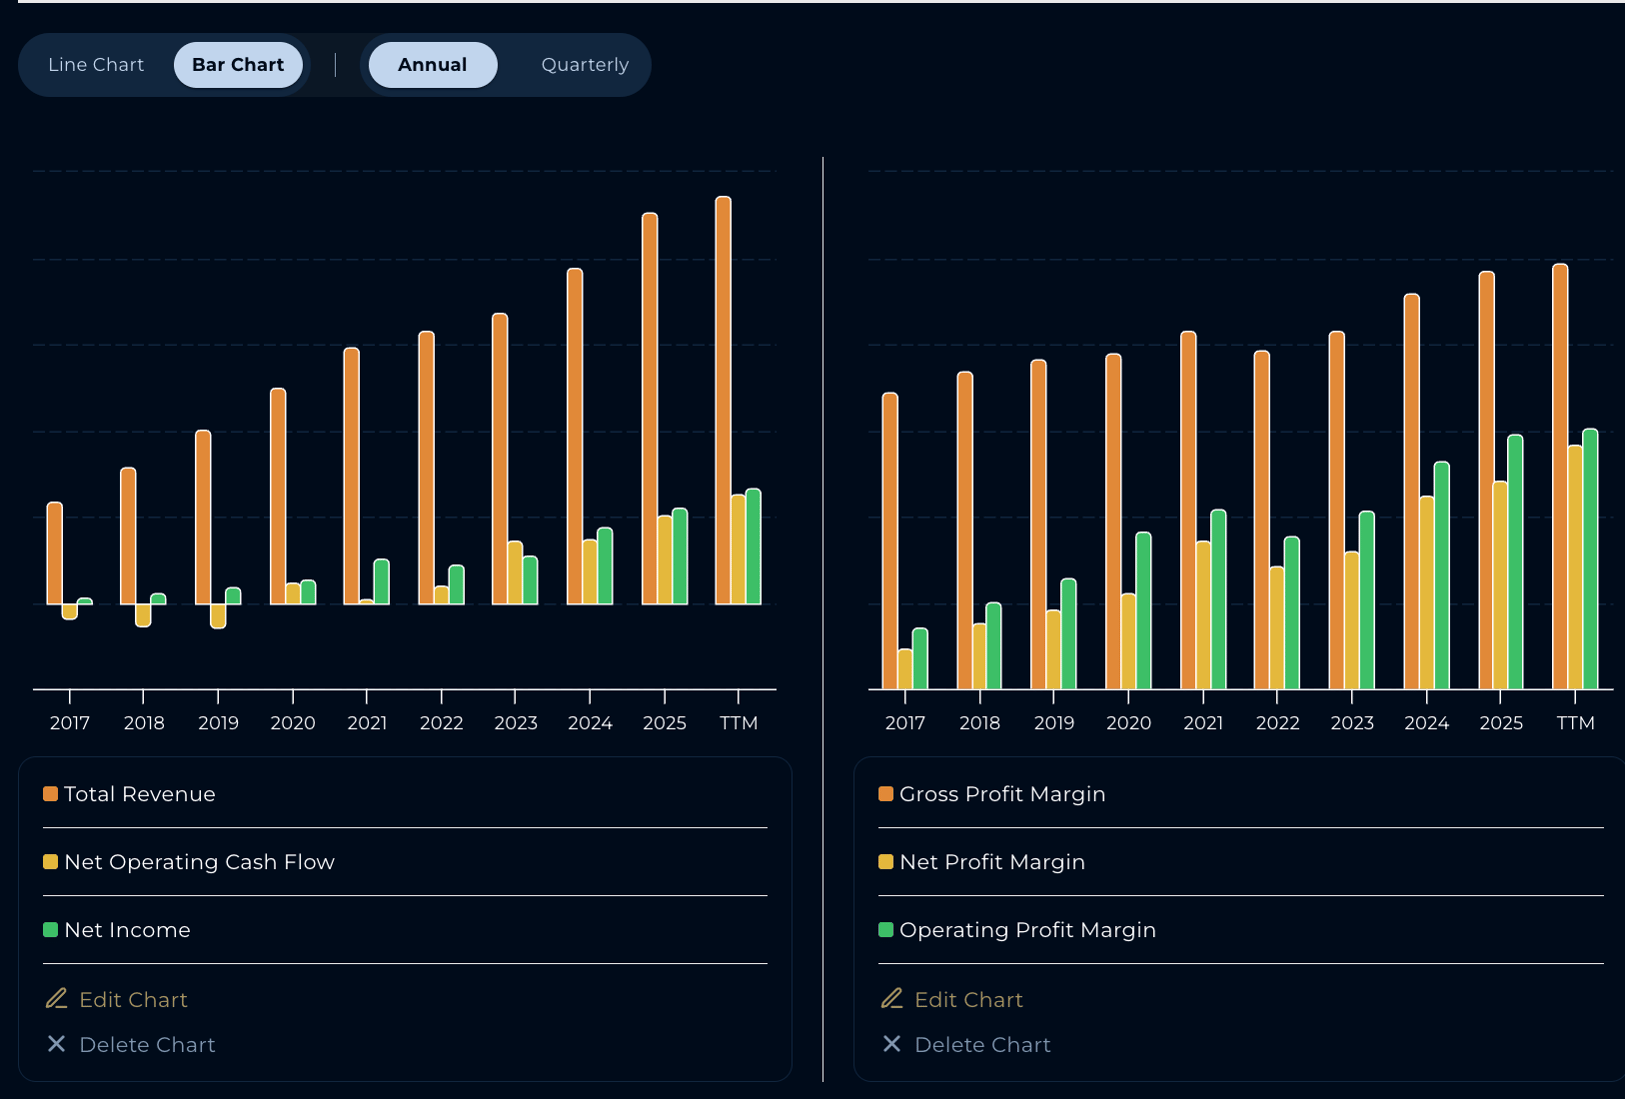
Looking at both companies' financial trend charts together, two things stand out.
Netflix's margin expansion story is very visible. The gap between what Netflix earns at the top line and what flows through to operating income is narrowing.
Disney's chart is different. Revenue is large but operating income and net income remain thin relative to that revenue base.
Managing five businesses means the consolidated margin reflects an average across very different operations: the high-margin streaming improvement is blended with the capital-intensive parks business and the declining linear segment, which suppresses what shows up at the bottom line. While deepening its moat through diversification it’s sacrificing margins in return.
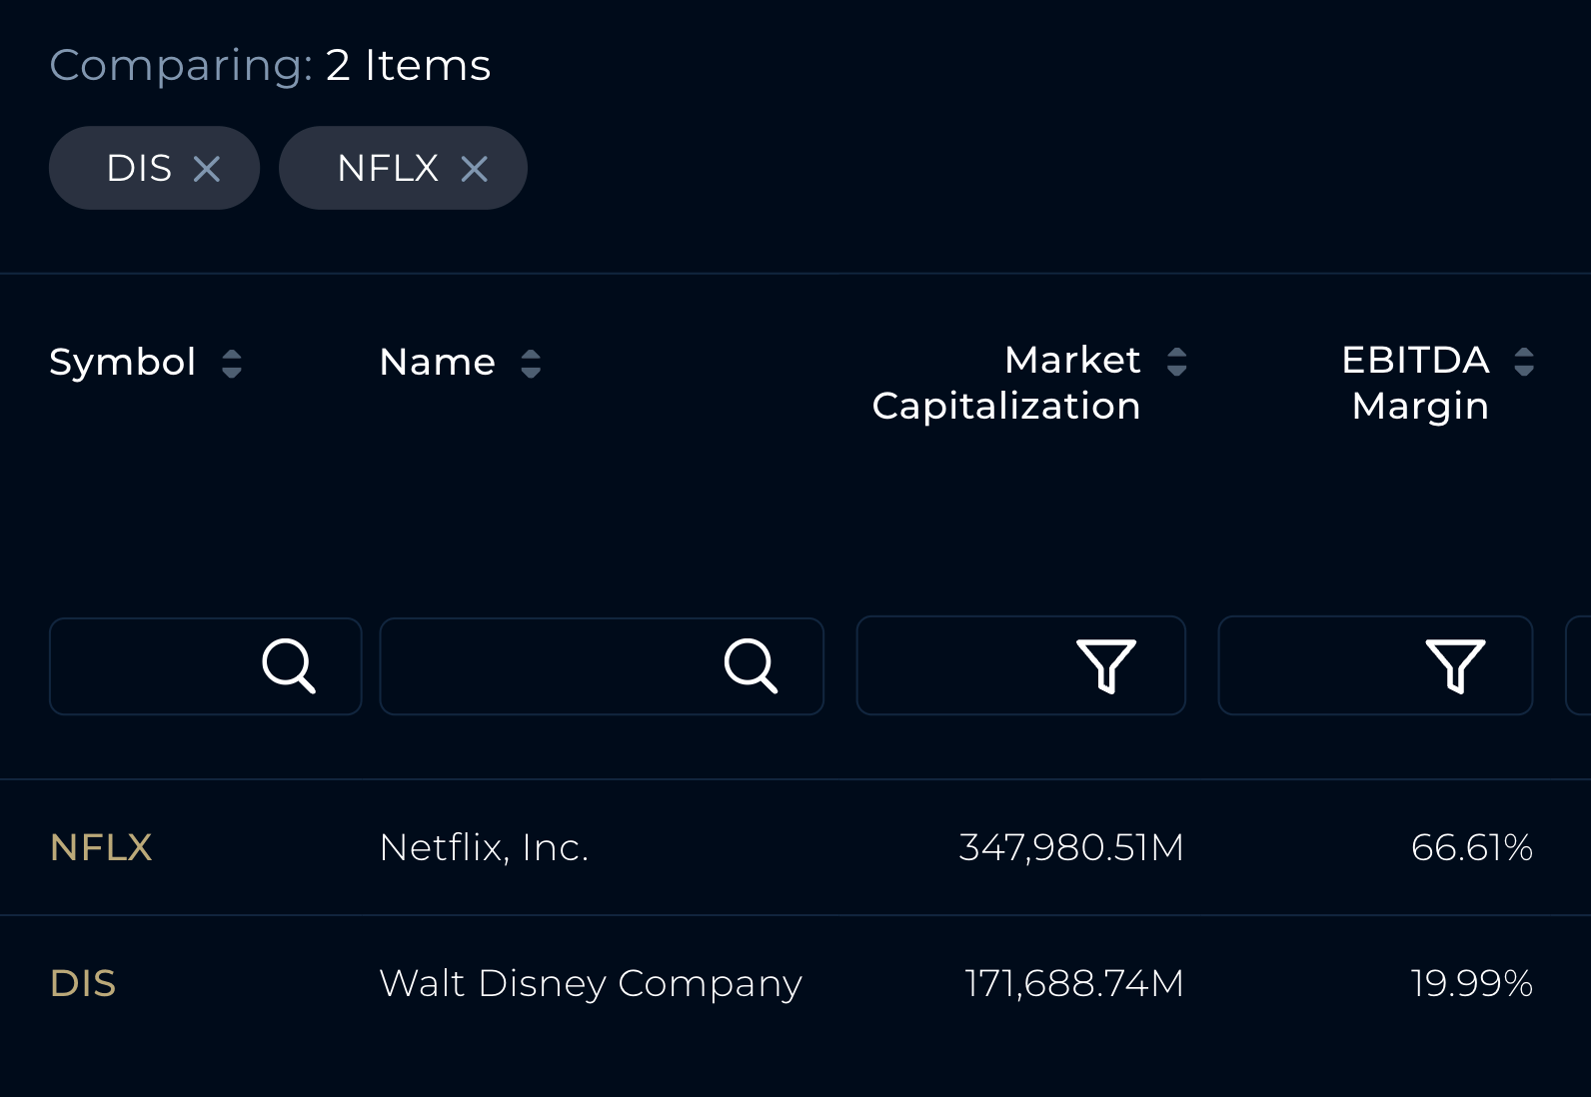
The EBITDA margin gap is particularly obvious. Netflix's 66.61% versus Disney's 19.99% is not a gap that closes just by Disney doing better.
It reflects the fundamental difference between a capital-light digital business and a conglomerate running physical attractions, broadcast networks, and streaming simultaneously.
OracleIQ™ Comparison of Disney and Netflix
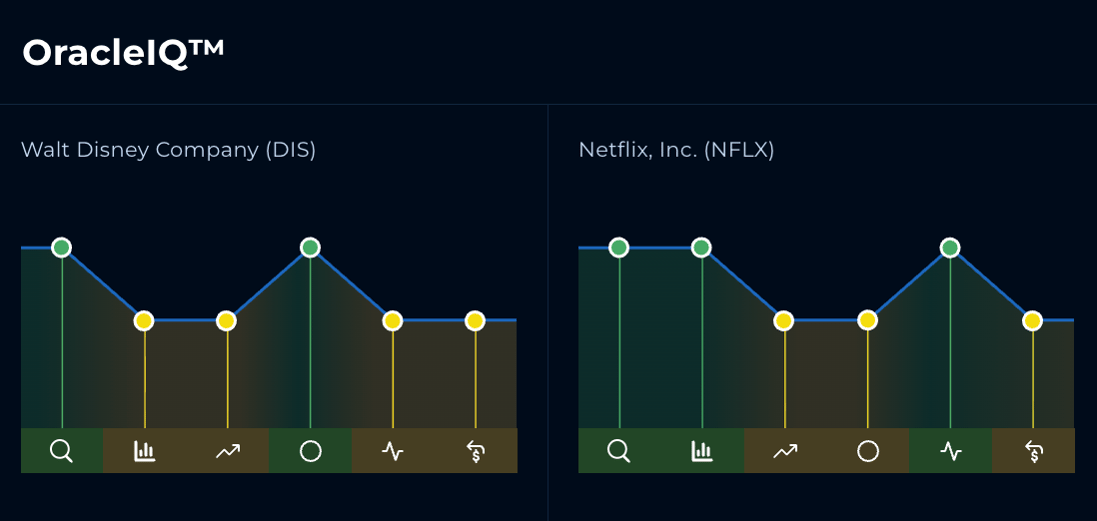
OracleIQ™ — Walt Disney Company (DIS) | Netflix, Inc. (NFLX) — Powered by StockOracle™
OracleIQ™ assesses each stock across multiple fundamental dimensions, giving investors a visual read of where each company stands.
When viewed side by side, the two charts tell a consistent story with what we've covered above.
Netflix scores higher on profitability, reflecting its expanding margins and capital-light model. Disney's profile is broader, its diversification across parks, sports, media, and streaming contributes to a wider moat, but also a more complex earnings picture that OracleIQ™ captures across multiple dimensions simultaneously.
It's a useful first filter. The shape of each chart reflects the shape of each business.

How is Disney and Netflix Stock Priced Right Now?
Valuation is never an exact science. What a financial model produces is an estimated value. One set of possible outcomes given a specific set of assumptions about future growth, margins, and discount rates. Those assumptions can be wrong. Markets can reprice for reasons that have nothing to do with fundamentals.
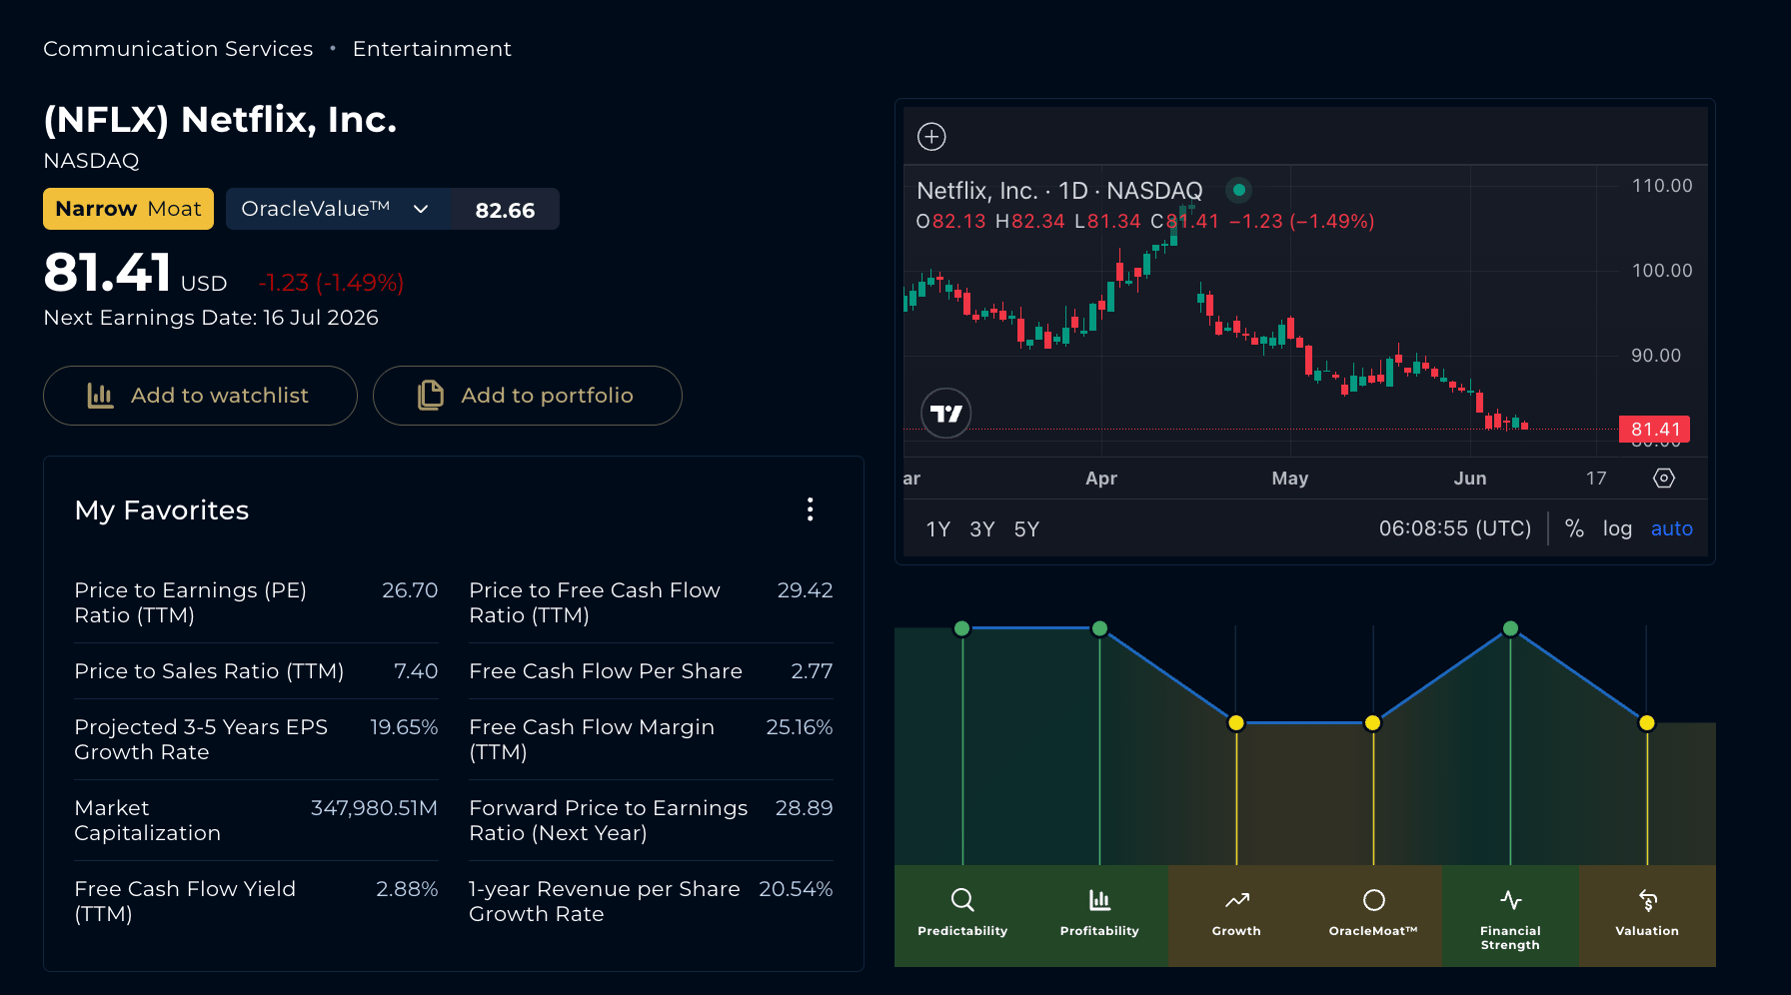
Netflix, Inc. (NFLX) first load dashboard — Powered by StockOracle™ 10th June 2026
Netflix trades at approximately 26–27x PE as of mid-2026. With OracleValue™ estimating at $82.66/share. The market is basically estimating that Netflix's earnings power will continue to expand materially.
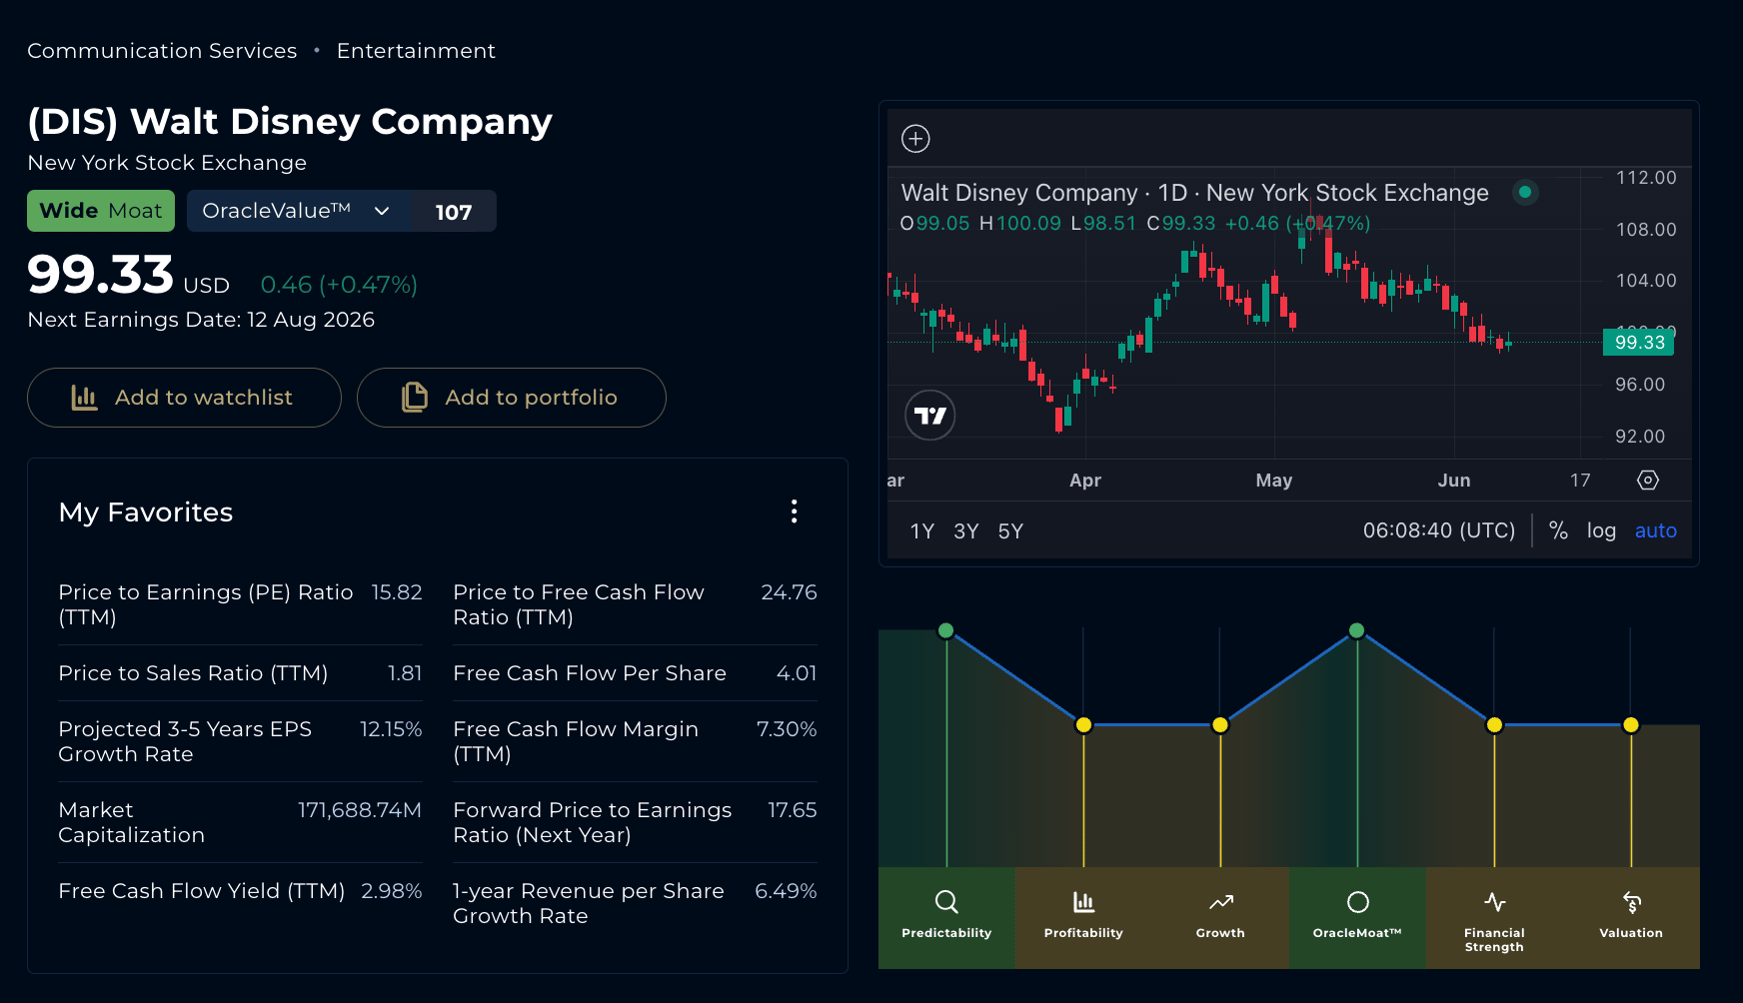
Walt Disney Company (DIS) first load dashboard — Powered by StockOracle™ 10th June 2026
Disney trades at approximately 15–16x PE ratio. With OracleValue™ estimating it at $107/share.
At that level, the stock could be interpreted as a potential value opportunity for patient investors who believe the streaming profitability ramp continues, parks hold their record margins, and ESPN DTC finds its footing.
But a lower multiple can also reflect legitimate uncertainty.
Disney is managing four concurrent transitions simultaneously. Streaming, ESPN, management changes, and parks to global expansion. Each of those transitions carries execution risk.
All estimates above are based on current consensus data and analyst projections. They are not predictions of future performance, and actual outcomes will depend on execution, macroeconomic conditions, competitive dynamics, and factors no model fully anticipates.
Two Different Investment Profiles
Netflix tends to attract investors focused on compounding earnings and margin expansion in a capital-light model.
It offers no dividend, its buyback programme is modest, and its stock carries a beta of approximately 1.7, basically it’s more volatile than the broader market.
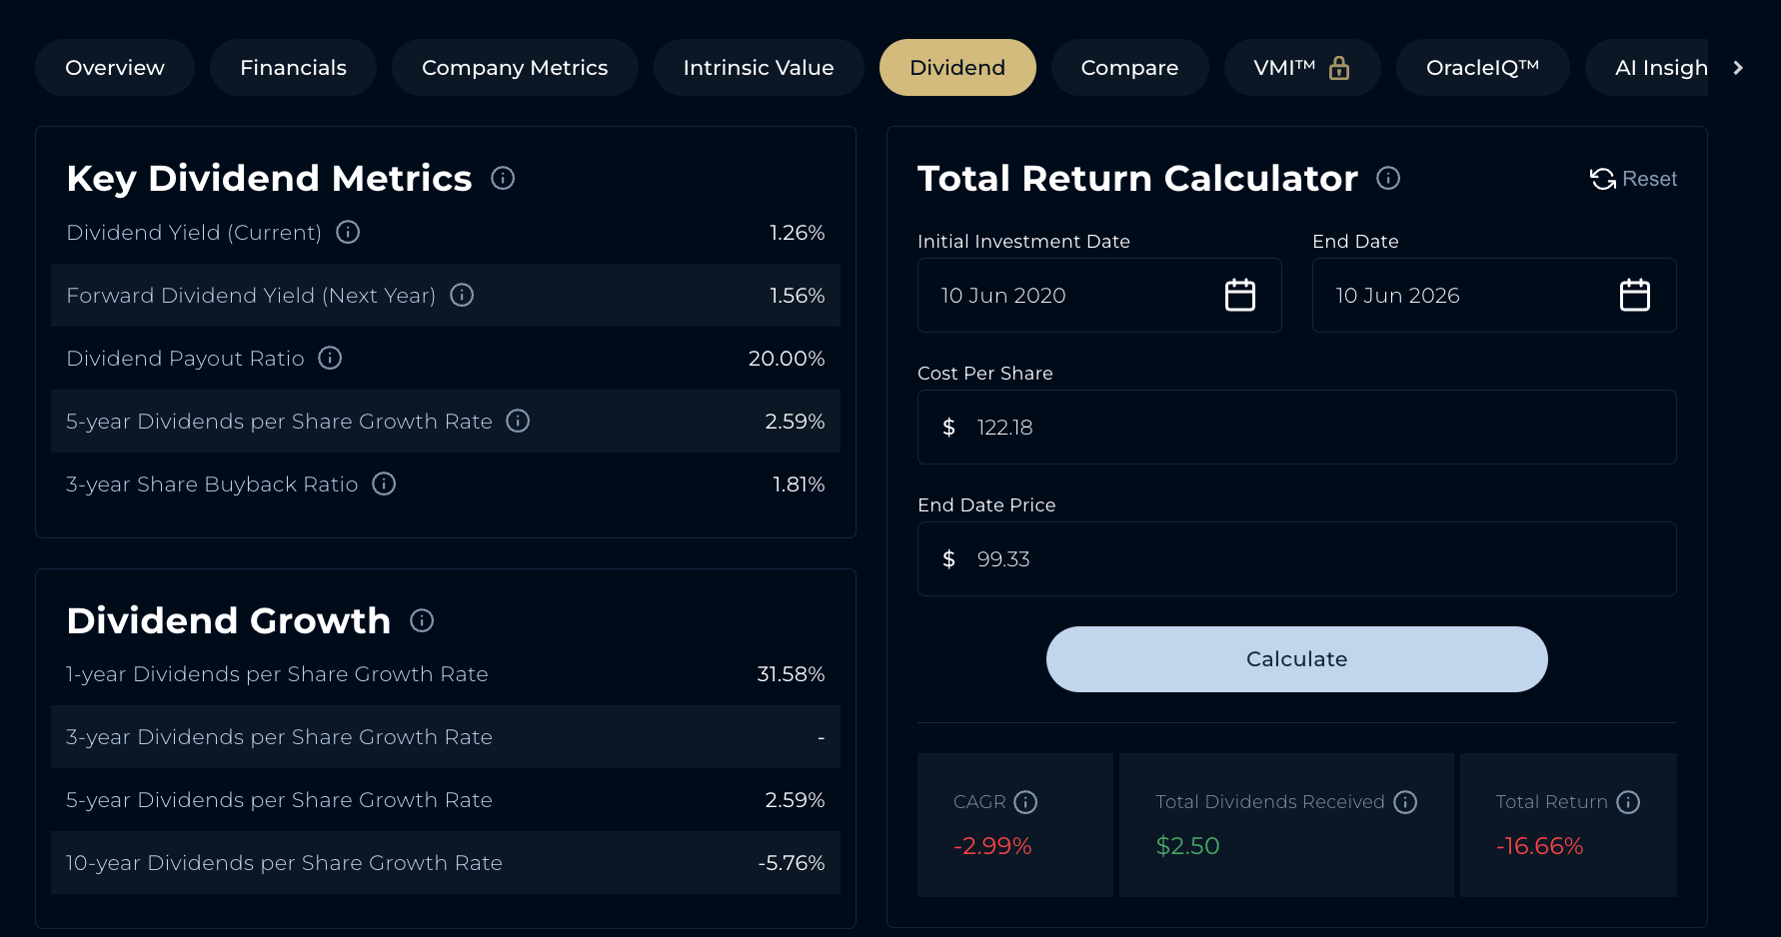
Walt Disney Company (DIS) dividend calculator — Powered by StockOracle™ 10th June 2026
Disney tends to appeal to investors who value diversification across revenue streams, a physical-asset backstop in the Experiences business, and shareholder returns via dividend and buybacks.
Disney reinstated its dividend at $1.50 annually in fiscal 2026, structured as two $0.75 semi-annual payments, and raised its buyback target.
The risk profile is different, lower beta, lower growth rate, But a balance sheet that carries approximately $41 billion in net debt and significant capital expenditure commitments.
Neither profile is universally superior. They represent different bets on different business models at different stages of their evolution.
Final Thoughts
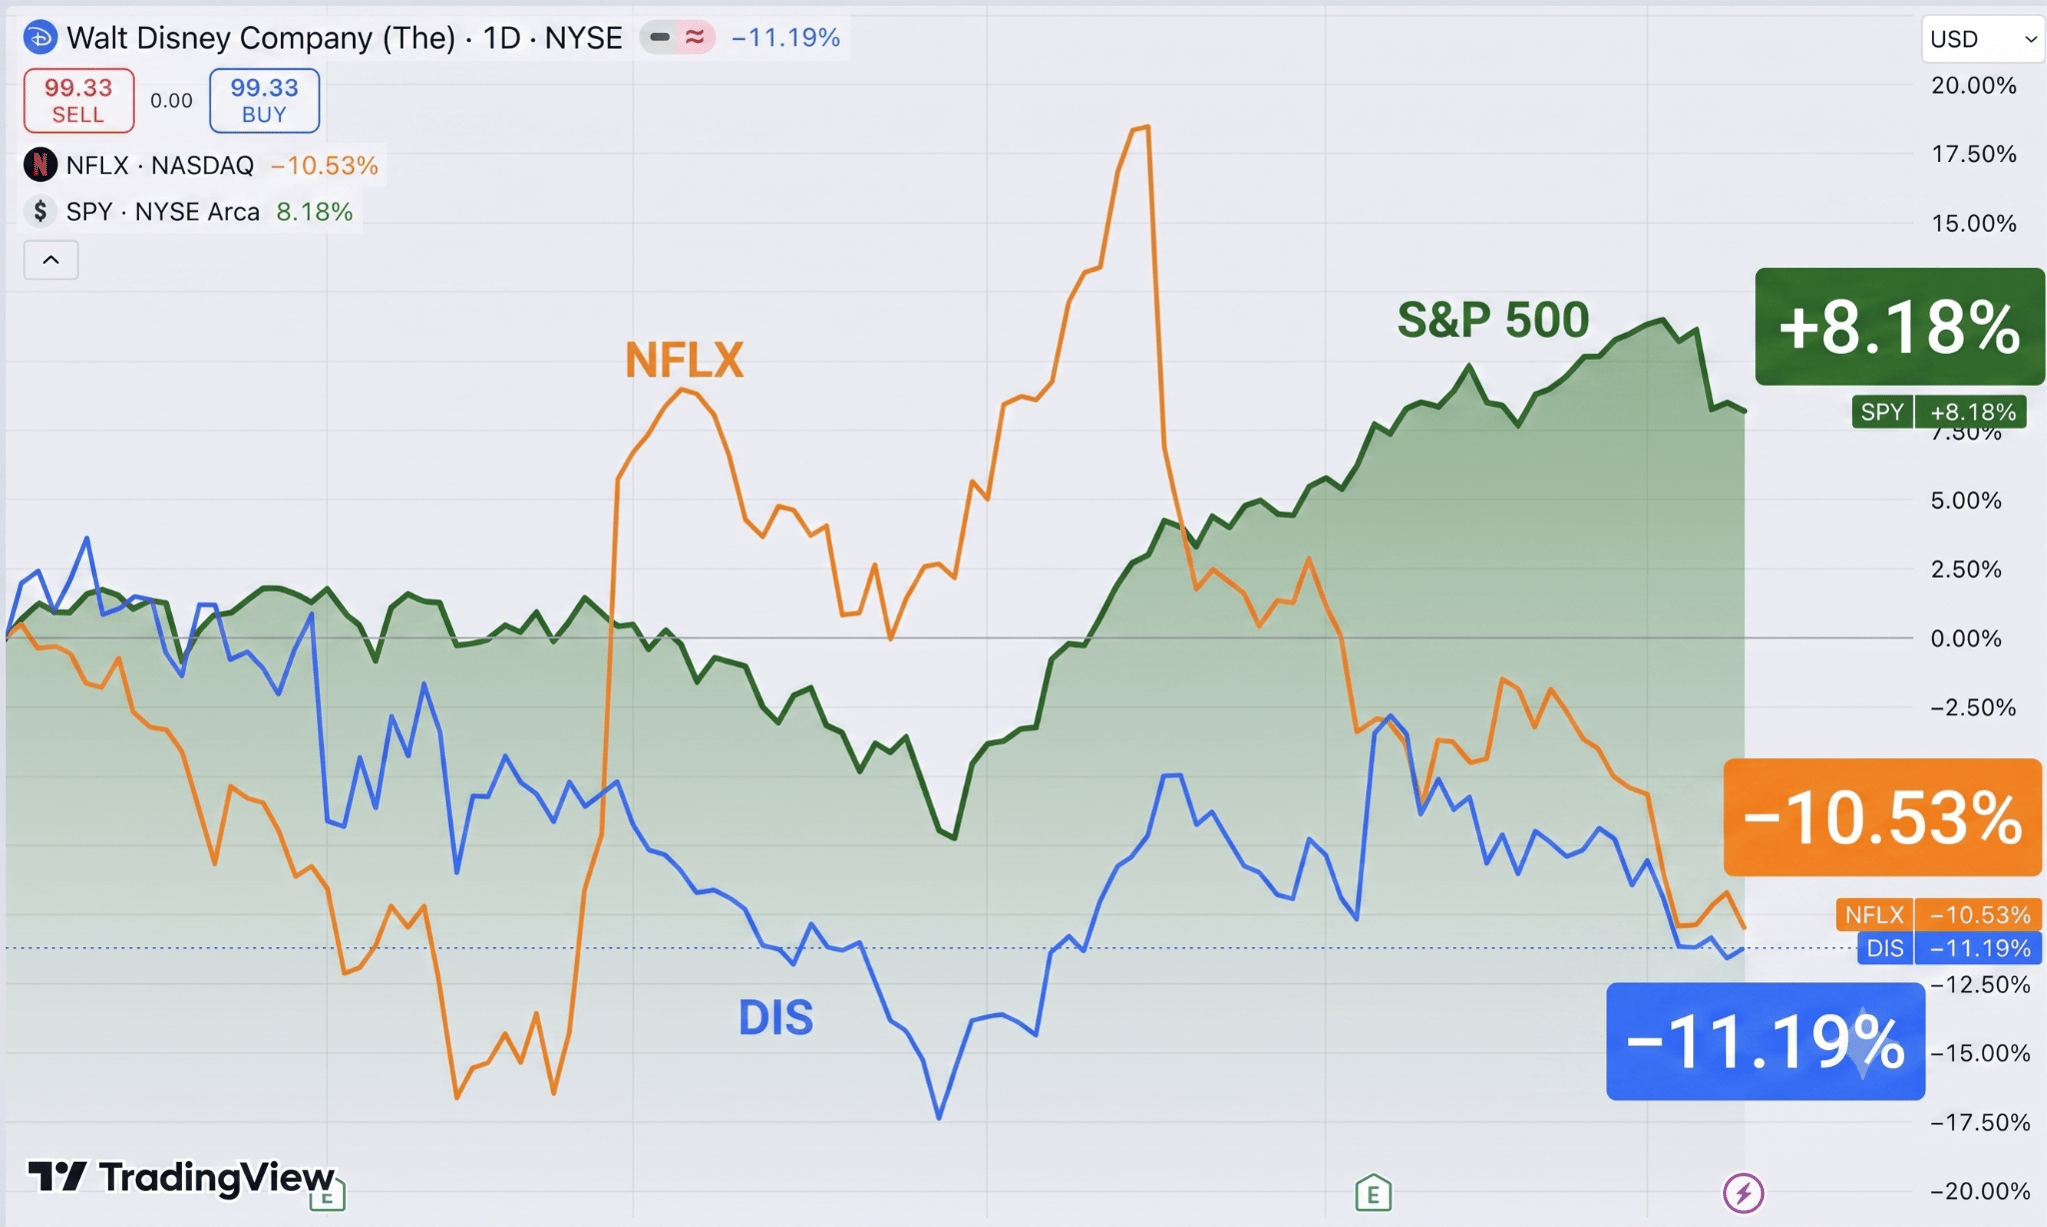
Looking at stock performance, both stocks have lagged the S&P 500 YTD. When the broader market outpaces two of entertainment's possibly biggest names, it might suggest that investors are still looking for proof or simply chasing other shiny objects like AI stories.
Related

Almost nobody argues Walmart is a bad business anymore, Wall Street rates it a Buy and hands it a ...

Every AI story eventually runs into the same question: who secures all of it? As enterprises pour ...

Nike will report earnings on 30 June 2026 and the stock has been a long way down from where it ...