Procter & Gamble spent June 2025 announcing 7,000 job cuts and a portfolio-wide brand pruning, then flagged an $0.56-per-share headwind from tariffs, commodities, and freight on its latest earnings call. Yet the same company just posted its first weighted U.S. market-share gain in months, clawing back roughly 25 basis points through disciplined pricing. A 189-year-old consumer giant restructuring and regaining share at the same time raises an important question: which number the market should be paying for?
What Does Procter & Gamble Actually Do?
Procter & Gamble manufactures and markets branded consumer packaged goods across five segments: Beauty, Grooming, Health Care, Fabric & Home Care, and Baby, Feminine & Family Care. Its brands include Tide, Pampers, Gillette, and Olay, sold through mass retail, e-commerce, and professional channels in over 180 countries.
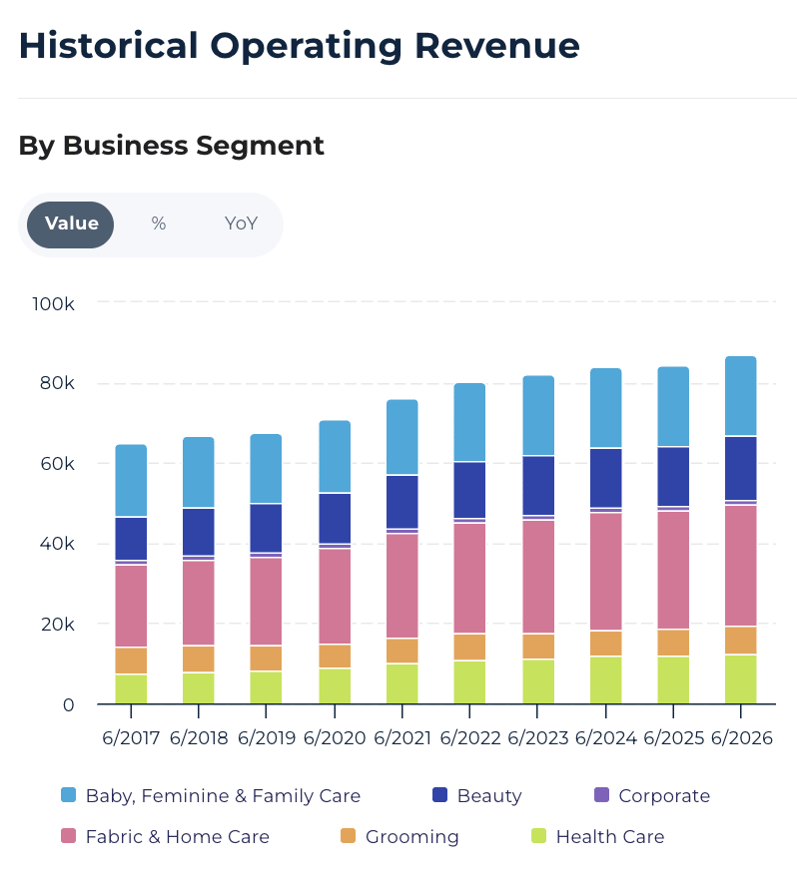
Manufacturing and advertising scale, not any single hit product, has kept its margins ahead of most packaged-goods peers.
What Is Procter & Gamble's Intrinsic Value?
Intrinsic value is what a business is worth based on the cash it can realistically generate over time, not what the market pays for it on a given day. When price sits above that estimate, growth that hasn't shown up yet has to justify the premium. Procter & Gamble's current setup pulls in both directions, depending on which valuation lens is used.
Procter & Gamble's Fair Value: A Split Between the Cash Story and the Brand Story
A 20-year discounted cash flow model puts Procter & Gamble's fair value at $108.22 per share, well below the current $144.68 price. The discounted free cash flow variant reads even lower, at $81.57, roughly matched by the discounted net income method at $87.00. All three cash-flow-based methods sit under today's price.
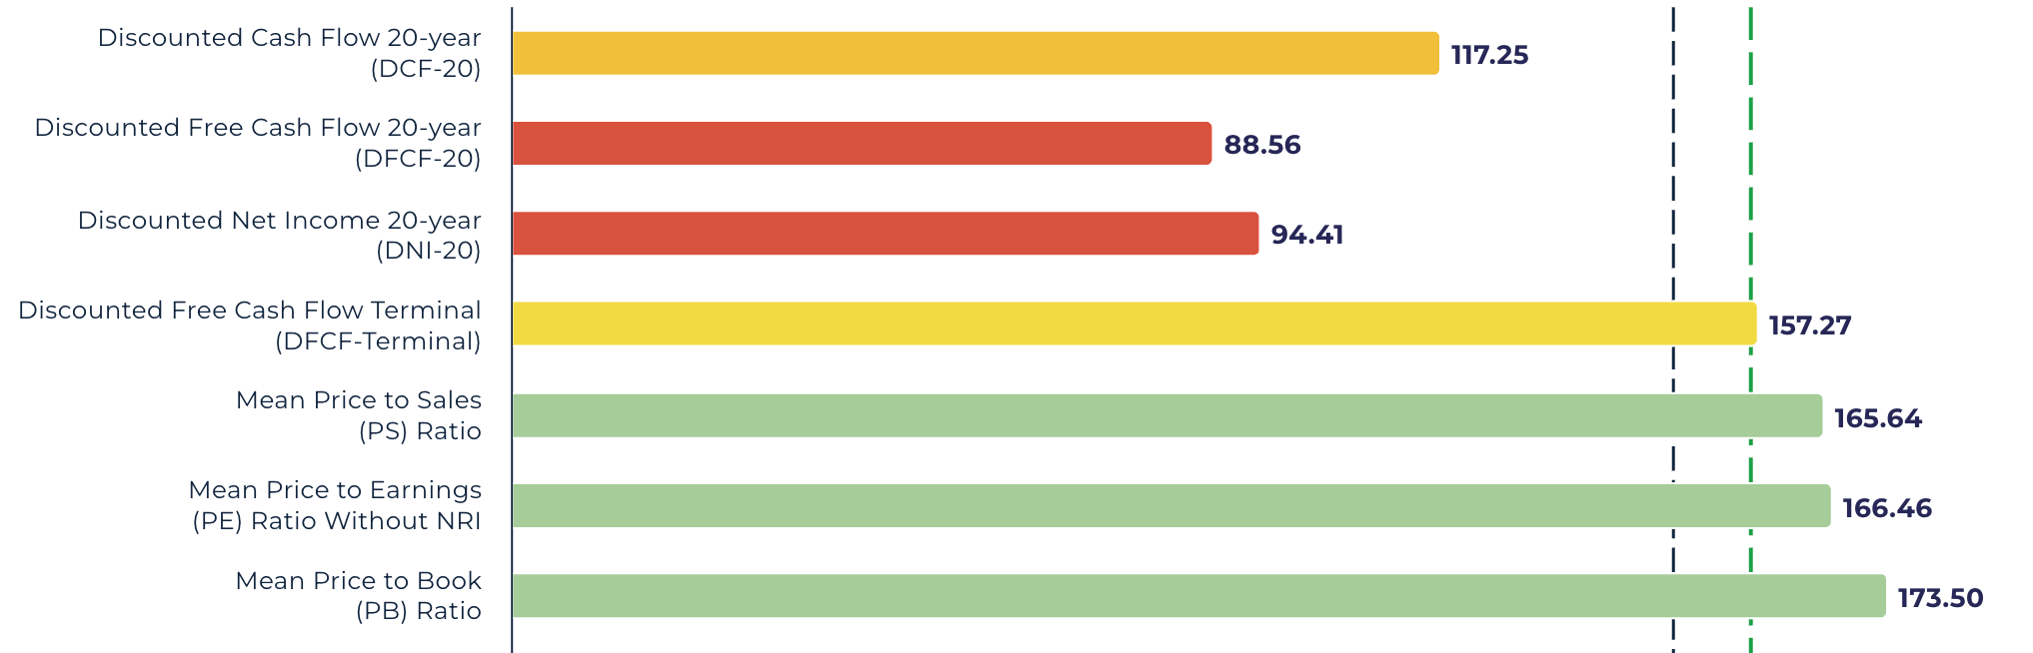
Procter & Gamble (PG) Valuation Chart — Model Breakdown — Powered by StockOracle™ · Accurate as of 22 August 2026
The split traces to one input: the near-term growth rate feeding the cash-flow models is a projected 1.36% for Years 1 through 5, cooling to 5.70% in Years 6 through 10. Compounding from a low starting growth rate for five years will always undershoot a multiples-based read built on Procter & Gamble's earnings power and 30%-plus return on equity. Whether that growth assumption or the market's historical earnings multiple is the more honest anchor is what investors need to address next.
Procter & Gamble (PG) Financial Performance
Revenue: Flat Organic Growth, Real Share Gains Underneath
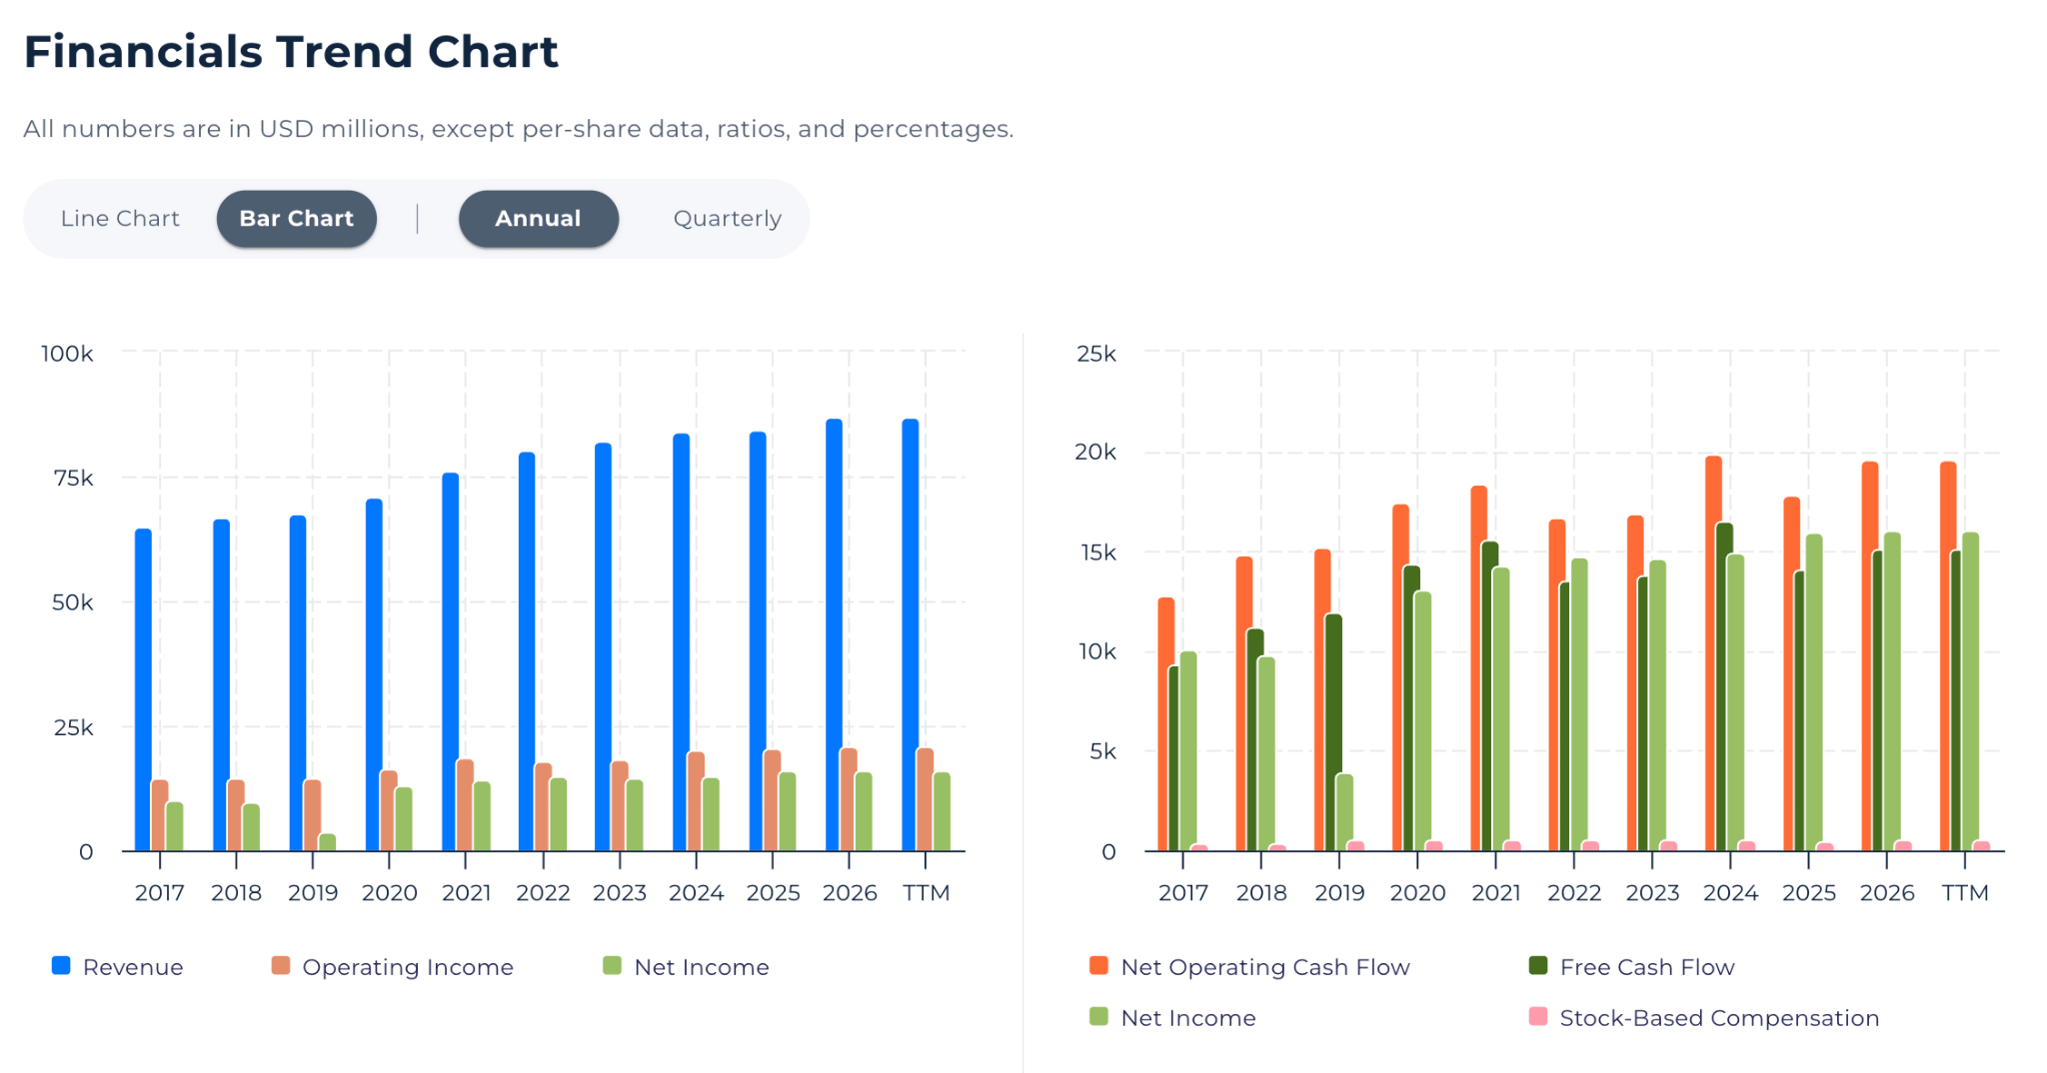
Procter & Gamble (PG) Revenue, Operating Income and Net Income Trend — Powered by StockOracle™
Fiscal 2026 net sales reached $87.0 billion, up 3% year-over-year, though organic sales grew just 1% and fourth-quarter organic growth was flat. Procter & Gamble's fourth-quarter and full-year fiscal 2026 results show diluted EPS of $6.62, up 2% for the year, while core operating margin compressed 70 basis points on tariff and commodity pressure flagged for fiscal 2027.
Beneath that, Beauty and Fabric Care both posted positive volume growth. The company's weighted U.S. market share turned positive quarter-to-date through early August, evidence that calibrated pricing is holding shelf space rather than trading it away for volume.
New Chairman and CEO Shailesh Jejurikar has framed fiscal 2026 as "a year of foundation building." Fiscal 2027 guidance calls for 1 to 3% sales growth against a stated $0.56 per share headwind from higher raw material, energy, and transport costs, plus $150 million in added interest expense. That built-in caution helps explain the market's negative reaction to the print even as the underlying share trend improved.

Free Cash Flow: The Line the Cash-Flow Models Actually Trust
Free cash flow is the cash that moves through the business after bills are paid. Procter & Gamble generated $15.1 billion in free cash flow in fiscal 2026, up from $14.0 billion a year earlier, a margin of 17.40% on $87.0 billion in revenue. That's healthy, but the near-term growth assumption layered on this cash base, not the cash generation itself, pulls the DCF-based estimates below today's price.
Returns on Capital: The Real Evidence Behind the Earnings Premium
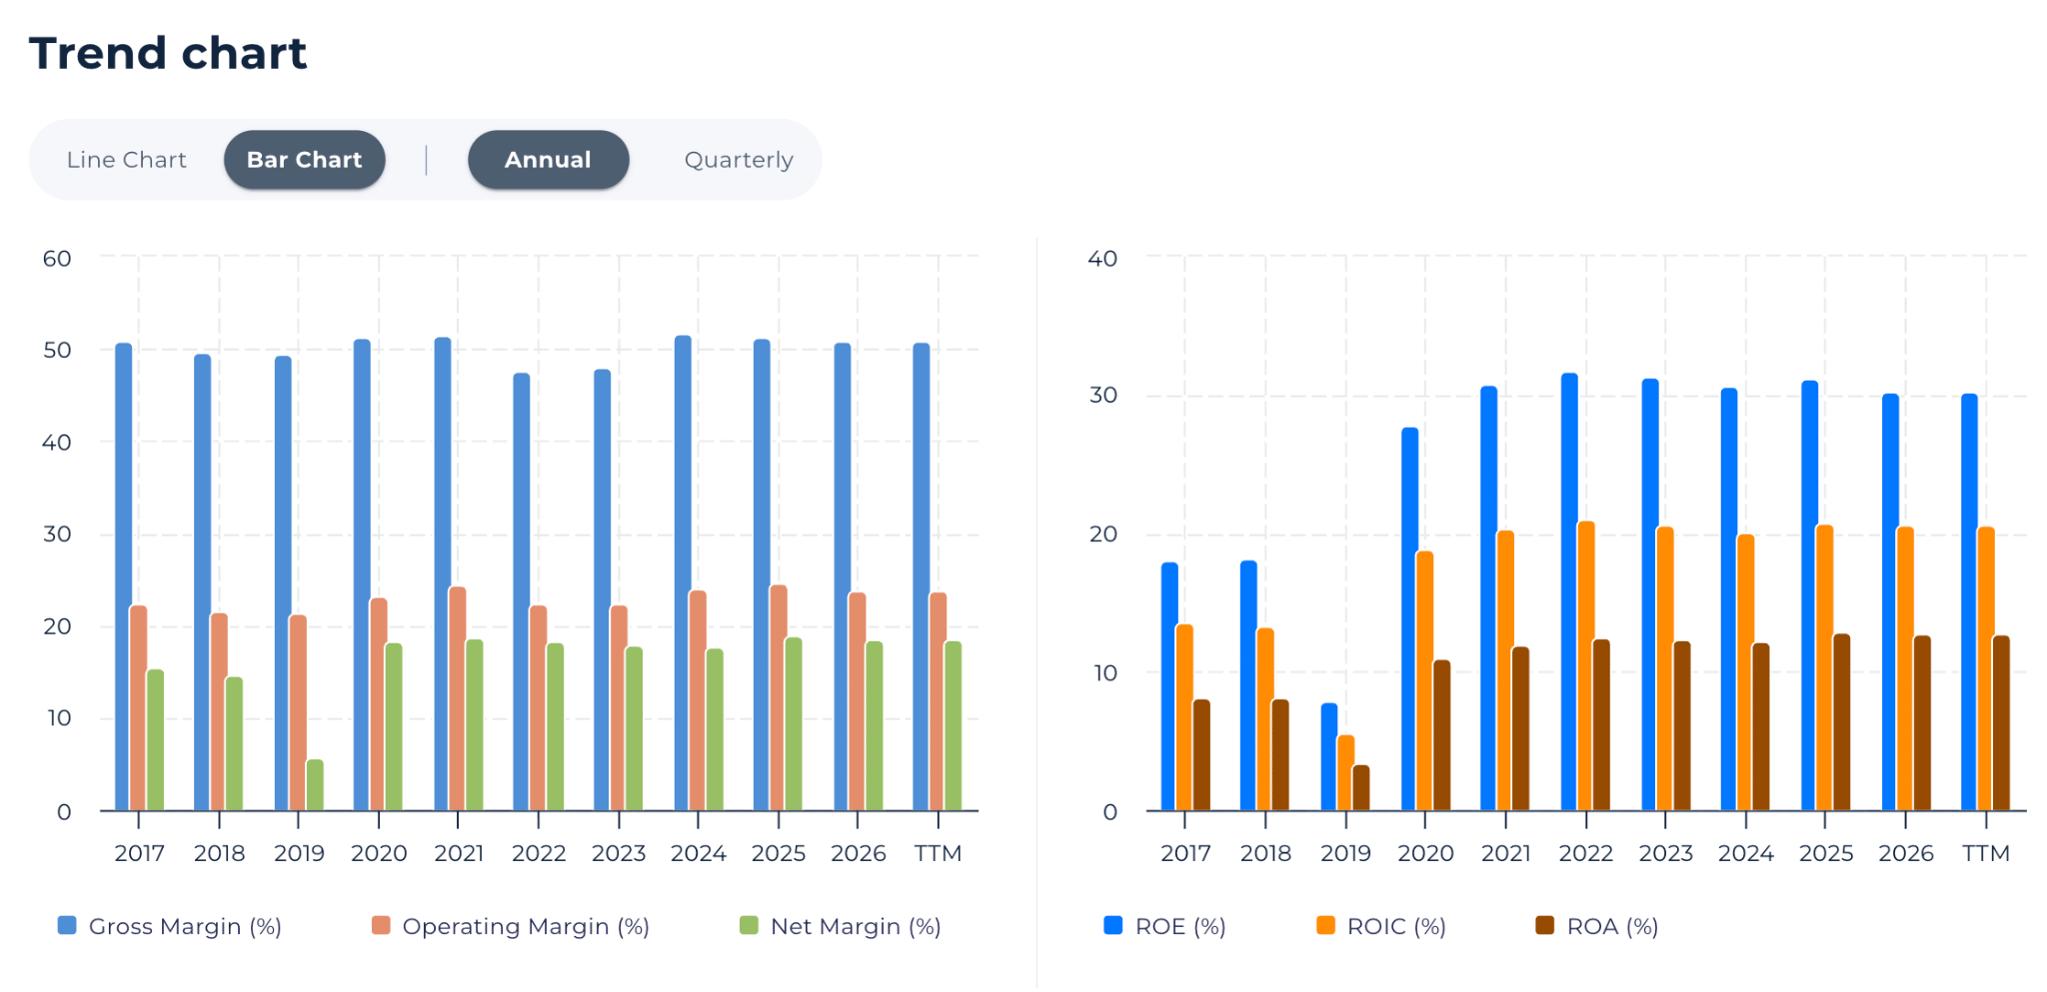
Procter & Gamble (PG) Margins and Returns Trend — Powered by StockOracle™
Few large-cap consumer businesses can sustain capital efficiency at Procter & Gamble's level. Return on equity (TTM) reads 30.25%, close to its five-year average of 31.05%, with return on invested capital at 20.67%.
That efficiency is evidence behind the premium earnings and book-value multiples the market keeps assigning the stock, independent of how any single quarter's organic growth number prints.
Shareholder Returns: Dividends Lead, Buybacks Support
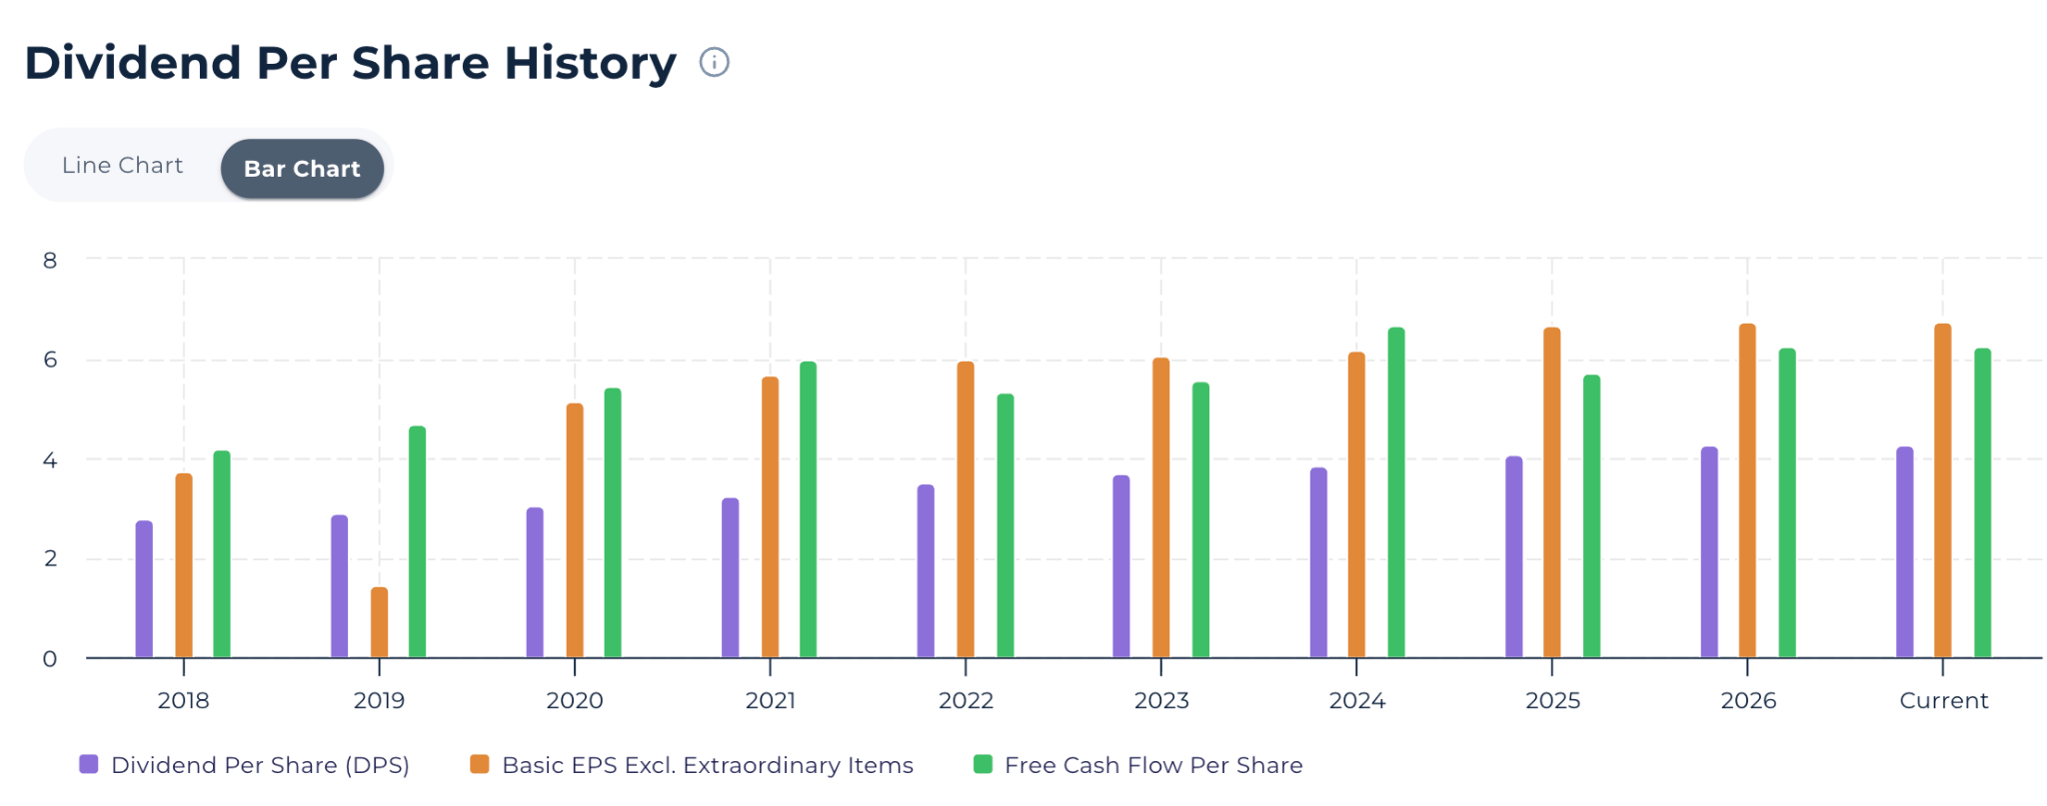
Procter & Gamble's dividend yield sits at 2.93%, backed by a payout ratio of roughly 64%, extending one of the longest dividend growth streaks among large-cap stocks. It also repurchased about $5.0 billion of stock in fiscal 2026 on top of $10.2 billion in dividends paid, funded out of the $15.1 billion free cash flow base without touching the balance sheet.
Growth Catalysts
What Has to Keep Working for P&G
- The restructuring program targets roughly 7,000 job cuts, about 15% of the non-manufacturing workforce, and unspecified brand divestitures, with total restructuring costs of $1.0 to $1.6 billion through fiscal 2027.
- Weighted U.S. market share turned positive quarter-to-date through early August 2026, signaling that calibrated pricing and promotion, not discounting, is protecting shelf space in Fabric Care, Home Care, and personal care.
- Beauty and Fabric Care volume growth offset declines in Healthcare, Baby Care, Grooming, and Family Care this fiscal year, evidence the growth story is uneven across the portfolio rather than broadly accelerating.
- Fiscal 2027 core EPS guidance of $6.89 to $7.11 already assumes the tariff and commodity headwind persists, so any relief would flow straight through to the upside.
Why it matters for valuation: the multiples-based fair-value figures assume Procter & Gamble's earnings power and returns stay near current levels. A restructuring program that restores organic growth toward its historical mid-single-digit pace would make a low growth assumption look overly conservative. One that mostly cuts costs without reigniting volume would leave the cash-flow-based figures as the more appropriate anchor.
Economic Moat: Why StockOracle™ Rates Procter & Gamble a Wide Moat
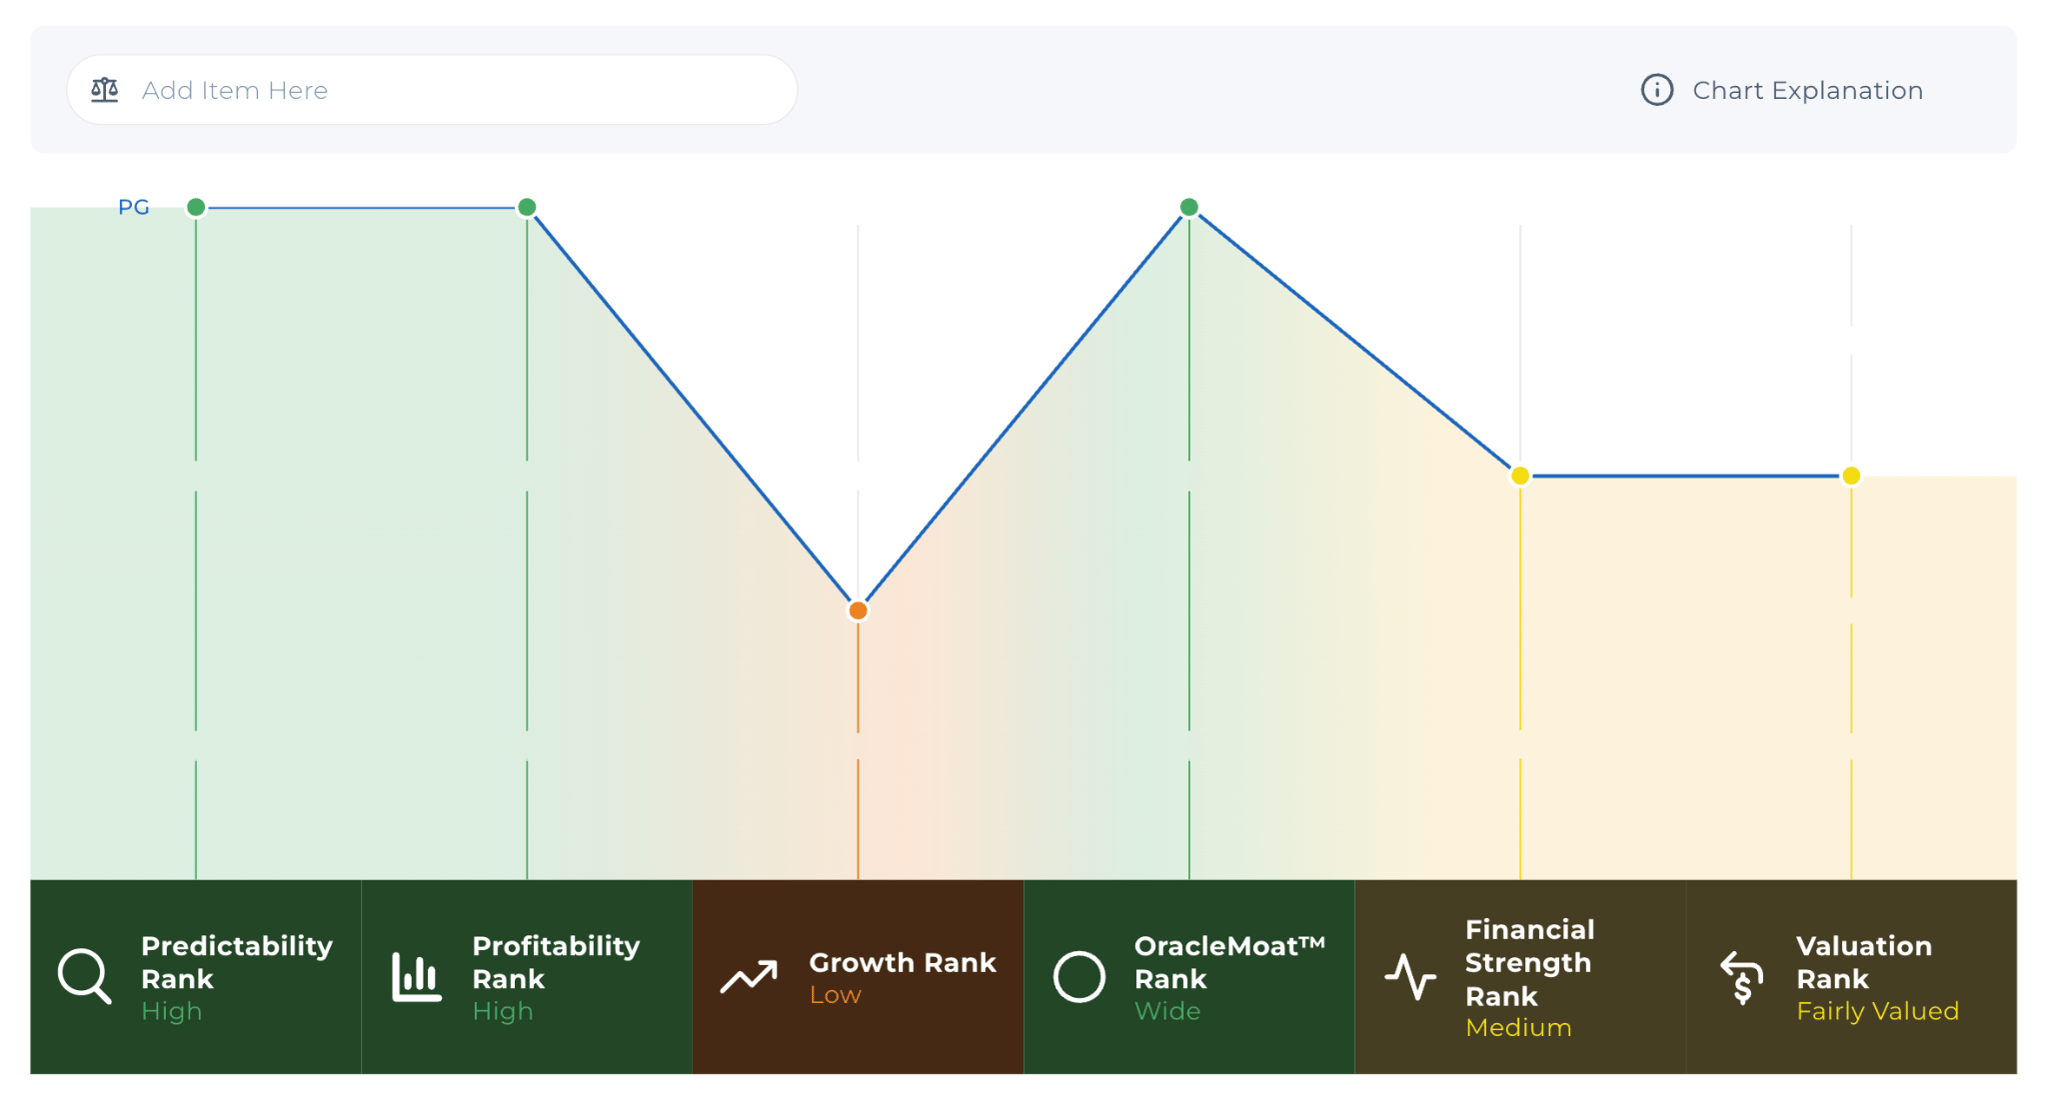
StockOracle™ rates Procter & Gamble a Wide Moat business, built on brand recognition earned over a century, retail-shelf relationships that took decades to establish, and manufacturing scale that lets it out-advertise and out-distribute smaller rivals category by category.
Procter & Gamble must defend against a competitive set with different advantages and not simply outspend it.
Unilever brings a comparably global distribution footprint and a portfolio skewed toward emerging markets where P&G is thinner.
Kimberly-Clark competes directly in tissue, diapers, and personal care with century-old brand equity in Huggies and Kleenex.
Colgate-Palmolive holds a stronger position in oral care and international detergent markets in Latin America and Asia.
Run a OracleIQ™ comparison study with StockOracle™ here.
A More Conservative Look at Procter & Gamble's Fair Value
The $108.22 DCF-20 figure sits below Procter & Gamble's current price, built on a low near term growth trajectory. Set that assumption up toward the company's fiscal 2027 guidance range of 1 to 3% sales growth, and the cash-flow-based figures move higher, though still short of the $165 to $174 range the multiples-based methods produce. Two decades of compounding from a slow start has limits.
Now turn it around: What has to hold for the multiples-based read to be fairer? The restructuring program needs to translate into actual organic growth acceleration, not just cost cuts. The market-share gains seen through early August need to persist rather than reverse once competitors respond. Readers can run their own growth assumptions through StockOracle's free DCF calculator.
Final Thoughts on Procter & Gamble's Intrinsic Value
- Fiscal 2026 net sales grew 3% to $87.0 billion, but organic growth of just 1% and a flat fourth quarter show the top line is closer to stalled than accelerating..
- Free cash flow of $15.1 billion and a 17.40% FCF margin are relatively good numbers, but they aren't the reason for the valuation gap; the growth assumption tends to affect the model more so than the current free cash flow.
- A restructuring program cutting jobs and pruning the brand portfolio is running alongside the first positive U.S. market-share reading in months, a tension between cutting costs and gaining share.
- Return on equity of 30.25% and return on invested capital of 20.67% are sustained evidence behind the premium earnings and book-value multiples the market keeps assigning the stock.
- The wide-moat rating rests on brand, shelf relationships, and manufacturing scale that no single competitor replicates across as many categories at once.
The open question is whether a restructuring plan built on cost discipline can also reignite the organic growth the cash-flow models are pricing out, or whether the market-share gains seen through early August are a pricing-cycle blip rather than the start of something durable.
This analysis is shared for educational purposes only and is not intended as financial advice or a recommendation to buy, sell, or hold any security. The valuation figures above are model outputs built on stated, adjustable assumptions, not a fixed or guaranteed price target, and should not be treated as a standalone signal. Past performance, including any figures referenced above, is historical and is not indicative of future results.