JPMorgan just posted the best quarter in its history and Jamie Dimon used the earnings call to warn it might not get any better. "It's getting close to as good as it gets," he told analysts, comparing today's market exuberance to the run-ups before 1972, 1986, 2000, and 2007.

When the person cashing the record check is the one sounding the alarm, the intrinsic value question stops being academic.
What Is JPMorgan's Intrinsic Value?
Intrinsic value is what a business is actually worth based on the cash flows and earnings power it can sustain over time, not what the market happens to pay for it today. But for a bank, that question doesn't get answered the same way it does for a software company or a retailer.
JPMorgan doesn't sell a product for more than it costs to make. It lends money, takes deposits, and trades on its own balance sheet which changes which numbers actually matter.
JPMorgan's Intrinsic Value: What the Model Says
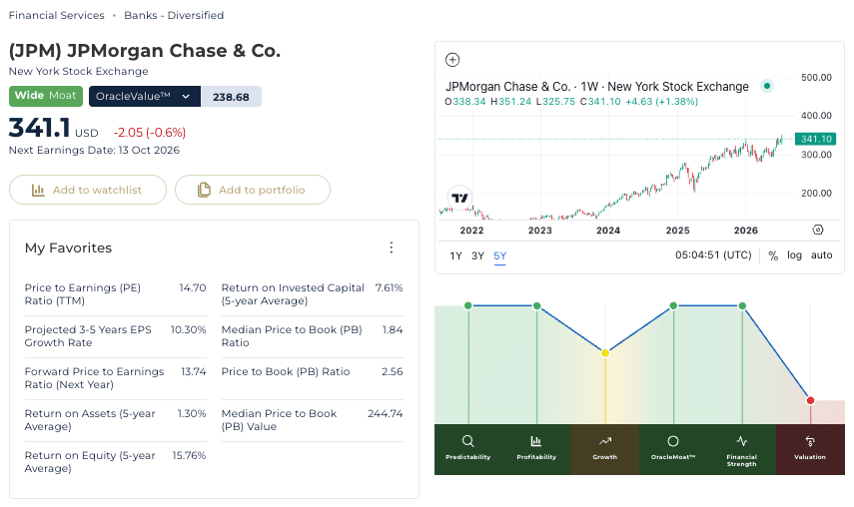
JPM Price & OracleValue™ Overview — Powered by StockOracle™ Accurate as of 20 July 2026
Using its proprietary model, StockOracle™ estimates JPMorgan's intrinsic value at $238.68 per share.
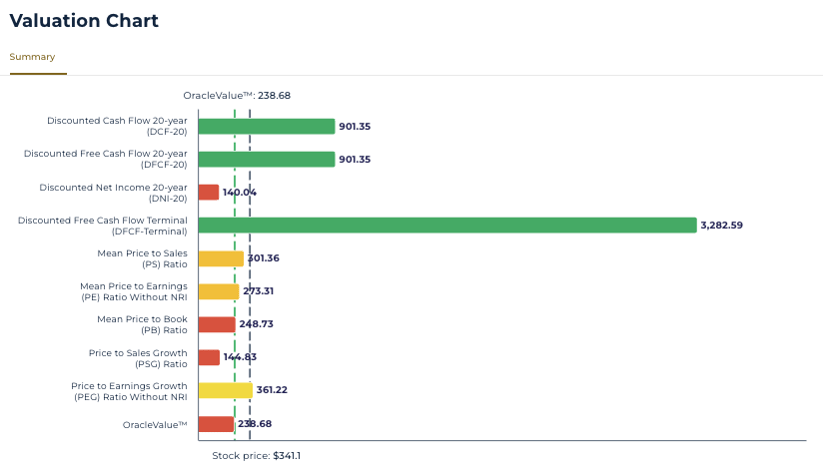
Valuation Chart — Model Breakdown — Powered by StockOracle™ Accurate as of 20 July 2026
Look closer at how most valuation figures get built and the cracks show immediately. The 20-year discounted cash flow and discounted free cash flow methods land north of $900 per share, and the terminal free cash flow variant blows out to over $3,280 per share. Numbers so far apart from reality that they tell you something important on their own: cash-flow-based models built for asset-light businesses don't translate to a bank's balance sheet.
A bank's "cash flow" is tangled up with deposit inflows, loan originations, and trading positions that aren't comparable to a company selling products or services.
The more useful readings sit lower down the chart, the Discounted Net Income model at $140.04 and the Mean Price-to-Book method at $248.73. Because both are working with the two things that actually describe a bank's earnings power: profit generated and capital deployed. That's why the smarter lens for a bank like JPMorgan tends to be "the bank’s price-to-book multiple justified by the return on equity behind it."
JPMorgan (JPM) Financial Performance
Revenue Mix: Where the Growth Is Actually Coming From
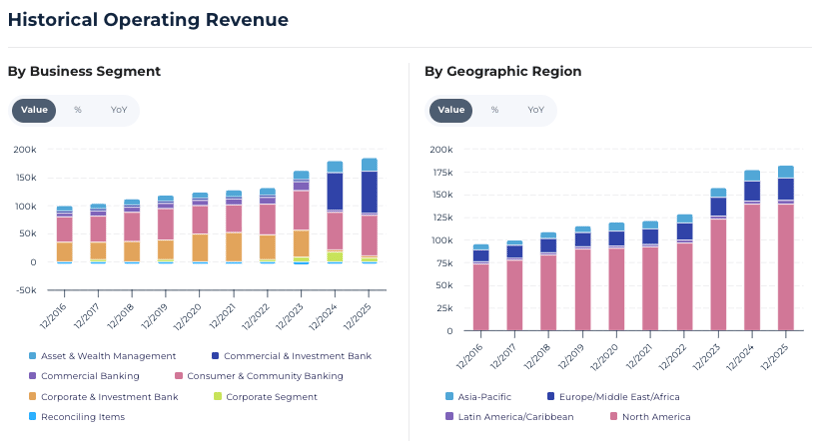
JPM Historical Operating Revenue by Segment — Powered by StockOracle™ Accurate as of 20 July 2026
Consumer & Community Banking has long been JPMorgan's largest single segment, but the shape of the last two years is the real story: the Commercial & Investment Bank segment has scaled sharply since 2024, pulling total operating revenue from roughly $90 billion in 2016 to nearly $180 billion by 2025. That's not a retail bank quietly growing its deposit base — it's a universal bank where trading, dealmaking, and market activity are increasingly doing the heavy lifting alongside the core lending business.
Returns and Valuation: The Section That Actually Decides the Debate
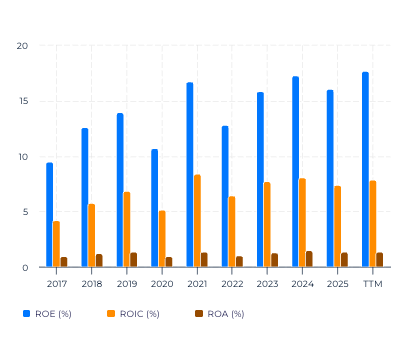
Returns Trend — Powered by StockOracle™ Accurate as of 20 July 2026
Return on equity has climbed from roughly 9.5% in 2017 to about 17.5% on a trailing basis, with return on invested capital and return on assets tracking the same upward path. That's a decade of a bank consistently extracting more profit per dollar of shareholder capital, not a one-quarter blip.
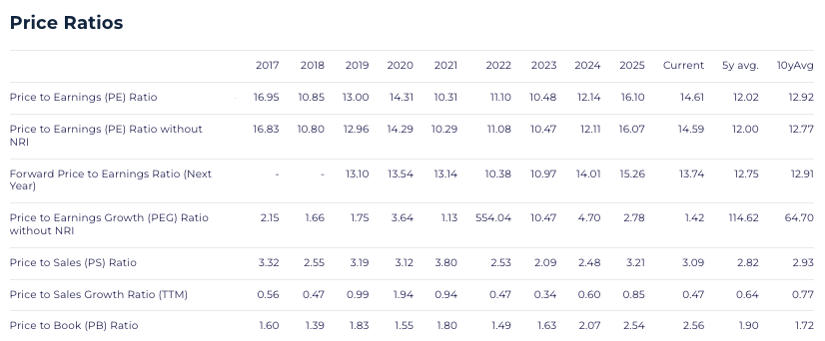
Price Ratios Table — Powered by StockOracle™ Accurate as of 20 July 2026
Here's where the valuation tension lives. JPMorgan's current price-to-book ratio sits at 2.56, well above both its 5-year average of 1.90 and its 10-year average of 1.72. A bank trading at a rising premium to book value isn't automatically overpriced, it's only justified if the returns being generated on that equity have expanded to match.
On that count, JPMorgan's ROE has genuinely re-rated higher over the same stretch, which is the closest thing to a fundamental defense the current multiple has.
Balance Sheet Scale and Credit Provisioning
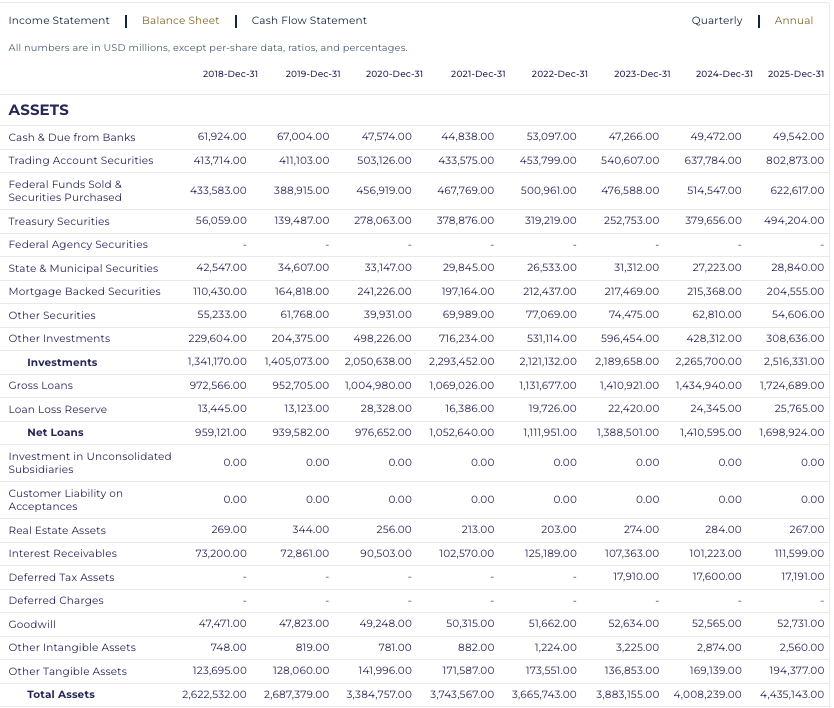
JPM Balance Sheet — Assets — Powered by StockOracle™ Accurate as of 20 July 2026
Total assets have grown from $2.62 trillion in 2018 to $4.44 trillion by 2025 a bank that has effectively added the balance sheet of another large regional lender on top of what it already had.
Loan loss reserves have grown alongside it, from $13.4 billion to $25.7 billion over the same period, which is the mechanism a bank uses to absorb credit losses before they hit the income statement. A reserve growing roughly in step with a growing loan book is what disciplined underwriting looks like; a reserve spiking faster than loan growth is worth watching for in future quarters.
Shareholder Returns: The Buyback Machine
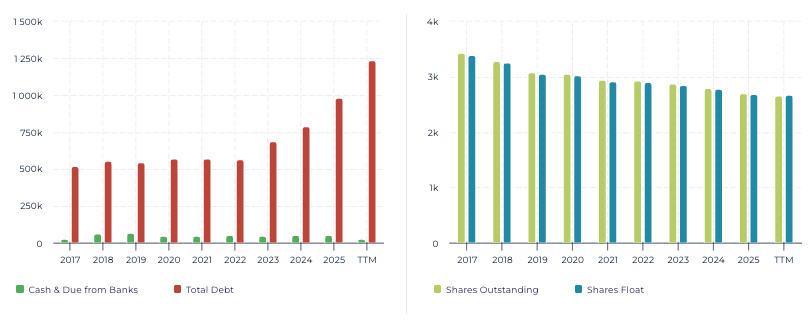
Shares Outstanding vs. Shares Float — Powered by StockOracle™ Accurate as of 20 July 2026
Shares outstanding have declined from roughly 3.3 billion in 2017 to about 2.6 billion on a trailing basis. Each remaining share now owns a slightly larger piece of the bank, and that compounding has continued: JPMorgan raised its quarterly dividend to $1.65 per share and authorized a new $50 billion share repurchase program effective July 1, 2026. That's capital return running on two tracks at once, dividend growth and reduced share count funded entirely out of a business that just posted record earnings.
Economic Moat: Why Scale Is the Advantage
StockOracle™ rates JPMorgan a Wide OracleMoat™, and the reasoning is structural rather than sentimental. JPMorgan operates as a true universal bank. Consumer deposits, commercial lending, investment banking, trading, and asset management all under one roof, at a scale competitors can't easily replicate.
It serves roughly 84 million U.S. customers and holds over 11% of the U.S. retail deposit market, giving it a funding cost advantage that smaller banks can't match. Bank of America competes on comparable retail scale but with a less dominant capital markets franchise; Goldman Sachs and Morgan Stanley run leaner, trading-and-advisory-weighted models without JPMorgan's deposit base to fund them cheaply.
None of these rivals combine the same breadth of consumer reach, balance sheet size, and capital markets firepower in one institution. Which is precisely what lets JPMorgan keep growing across cycles.
Final Thoughts on JPMorgan's Intrinsic Value
The business itself isn't in question. Record earnings, expanding returns, and a moat built on scale few banks can touch.
What's in question is whether a bank trading at the richest book-value multiple of its recent history can keep growing into that price when its own CEO is the one flagging that we are very close to the top of the cycle.
If ROE keeps expanding the way it has for the past decade, the current premium starts to look earned rather than borrowed. If it reverts, the multiple has further to fall than the earnings do.
This analysis is shared for educational purposes and is not intended as financial advice or a recommendation on any investment. OracleValue™ is an estimate and should not be taken as a signal to buy or sell. Any past performance mentioned is not indicative of future results.